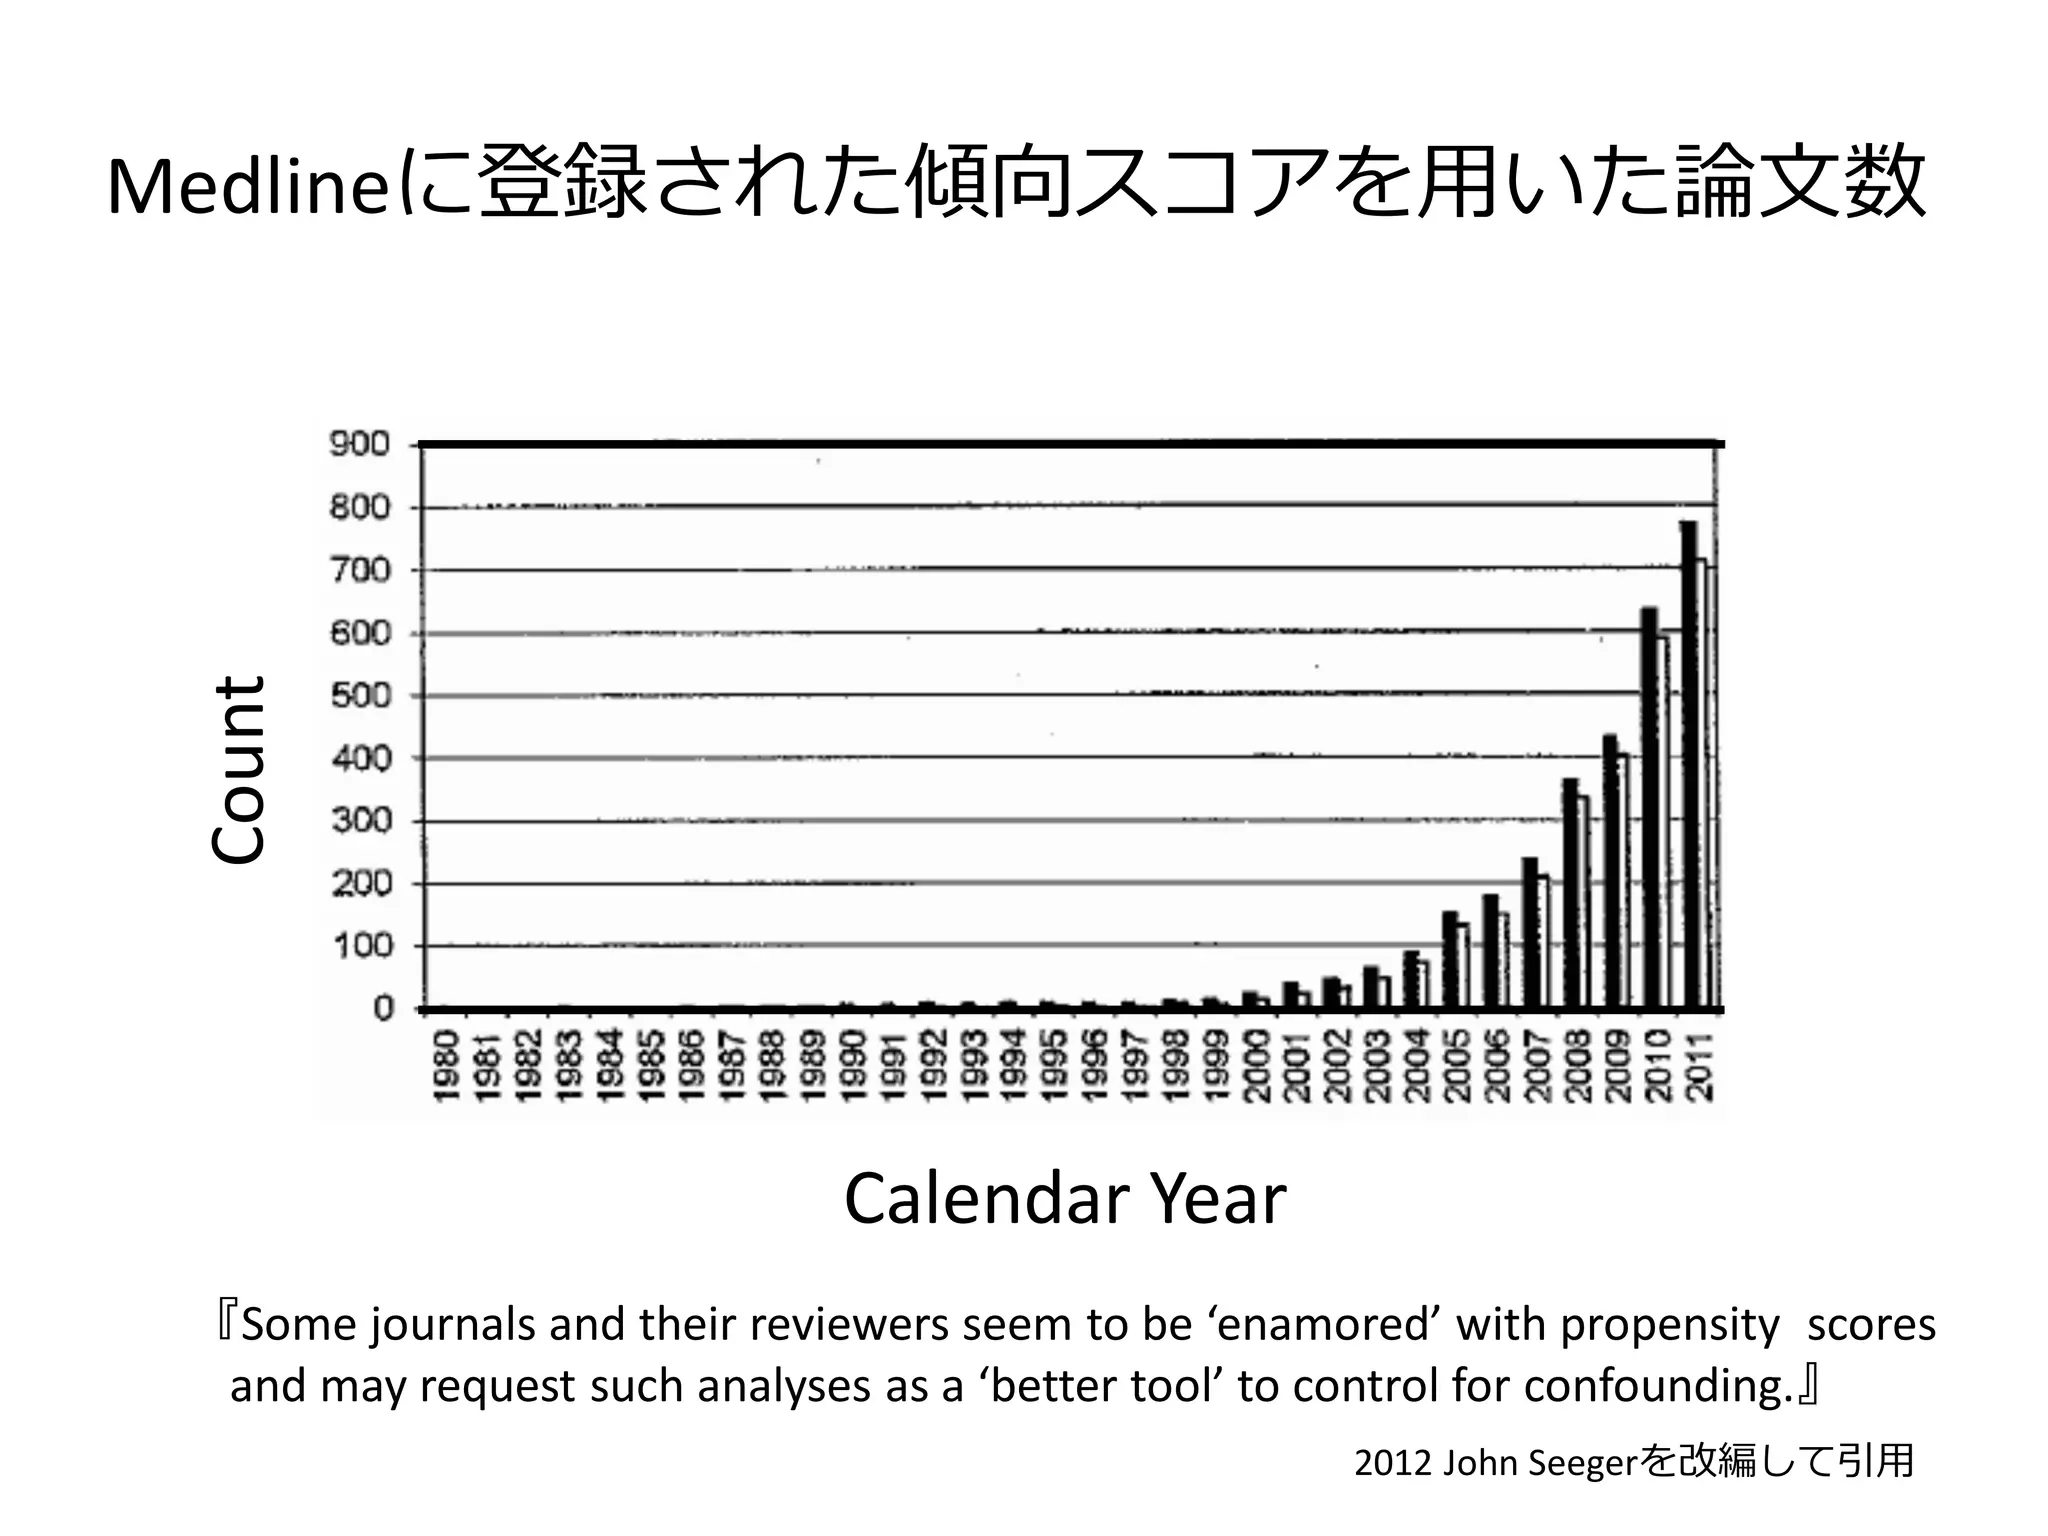
Exposure propensity score
Patientsnever
treated with study drug
% of subjects
Patients always
treated with study drug
0.5
0
= treated with study drug
1
= treated with comparison drug
2012 John Seegerを改編して引用
5.
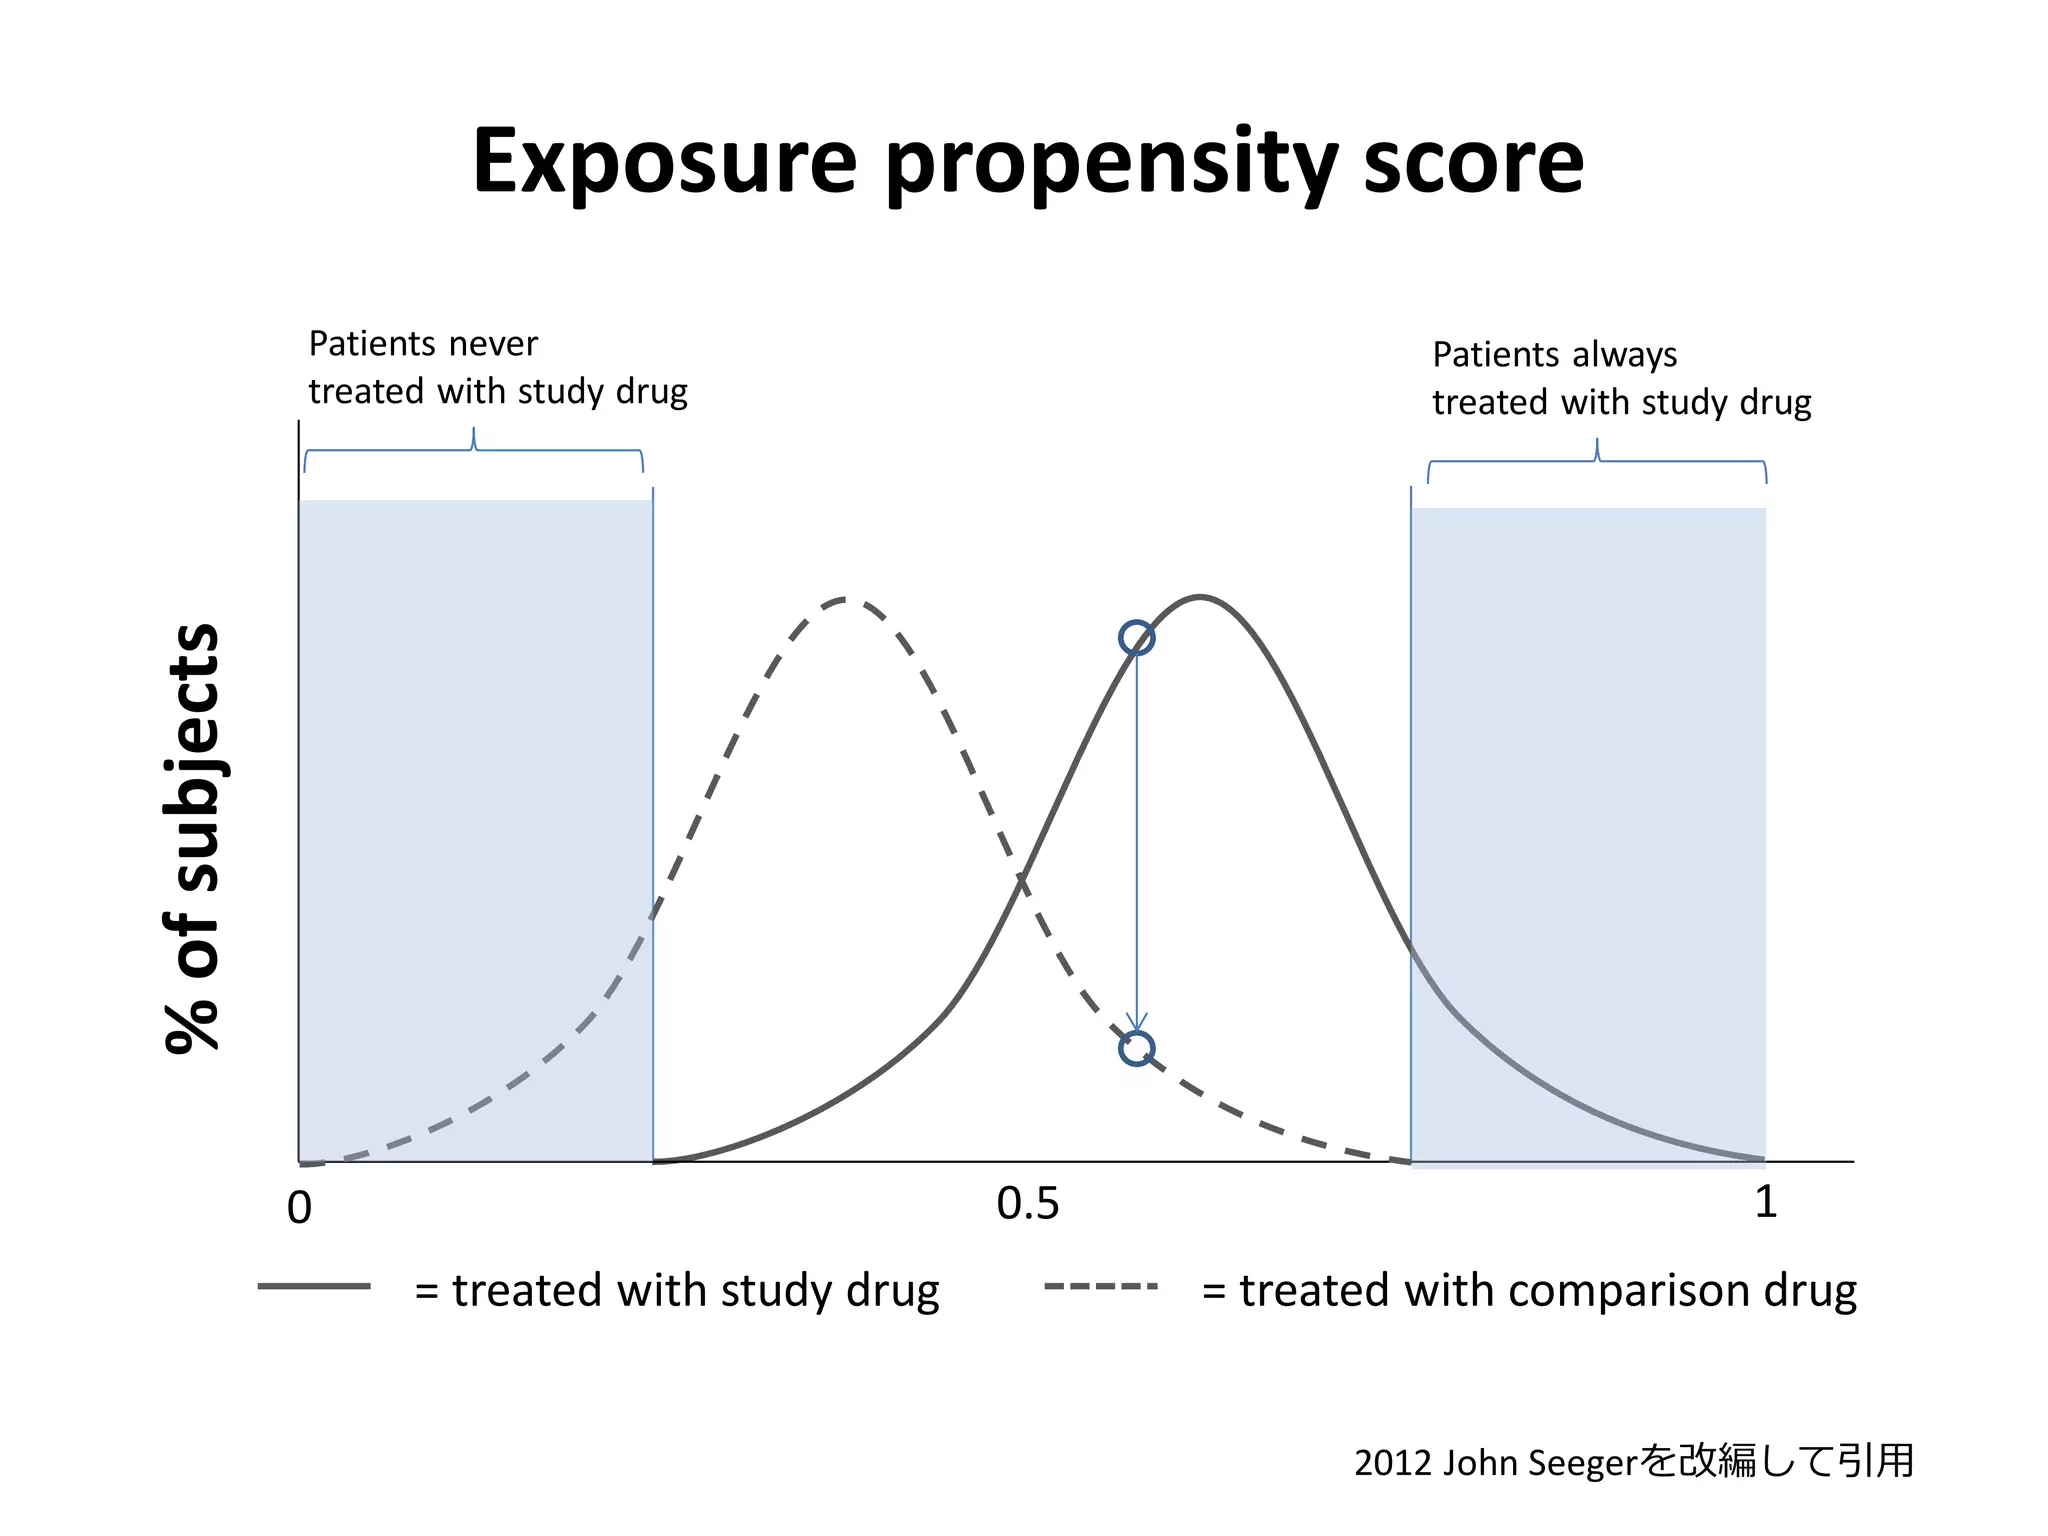
PS distribution aftermatching
Patients never
treated with study drug
% of subjects
Patients always
treated with study drug
0.5
0
= treated with study drug
1
= treated with comparison drug
2012 John Seegerを改編して引用
6.
傾向スコアを用いた2論文
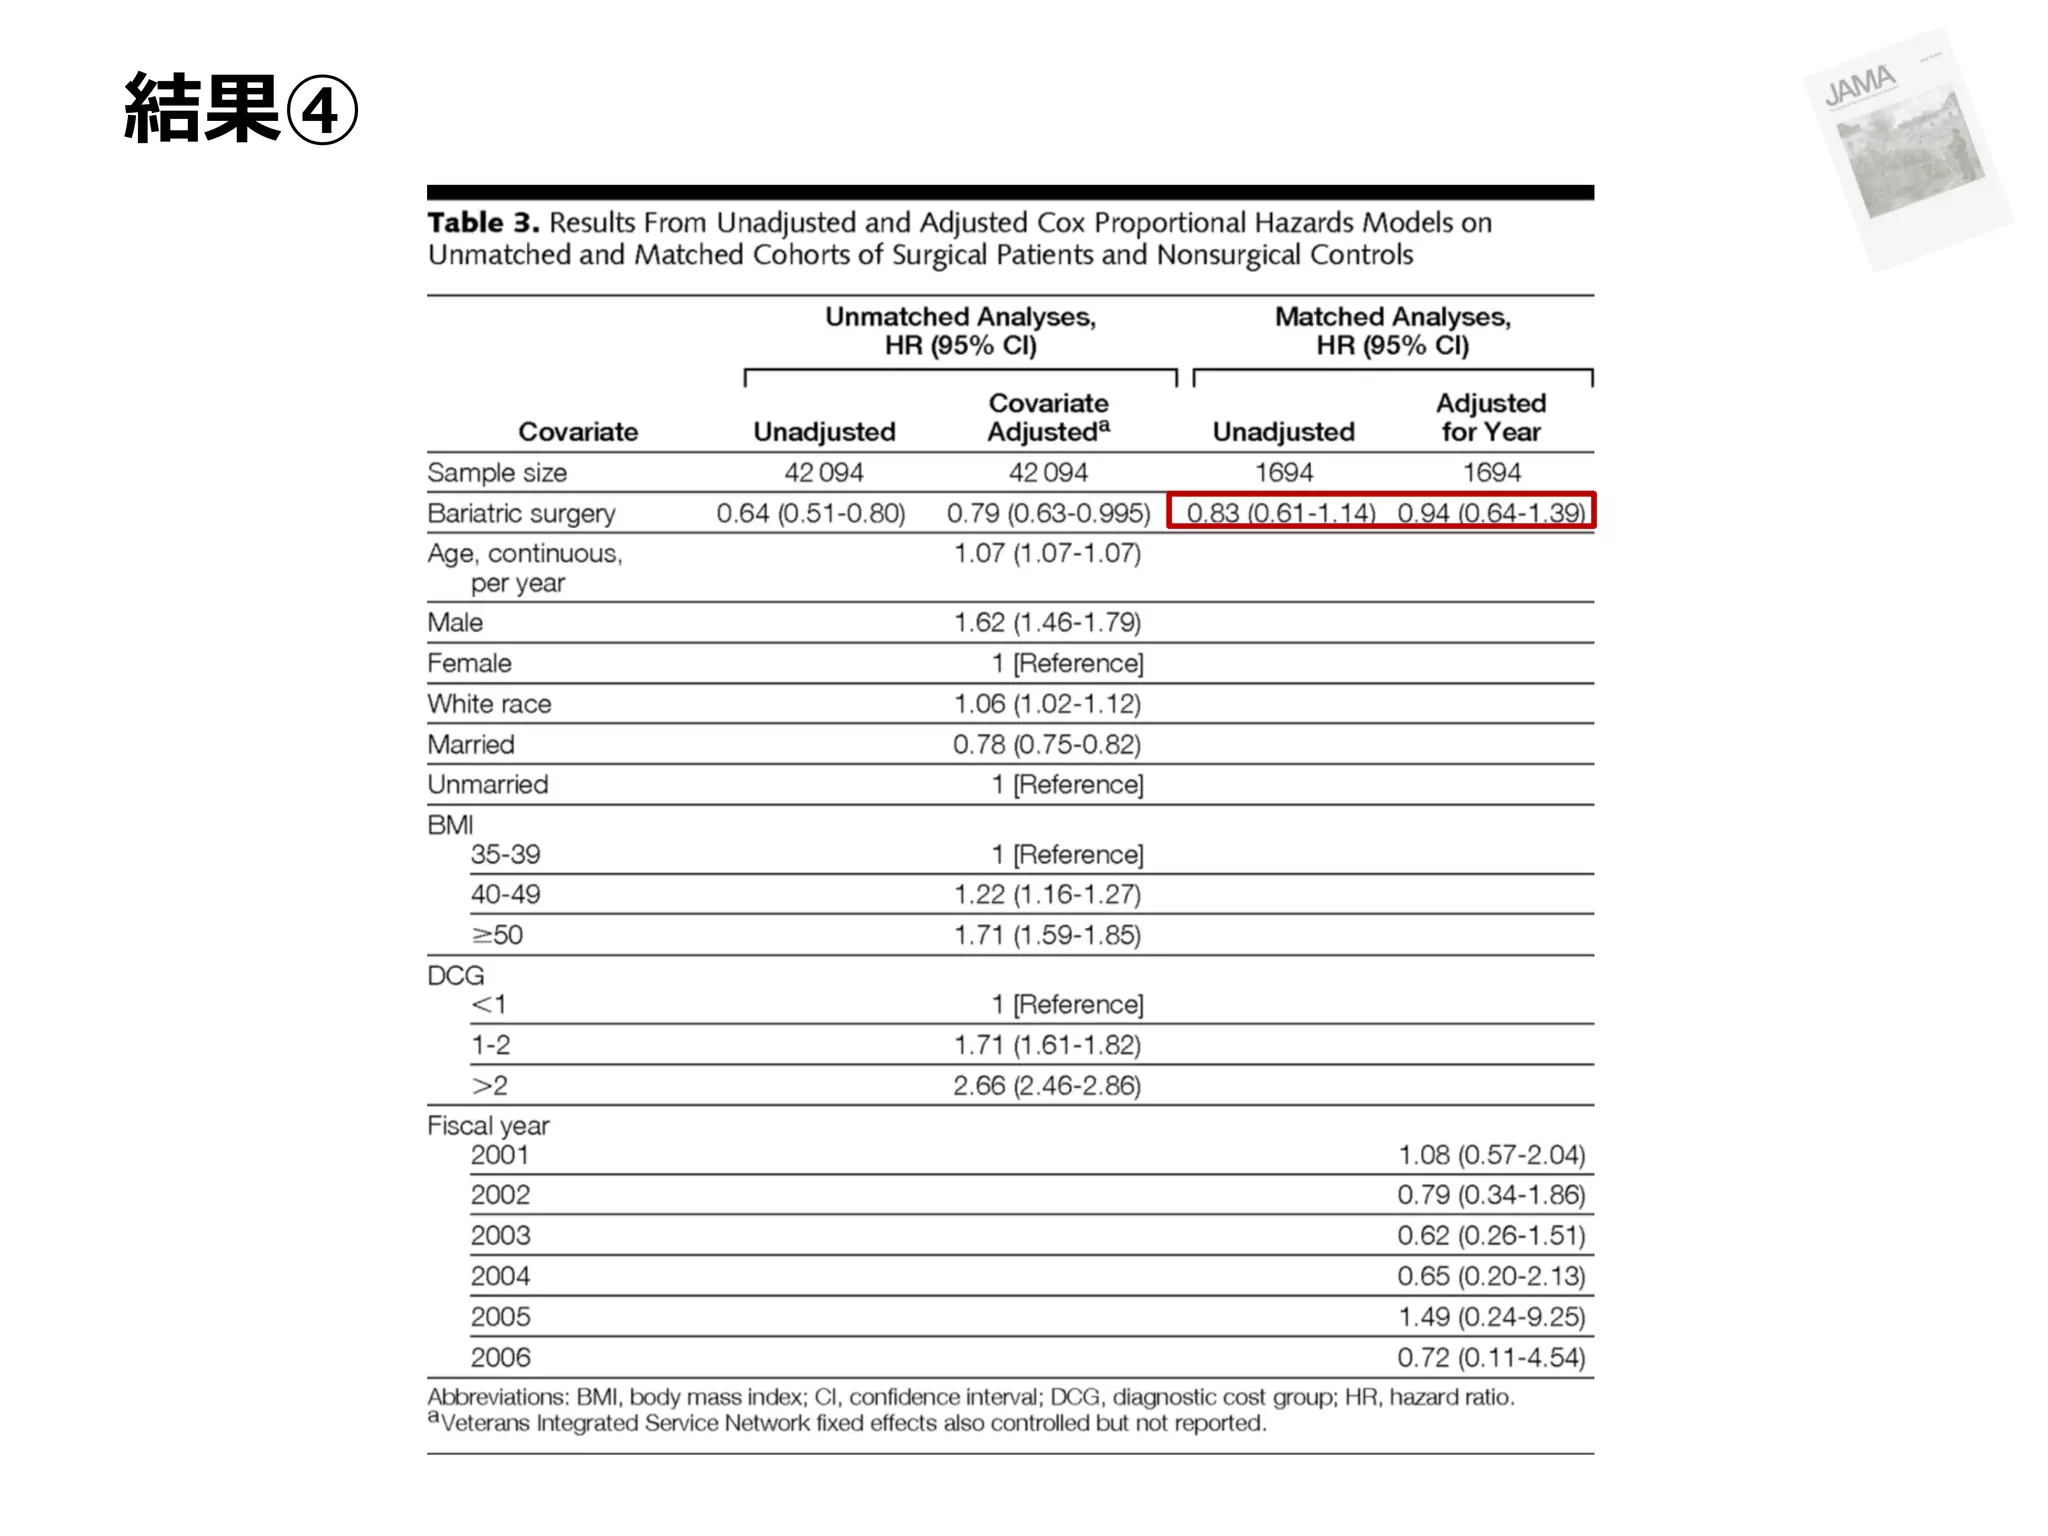
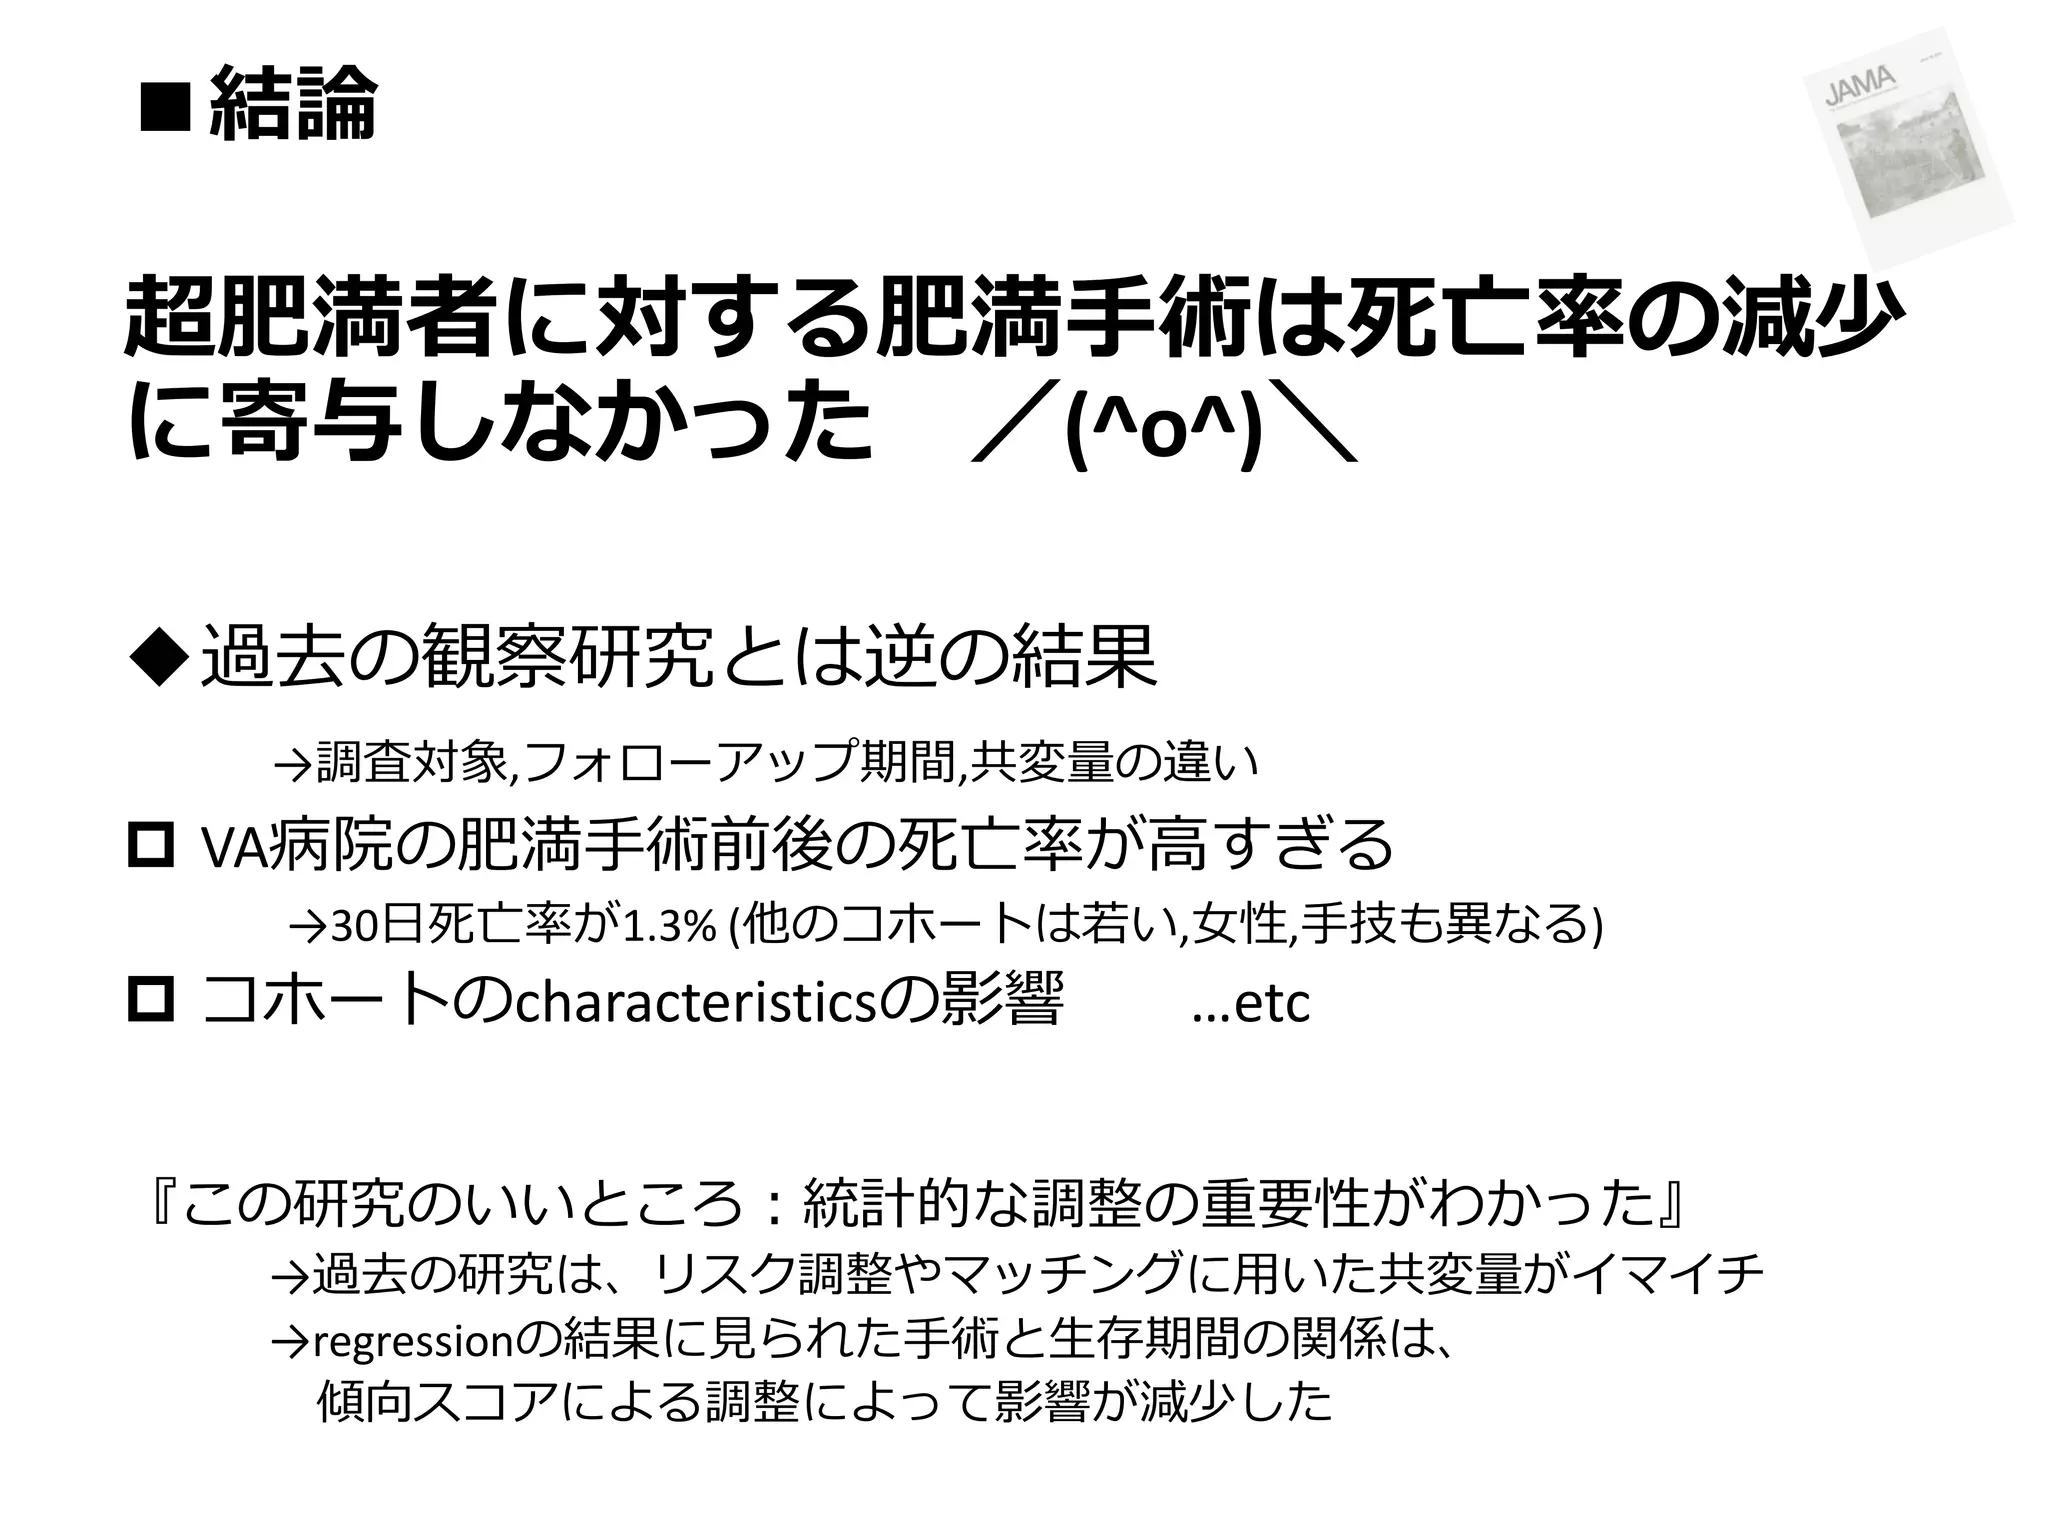
1. Survival amonghigh-risk patients after bariatric
surgery.
Maciejewski ML LE. JAMA. 2011; 305: 2419–26. doi:10.1001/jama.2011.817.
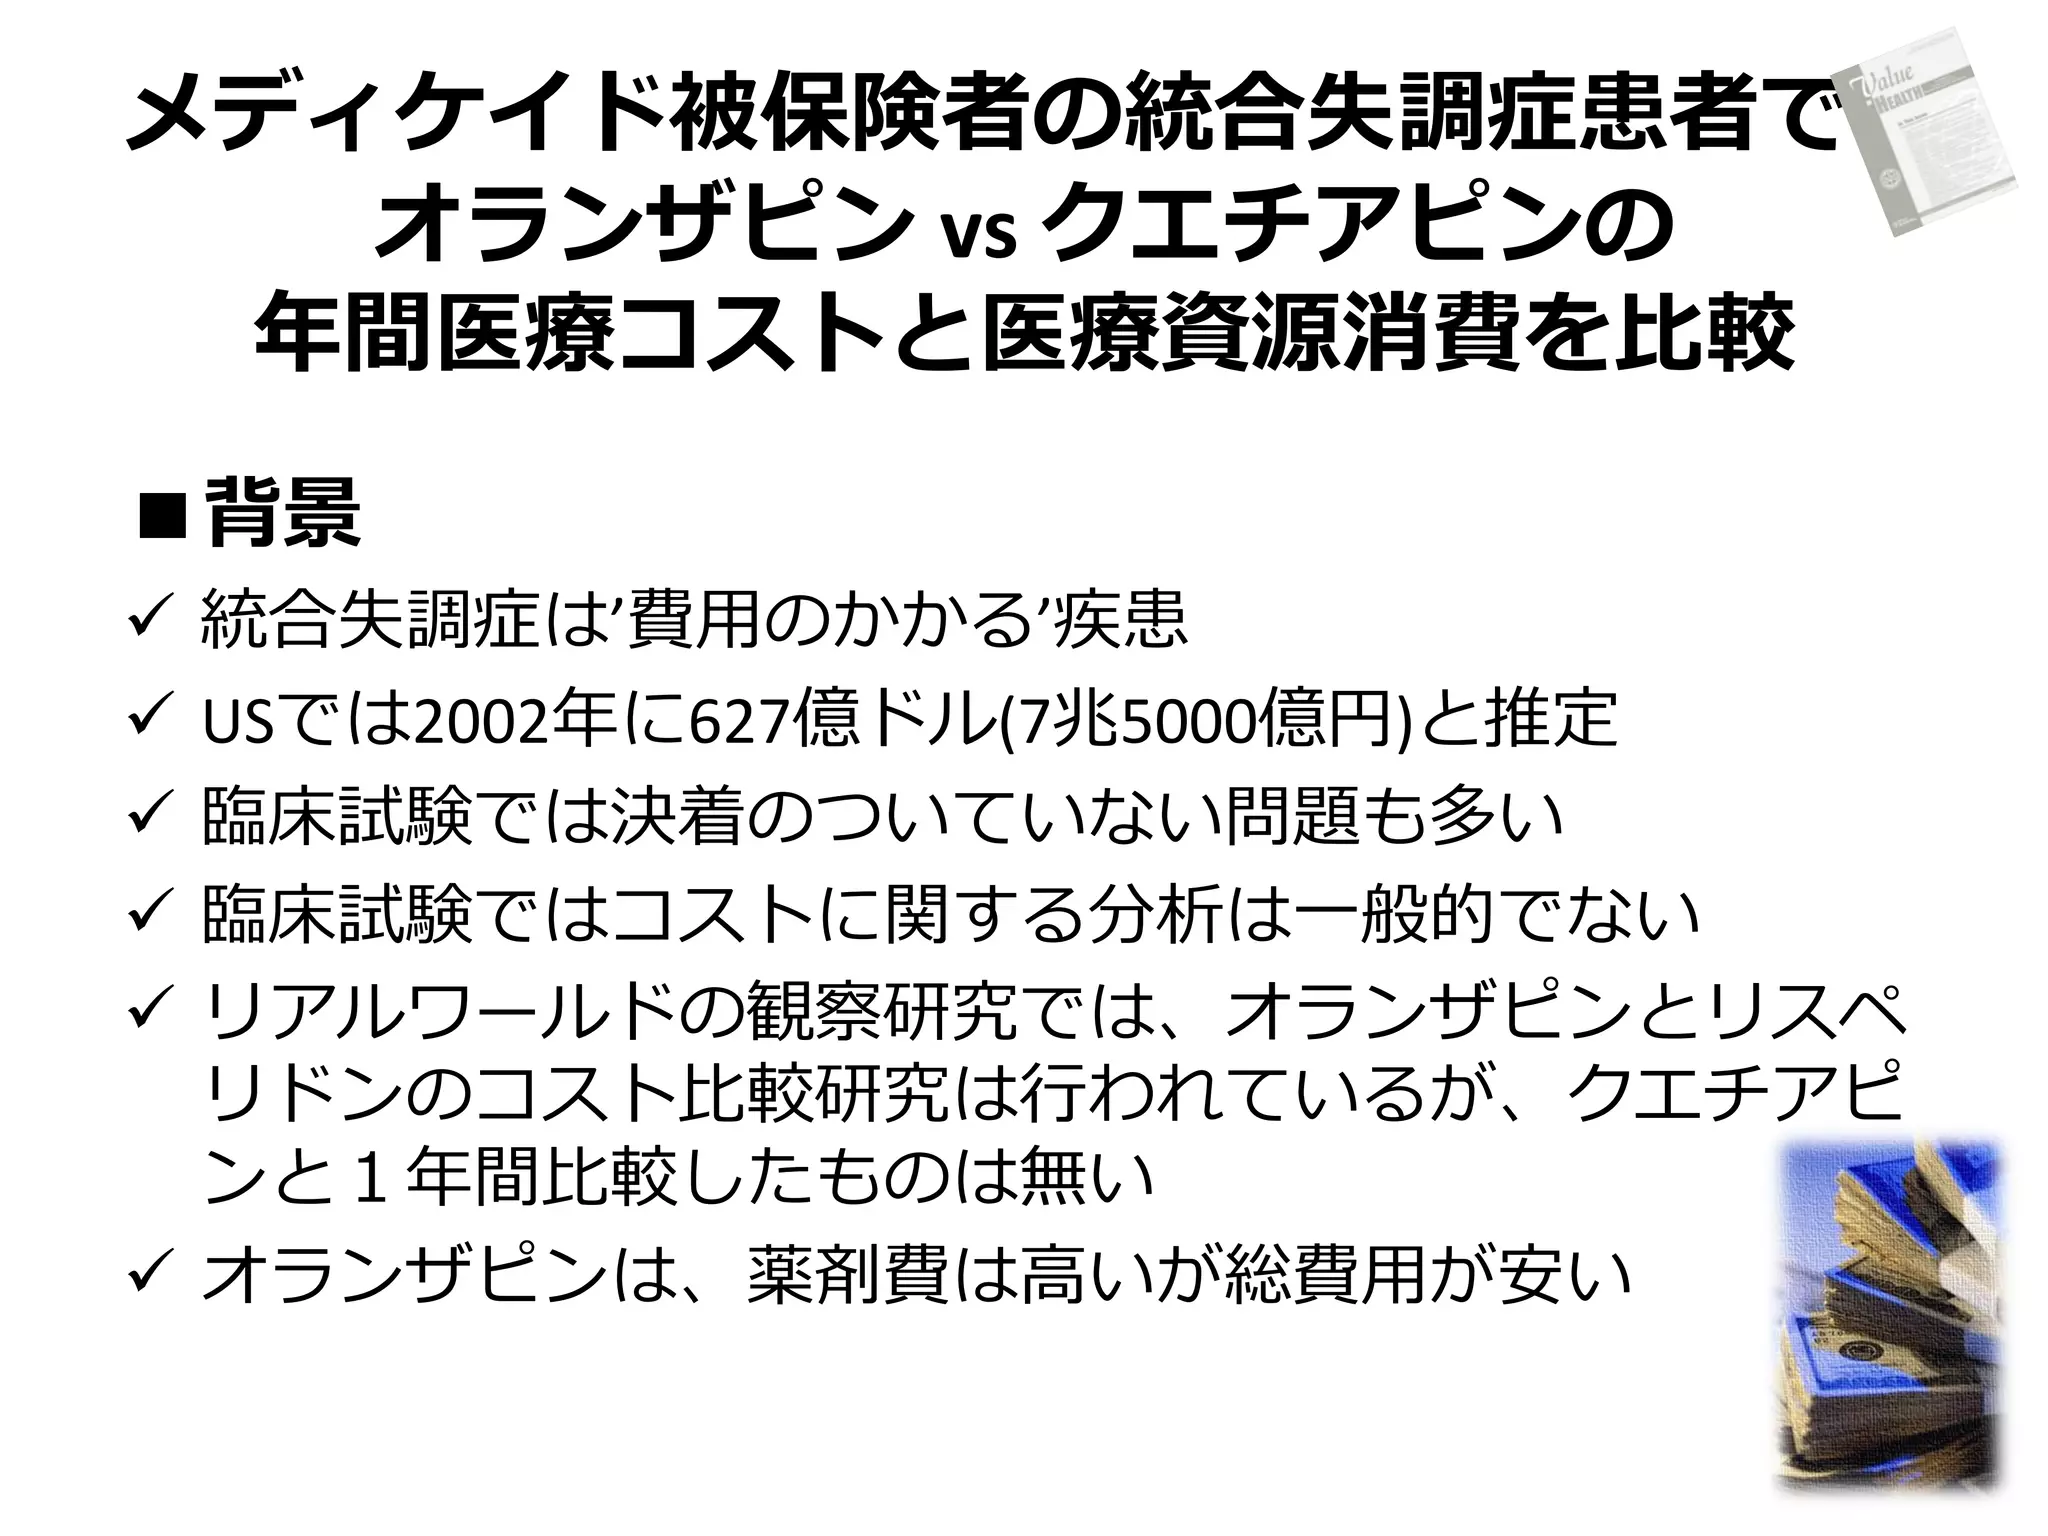
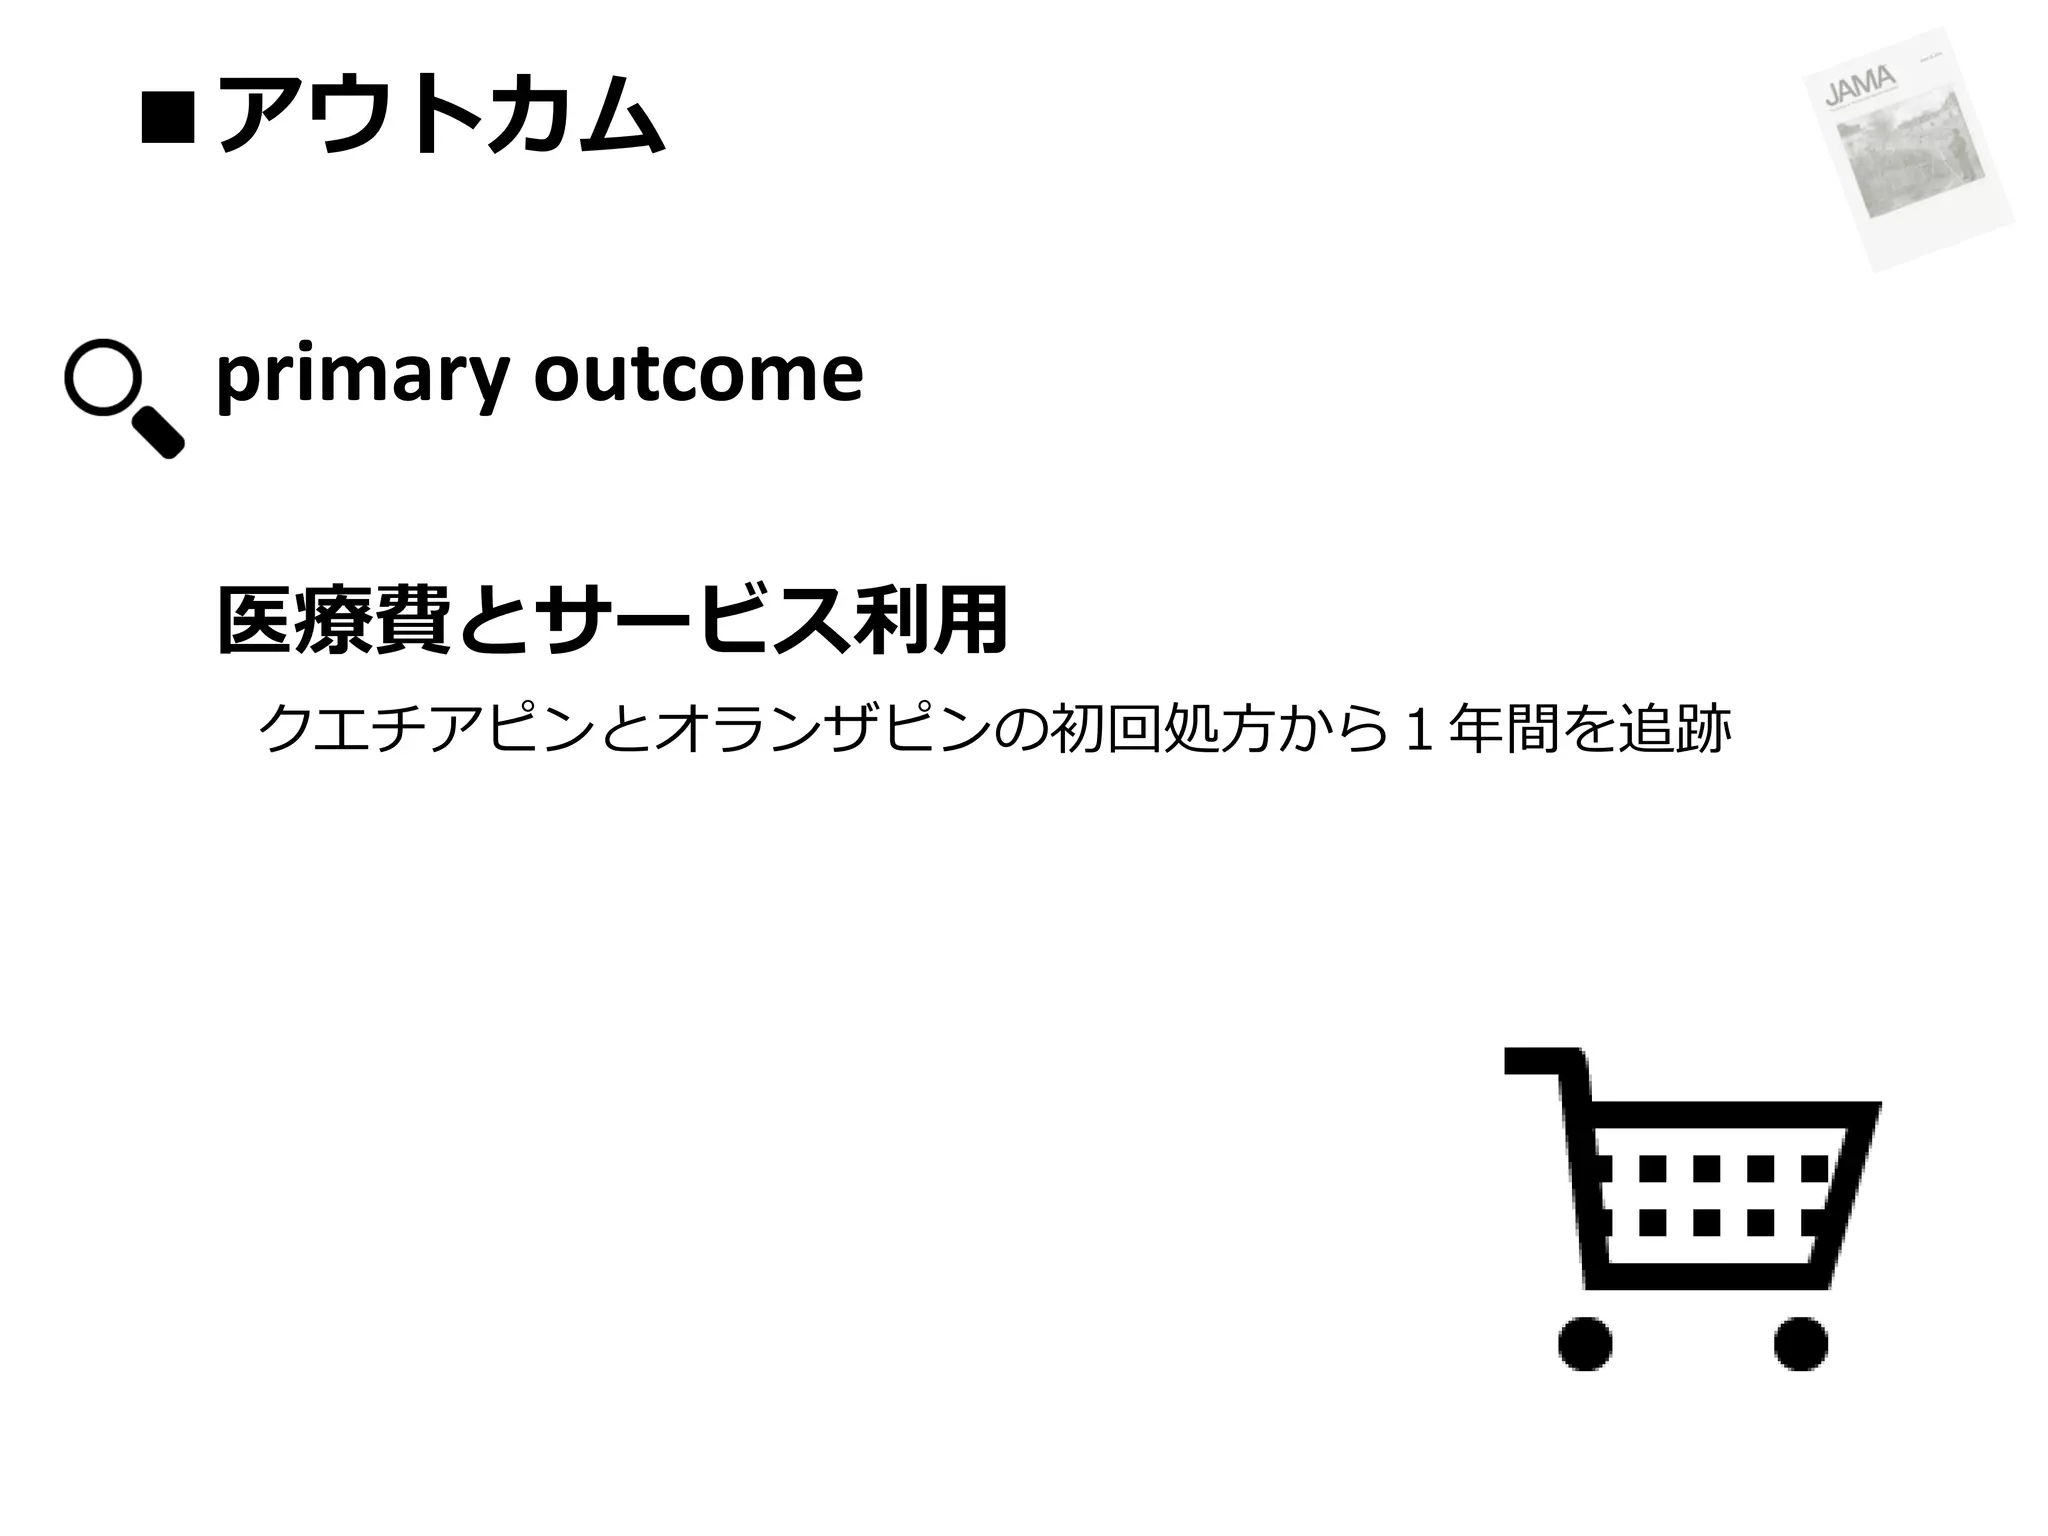
2. Resource Utilization and Costs of Schizophrenia
Patients Treated with Olanzapine versus Quetiapine
in a Medicaid Population.
Yu AP, Atanasov P, Ben‐Hamadi R, Birnbaum H, Stensland MD, Philips G. Value in Health. 2009; 12: 708–
15.
7.
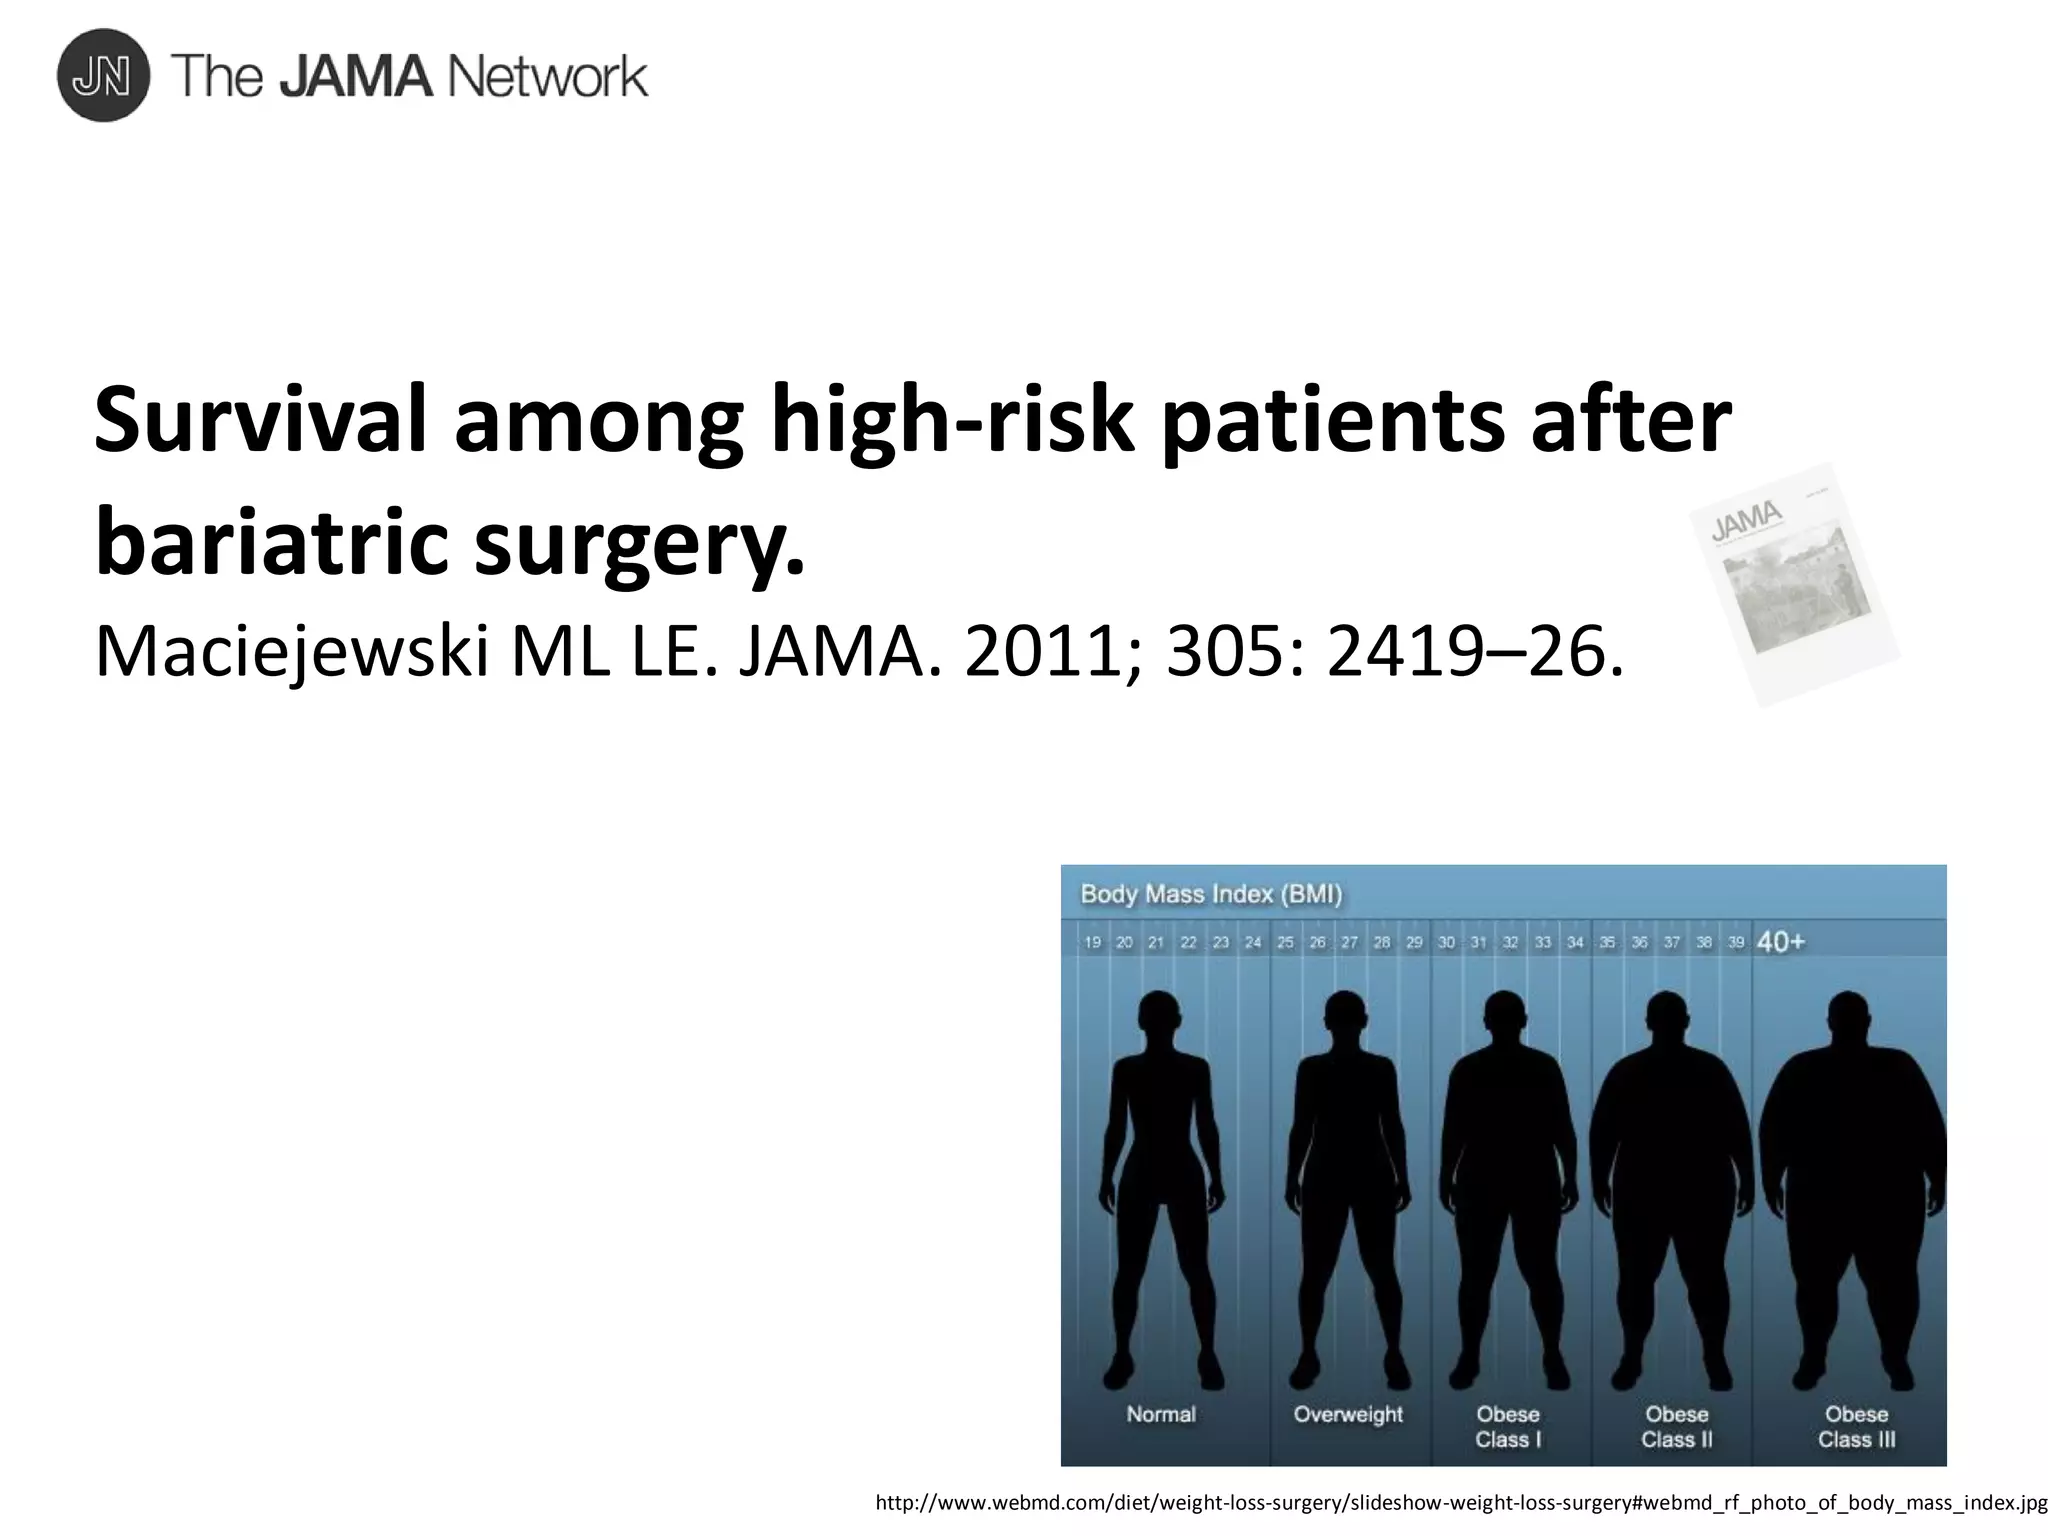
Survival among high-riskpatients after
bariatric surgery.
Maciejewski ML LE. JAMA. 2011; 305: 2419–26.
http://www.webmd.com/diet/weight-loss-surgery/slideshow-weight-loss-surgery#webmd_rf_photo_of_body_mass_index.jpg
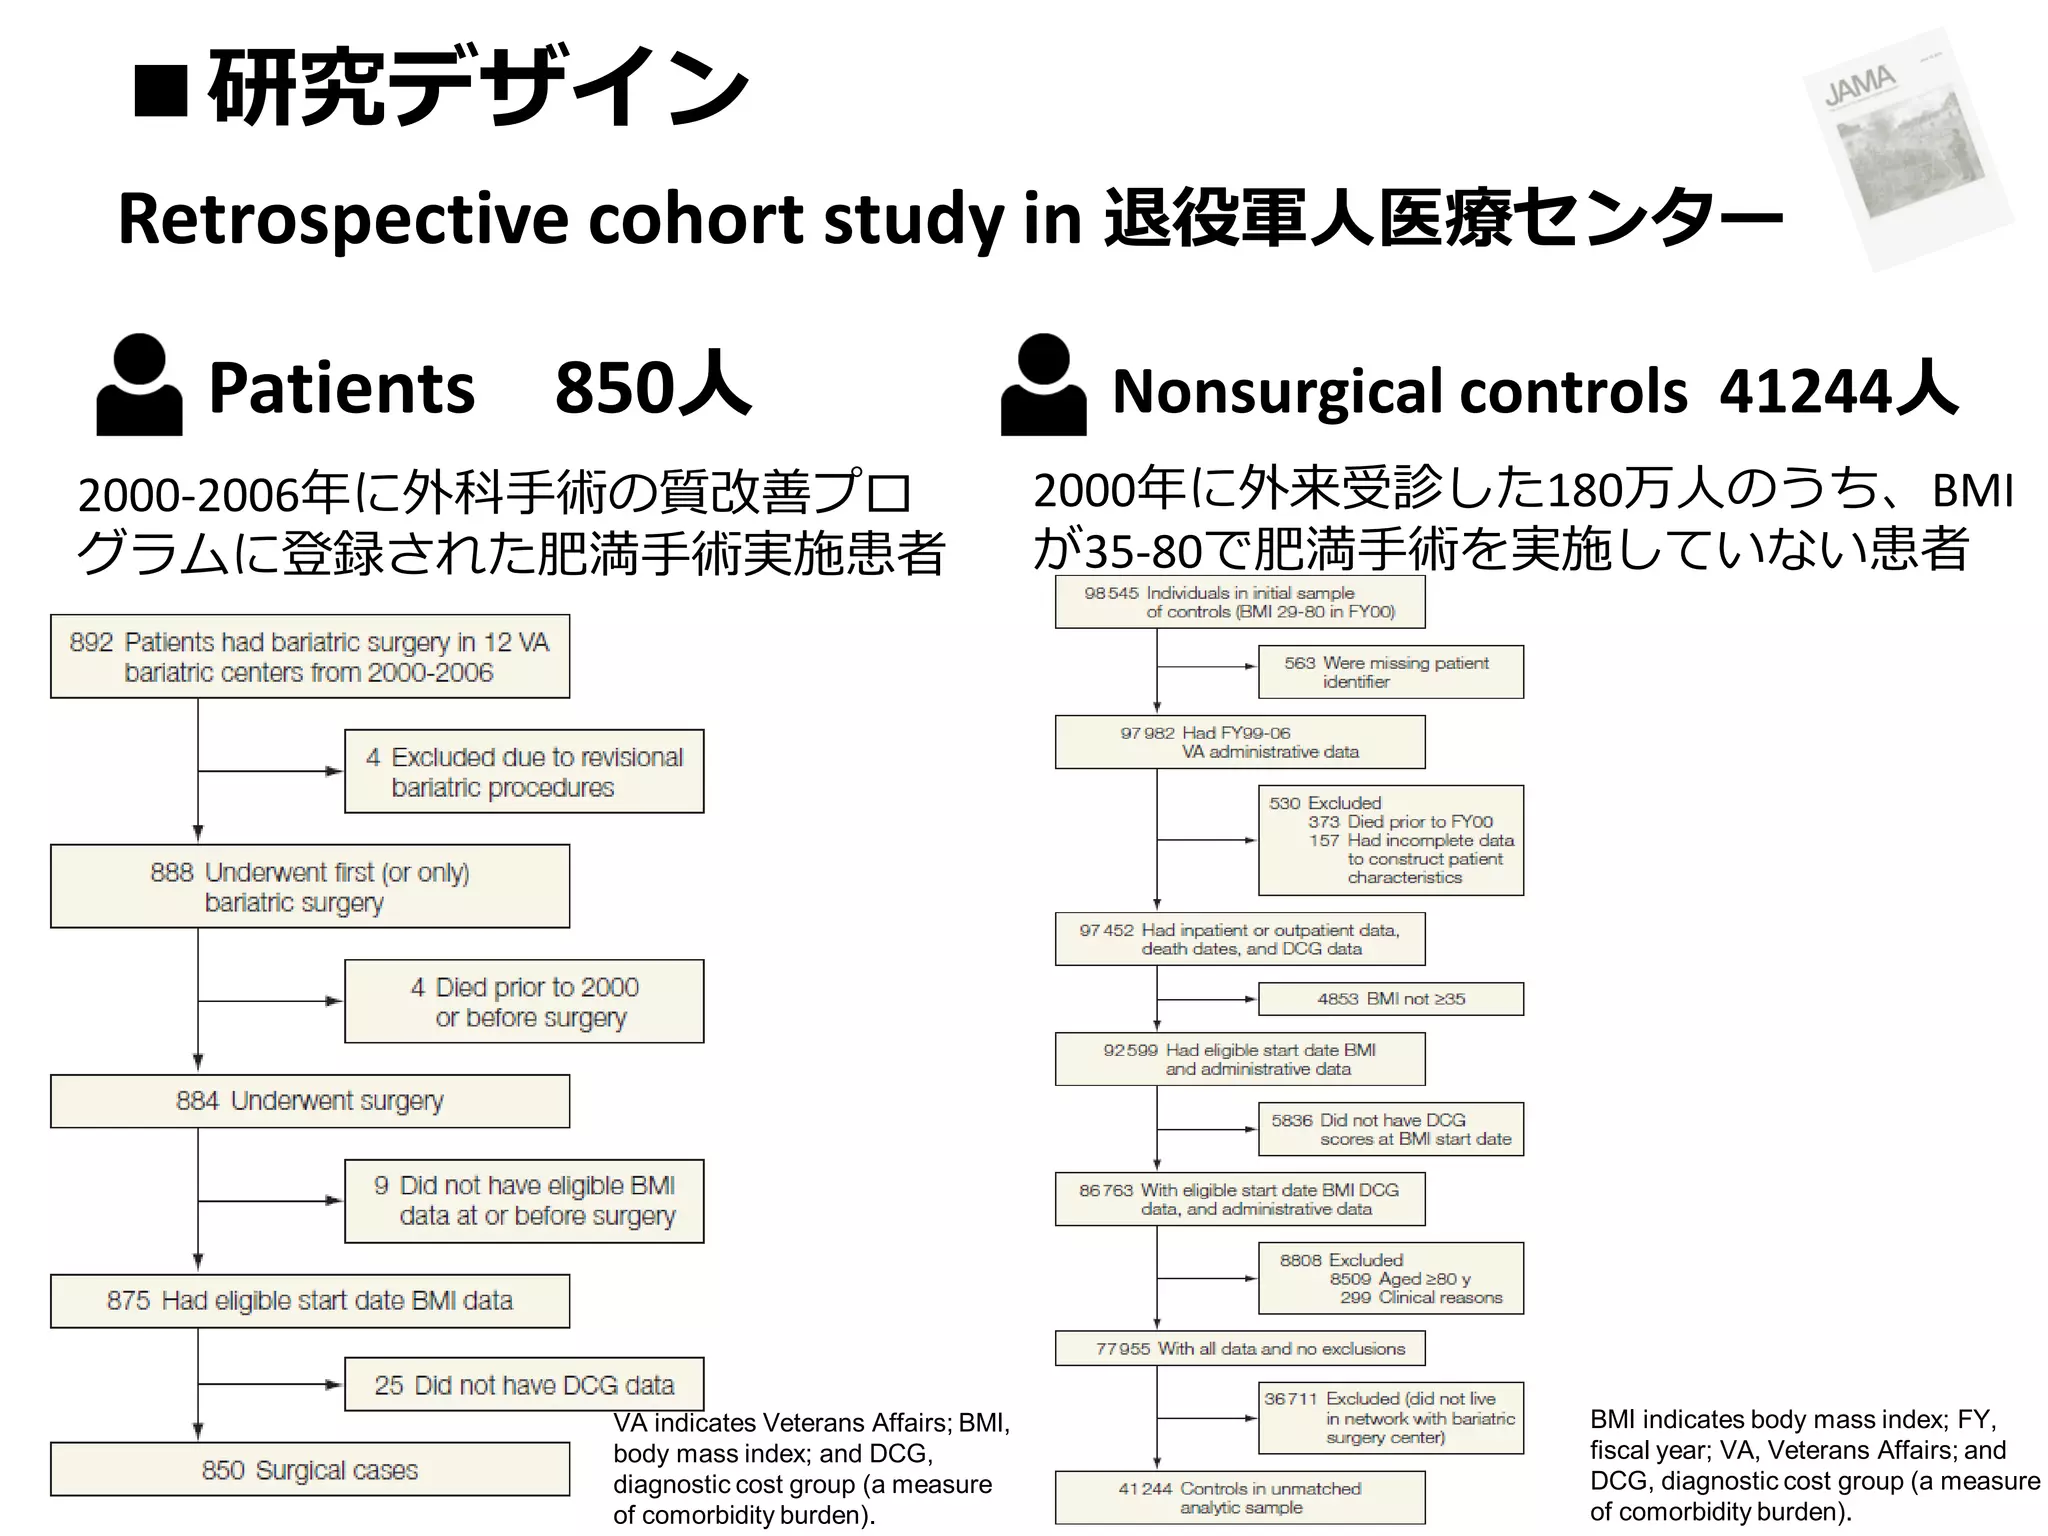
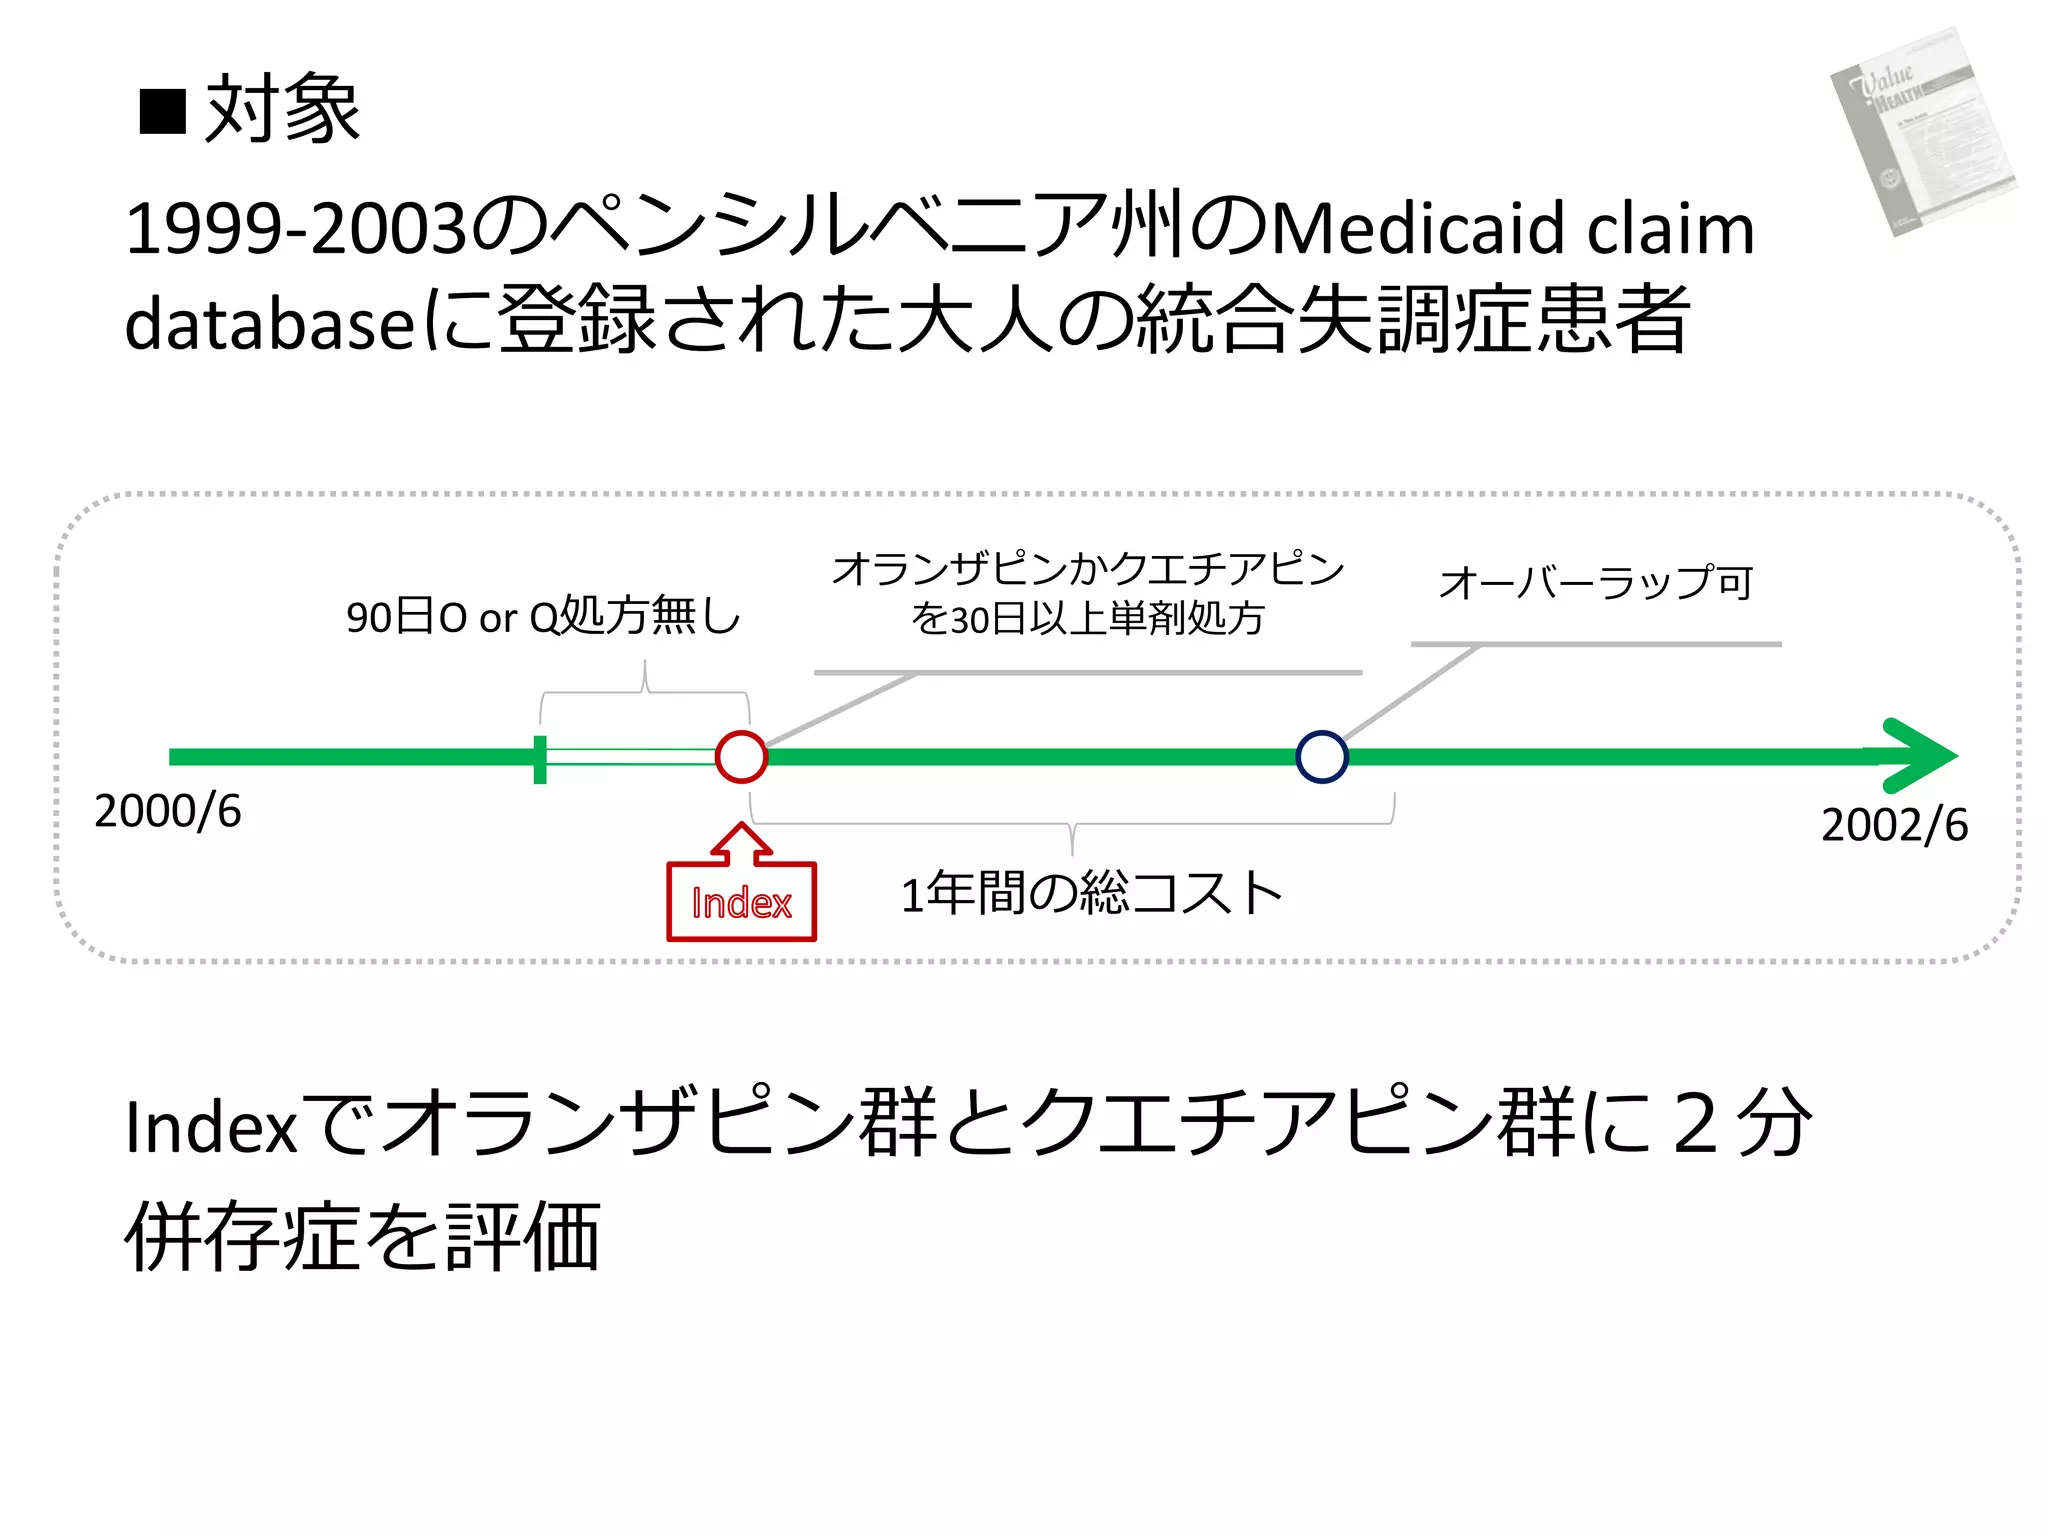
■研究デザイン
Retrospective cohort studyin 退役軍人医療センター
Patients 850人
2000-2006年に外科手術の質改善プロ
グラムに登録された肥満手術実施患者
VA indicates Veterans Affairs; BMI,
body mass index; and DCG,
diagnostic cost group (a measure
of comorbidity burden).
Nonsurgical controls 41244人
2000年に外来受診した180万人のうち、BMI
が35-80で肥満手術を実施していない患者
BMI indicates body mass index; FY,
fiscal year; VA, Veterans Affairs; and
DCG, diagnostic cost group (a measure
of comorbidity burden).
■統計解析 ①
Unadjusted difference
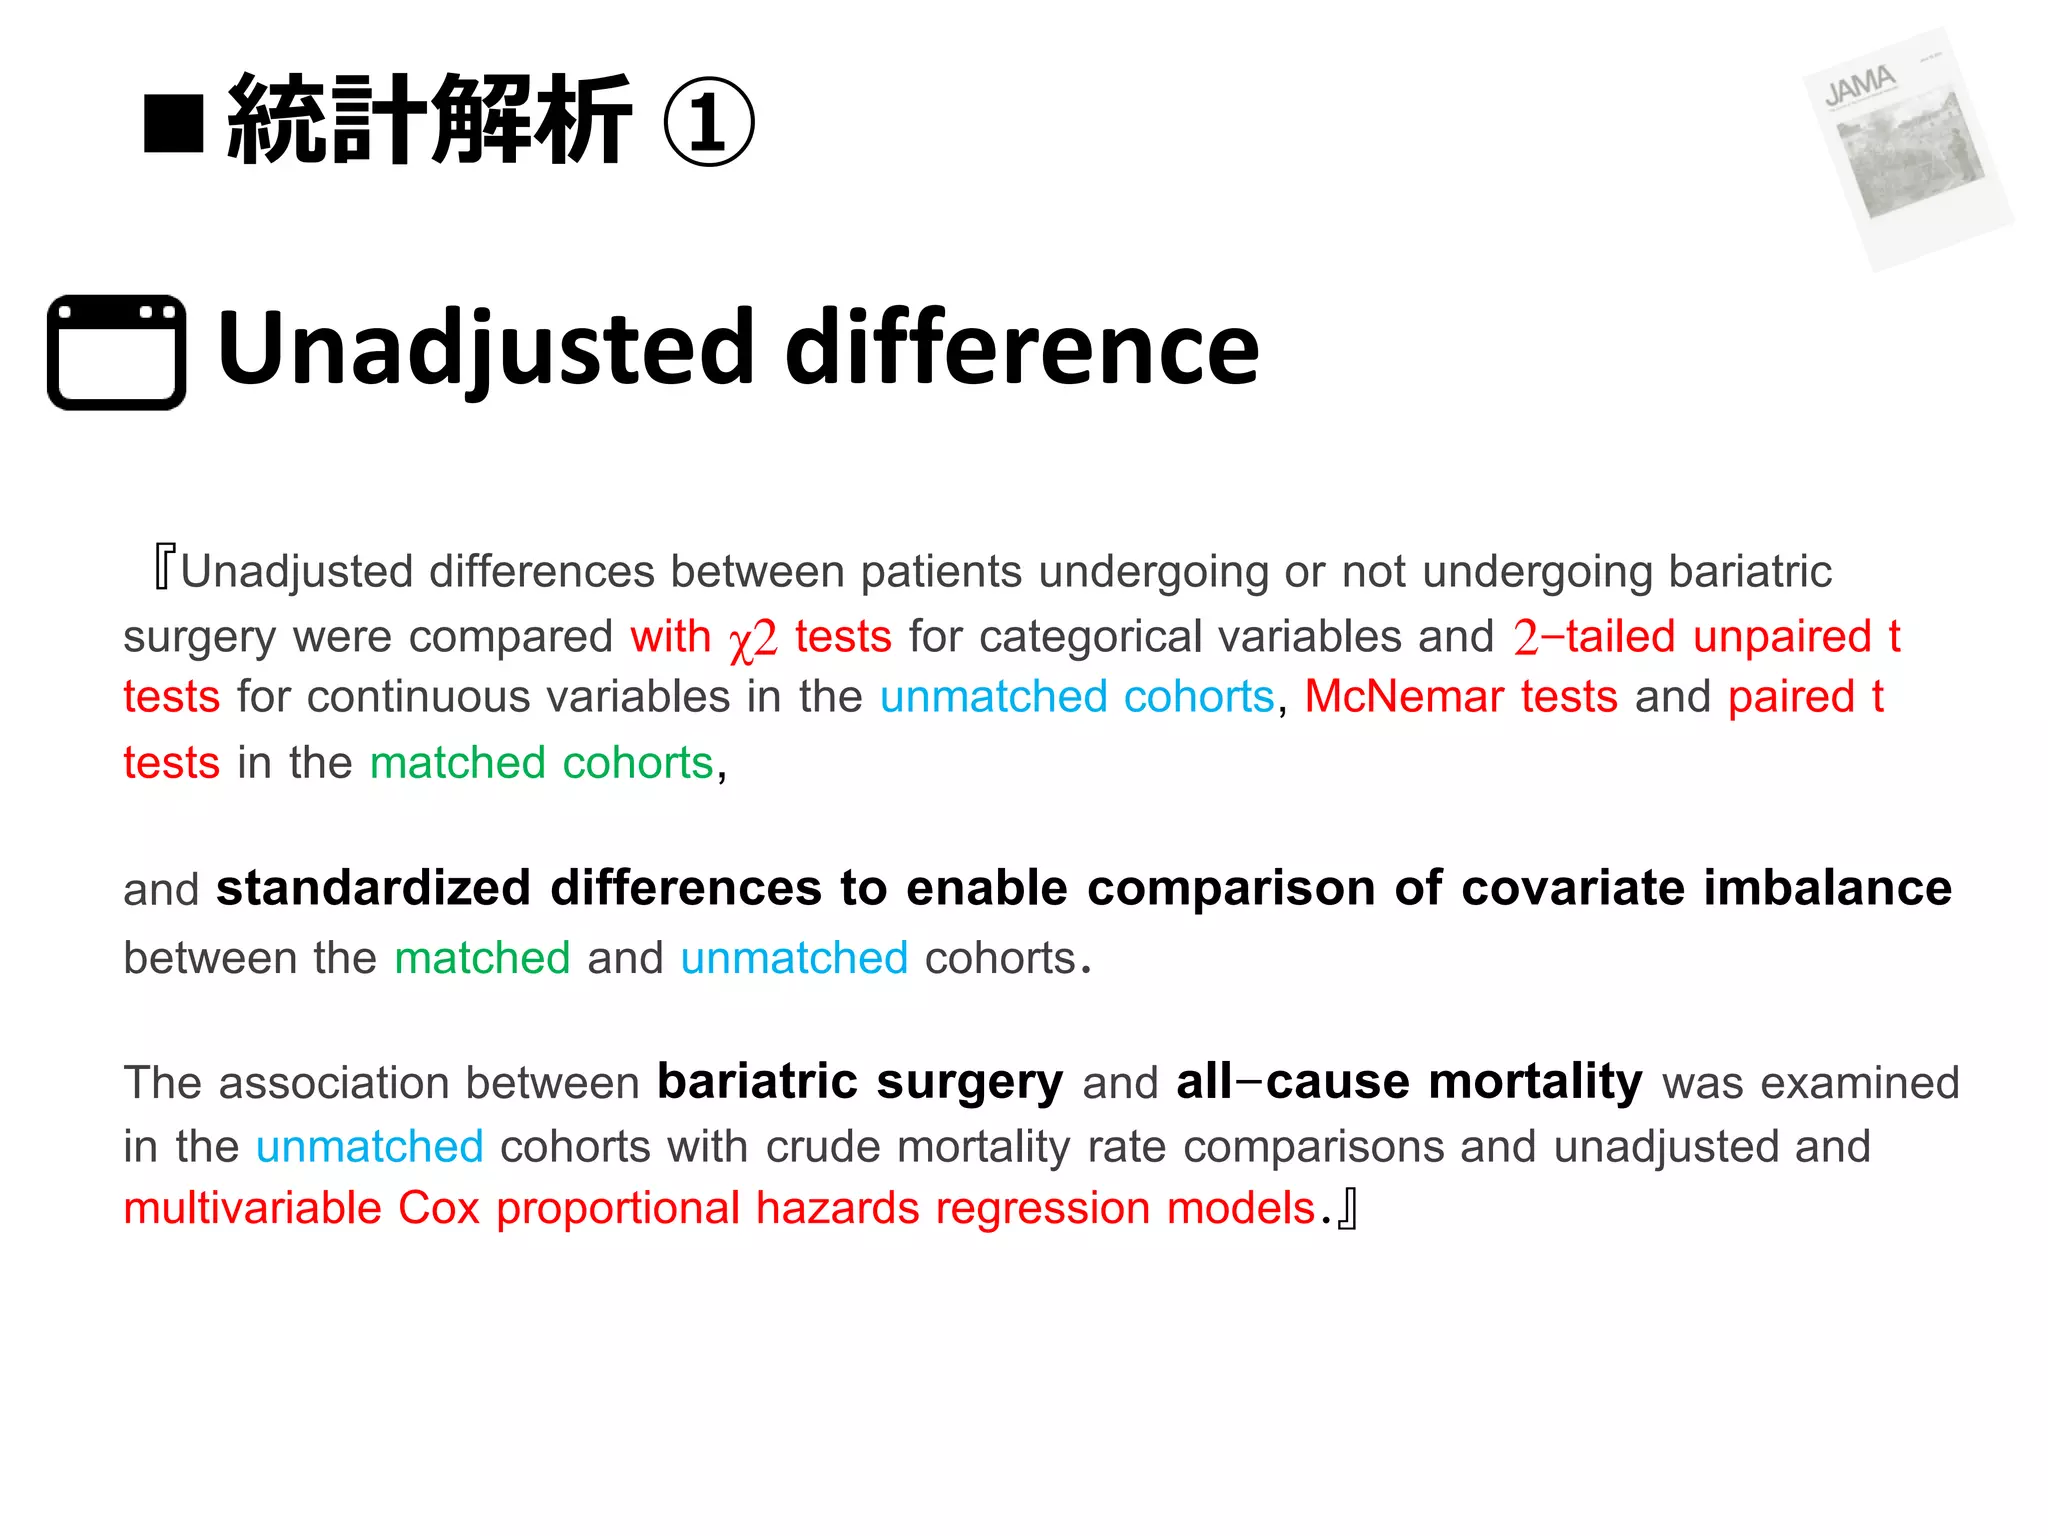
『Unadjusteddifferences between patients undergoing or not undergoing bariatric
surgery were compared with χ2 tests for categorical variables and 2-tailed unpaired t
tests for continuous variables in the unmatched cohorts, McNemar tests and paired t
tests in the matched cohorts,
and standardized differences to enable comparison of covariate imbalance
between the matched and unmatched cohorts.
The association between bariatric surgery and all-cause mortality was examined
in the unmatched cohorts with crude mortality rate comparisons and unadjusted and
multivariable Cox proportional hazards regression models.』
12.
■統計解析 ②
Multivariable Coxmodel
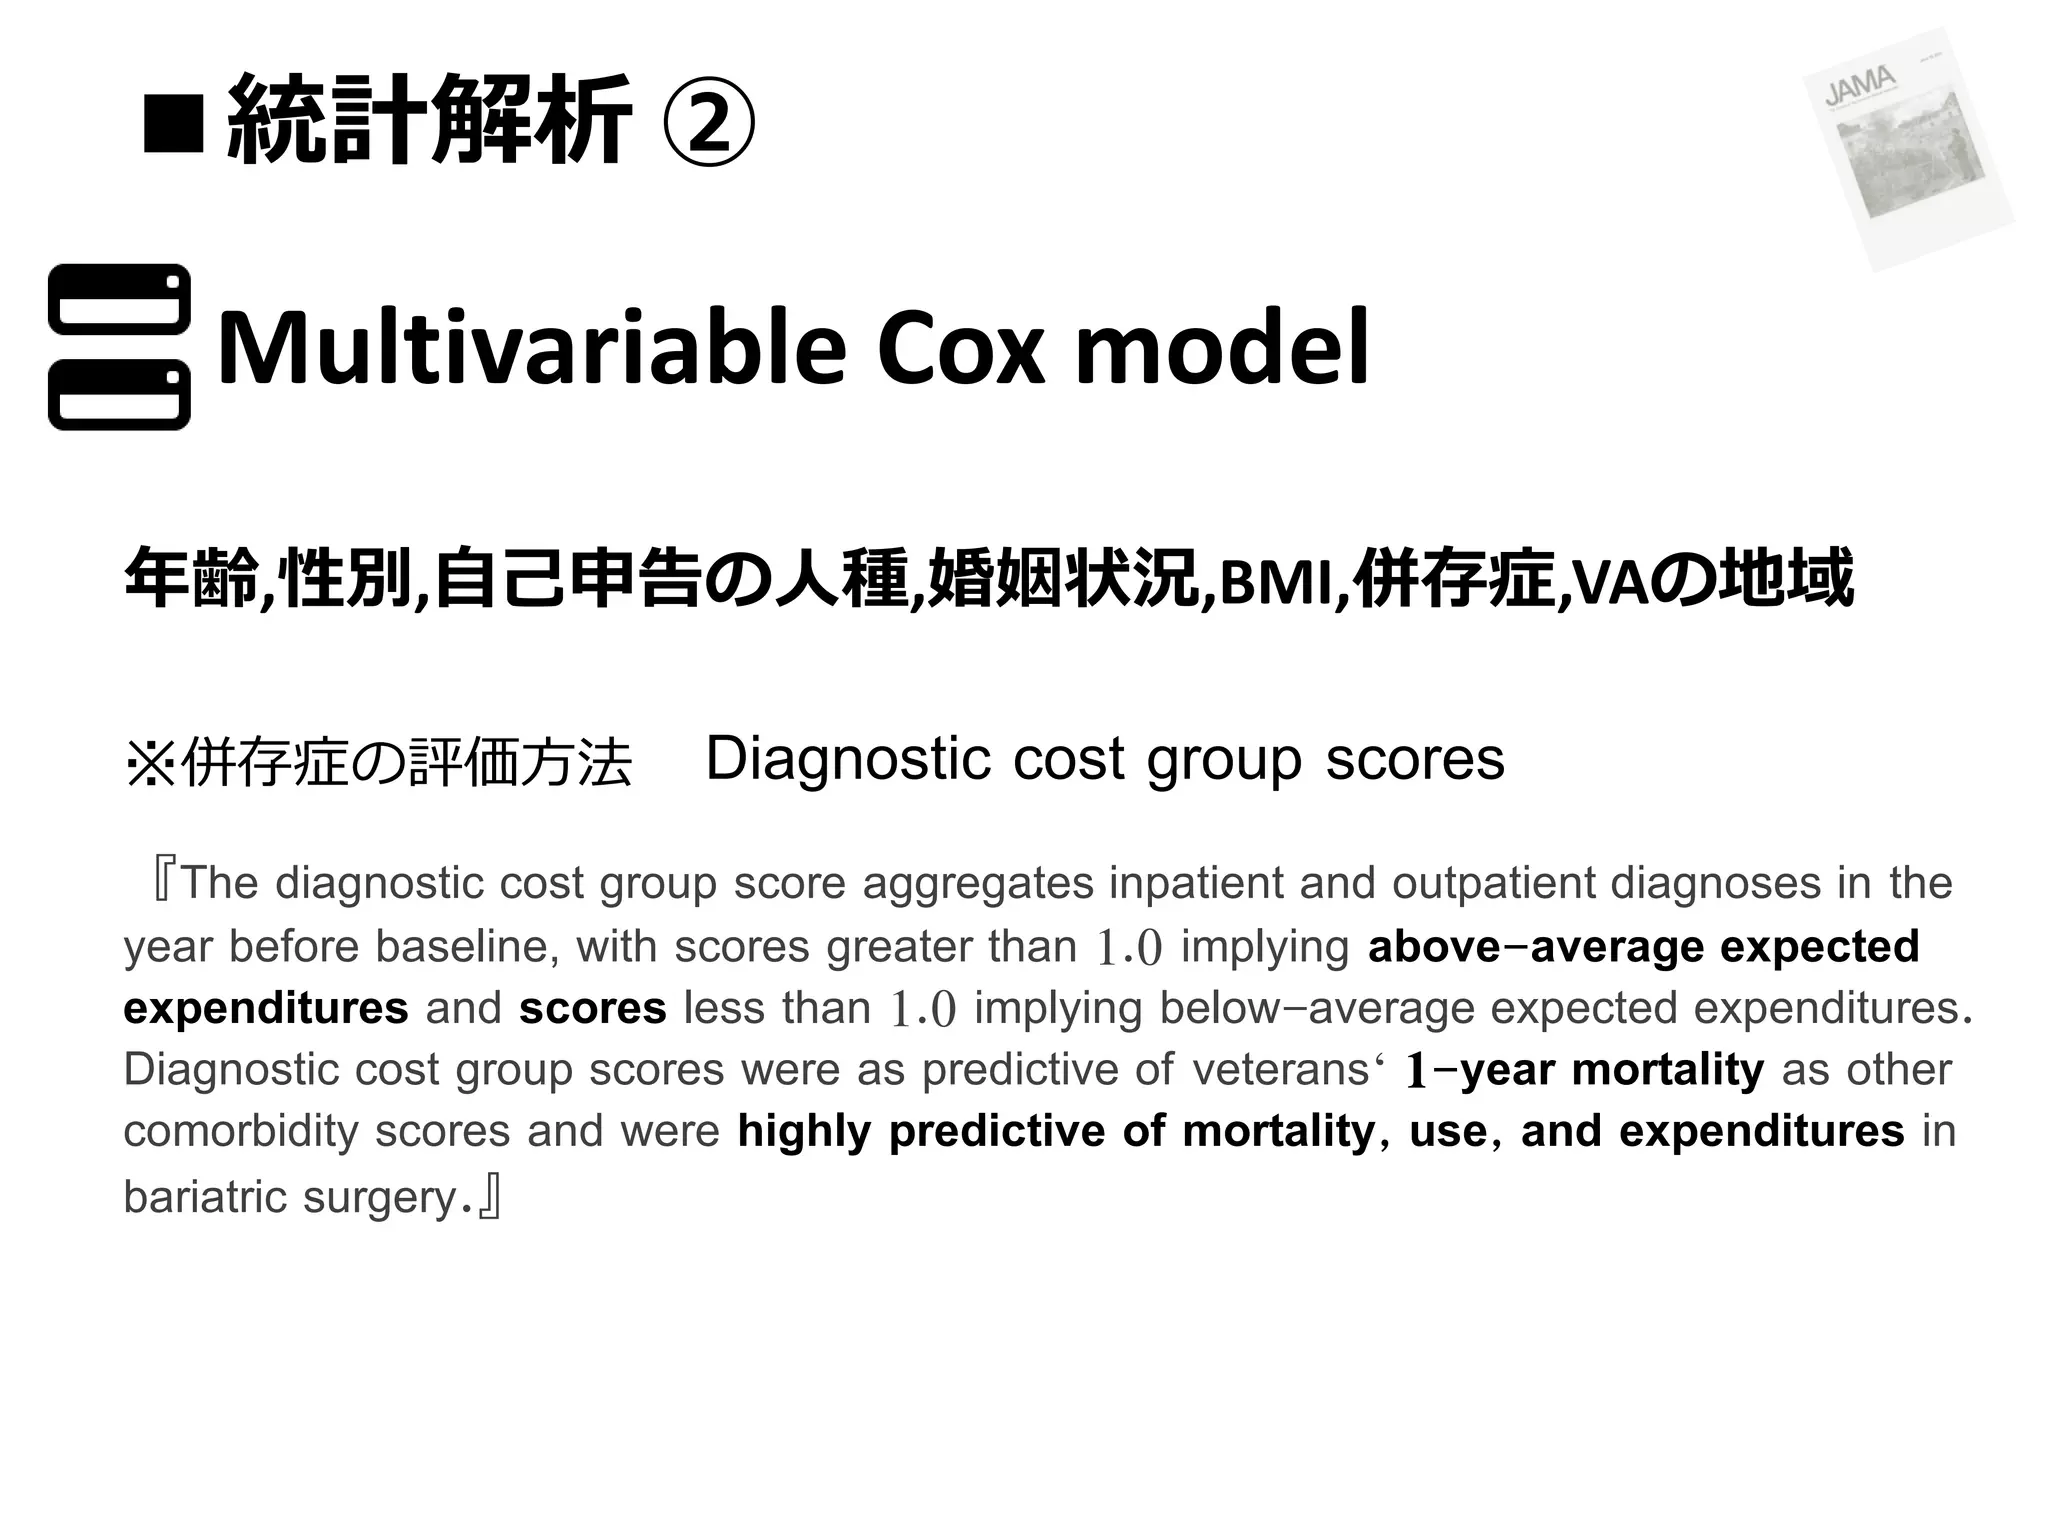
年齢,性別,自己申告の人種,婚姻状況,BMI,併存症,VAの地域
※併存症の評価方法
Diagnostic cost group scores
『The diagnostic cost group score aggregates inpatient and outpatient diagnoses in the
year before baseline, with scores greater than 1.0 implying above-average expected
expenditures and scores less than 1.0 implying below-average expected expenditures.
Diagnostic cost group scores were as predictive of veterans‘ 1-year mortality as other
comorbidity scores and were highly predictive of mortality, use, and expenditures in
bariatric surgery.』
13.
■統計解析 ③
傾向スコアの推定
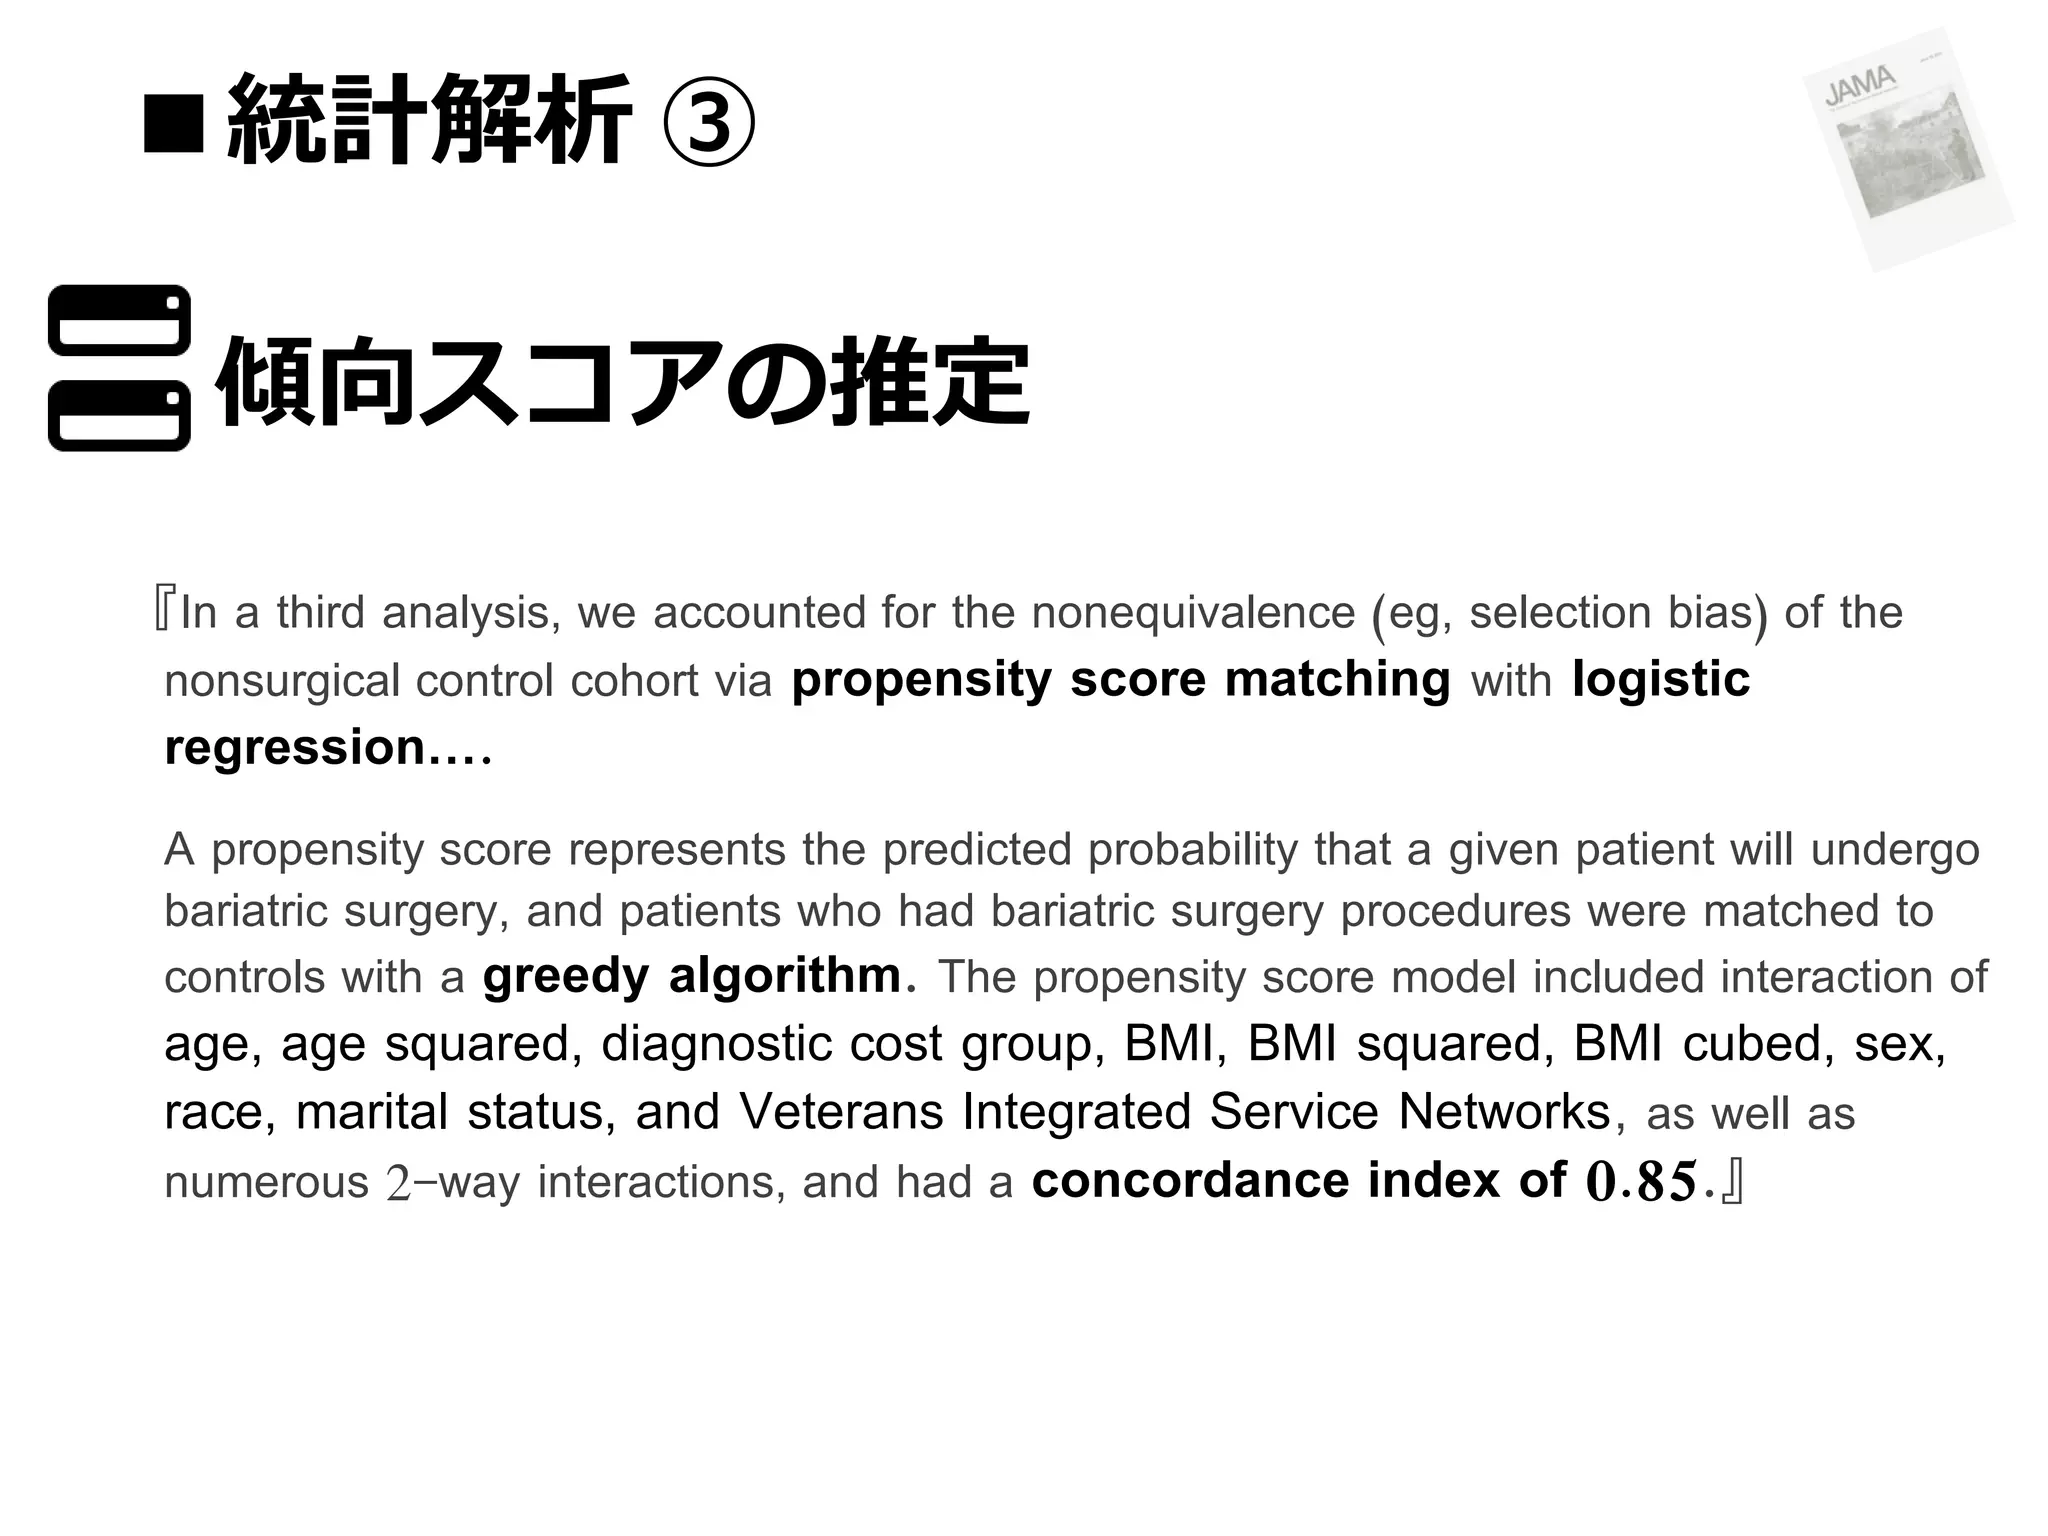
『In athird analysis, we accounted for the nonequivalence (eg, selection bias) of the
nonsurgical control cohort via propensity score matching with logistic
regression….
A propensity score represents the predicted probability that a given patient will undergo
bariatric surgery, and patients who had bariatric surgery procedures were matched to
controls with a greedy algorithm. The propensity score model included interaction of
age, age squared, diagnostic cost group, BMI, BMI squared, BMI cubed, sex,
race, marital status, and Veterans Integrated Service Networks, as well as
numerous 2-way interactions, and had a concordance index of 0.85.』
14.
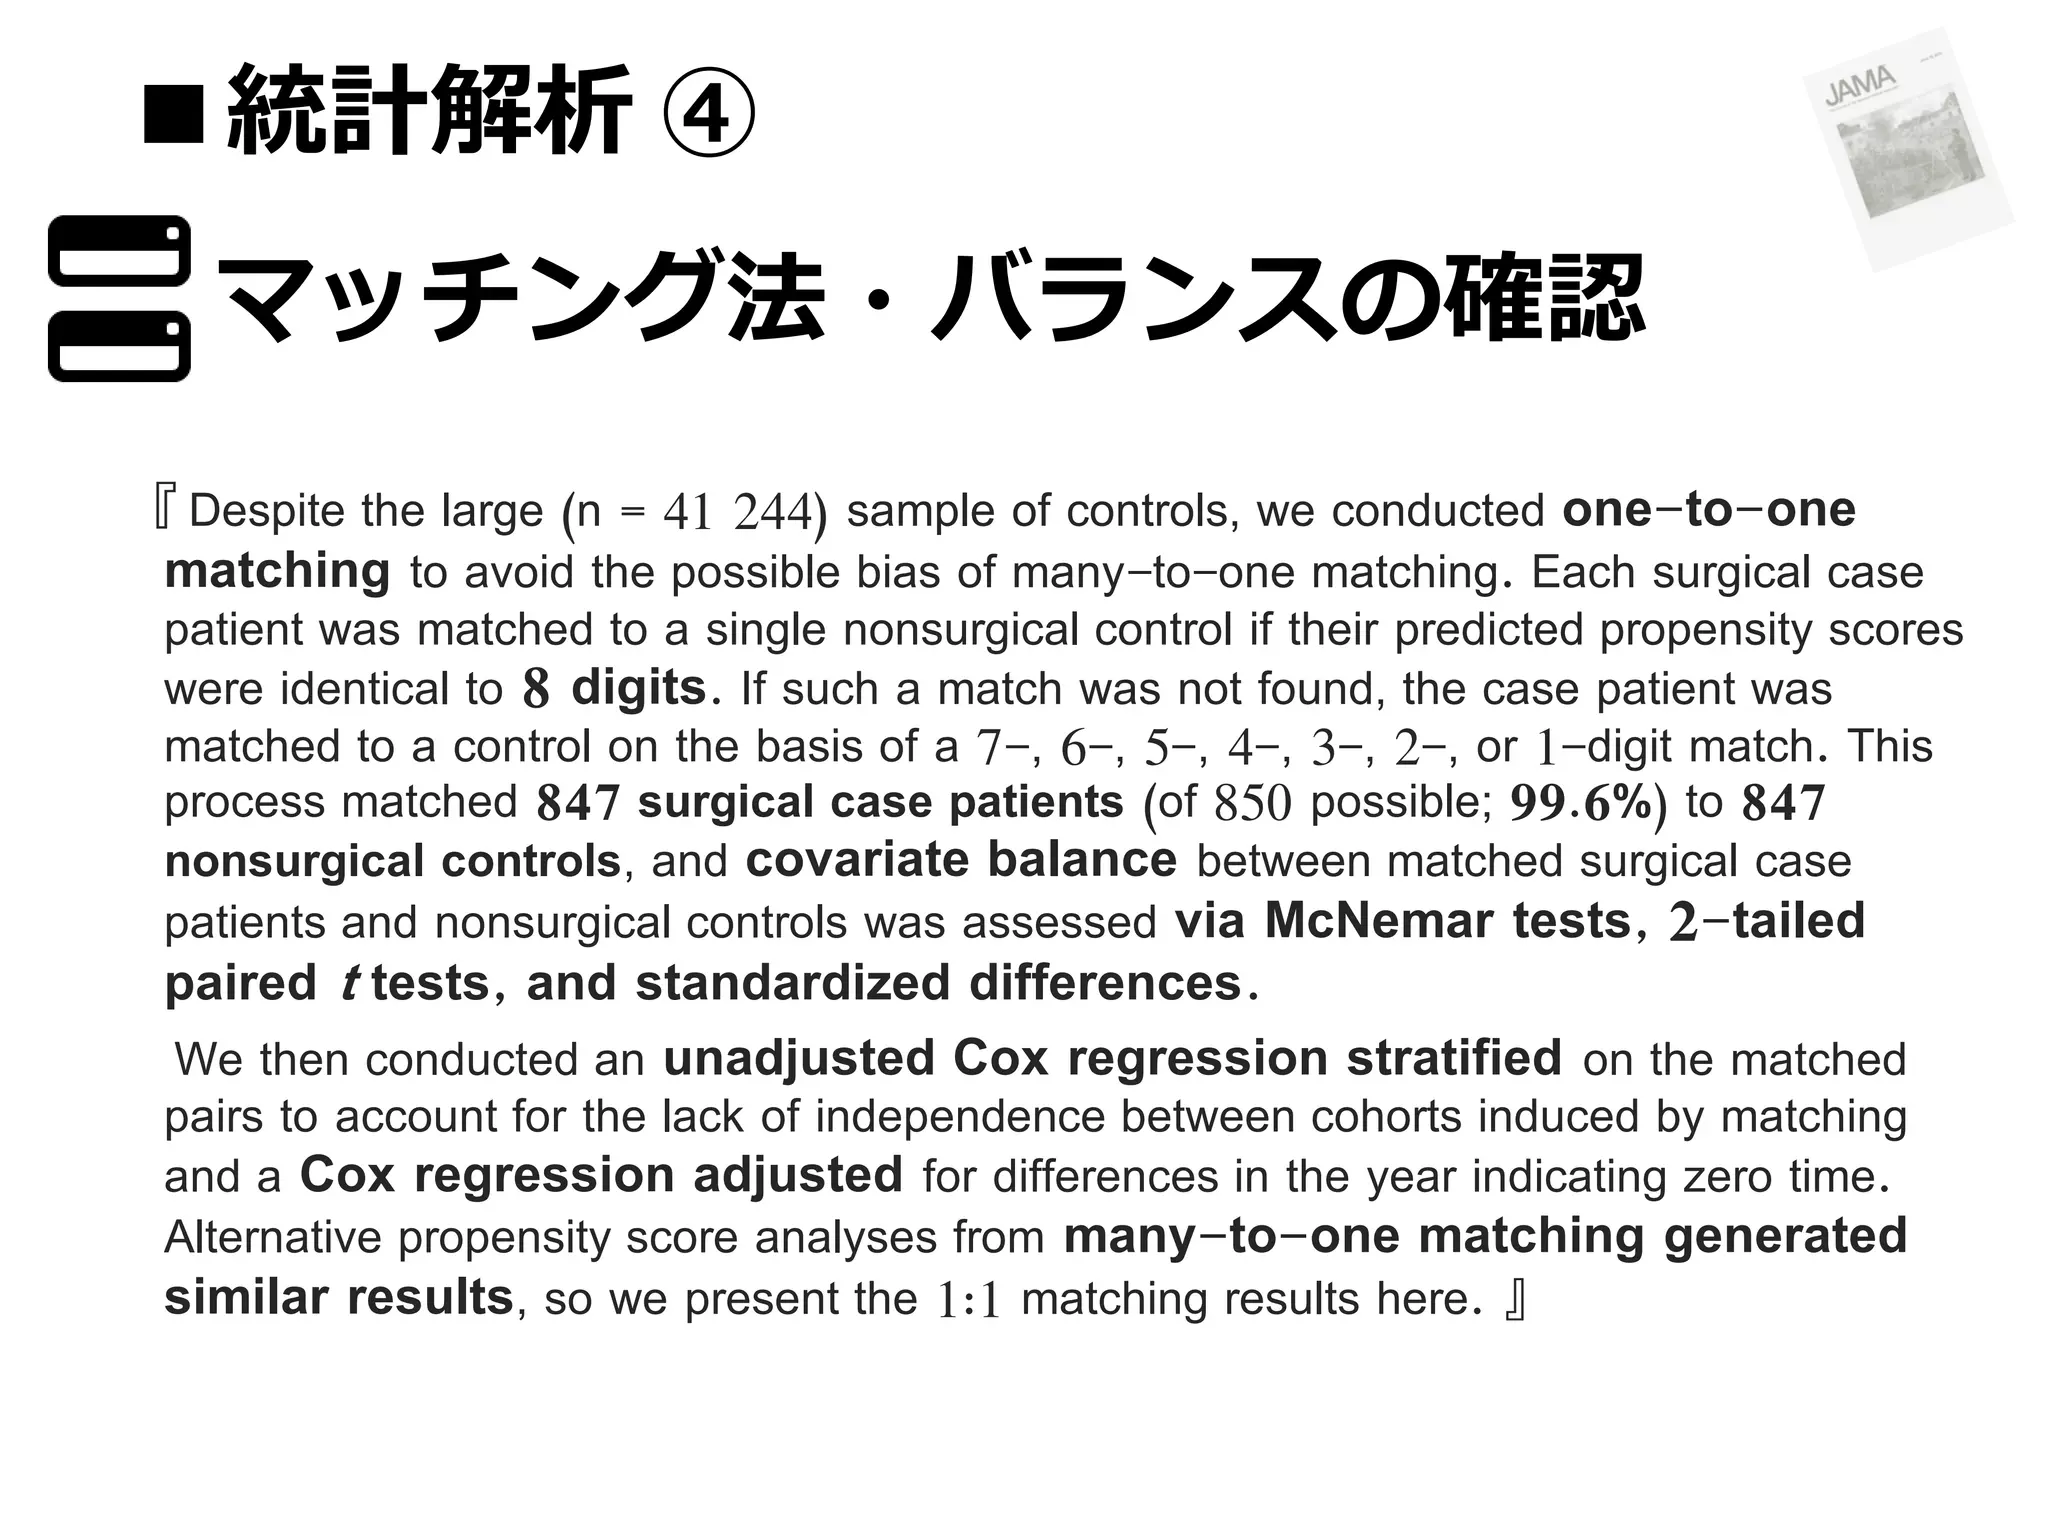
■統計解析 ④
マッチング法・バランスの確認
『 Despitethe large (n = 41 244) sample of controls, we conducted one-to-one
matching to avoid the possible bias of many-to-one matching. Each surgical case
patient was matched to a single nonsurgical control if their predicted propensity scores
were identical to 8 digits. If such a match was not found, the case patient was
matched to a control on the basis of a 7-, 6-, 5-, 4-, 3-, 2-, or 1-digit match. This
process matched 847 surgical case patients (of 850 possible; 99.6%) to 847
nonsurgical controls, and covariate balance between matched surgical case
patients and nonsurgical controls was assessed via McNemar tests, 2-tailed
paired t tests, and standardized differences.
We then conducted an unadjusted Cox regression stratified on the matched
pairs to account for the lack of independence between cohorts induced by matching
and a Cox regression adjusted for differences in the year indicating zero time.
Alternative propensity score analyses from many-to-one matching generated
similar results, so we present the 1:1 matching results here. 』
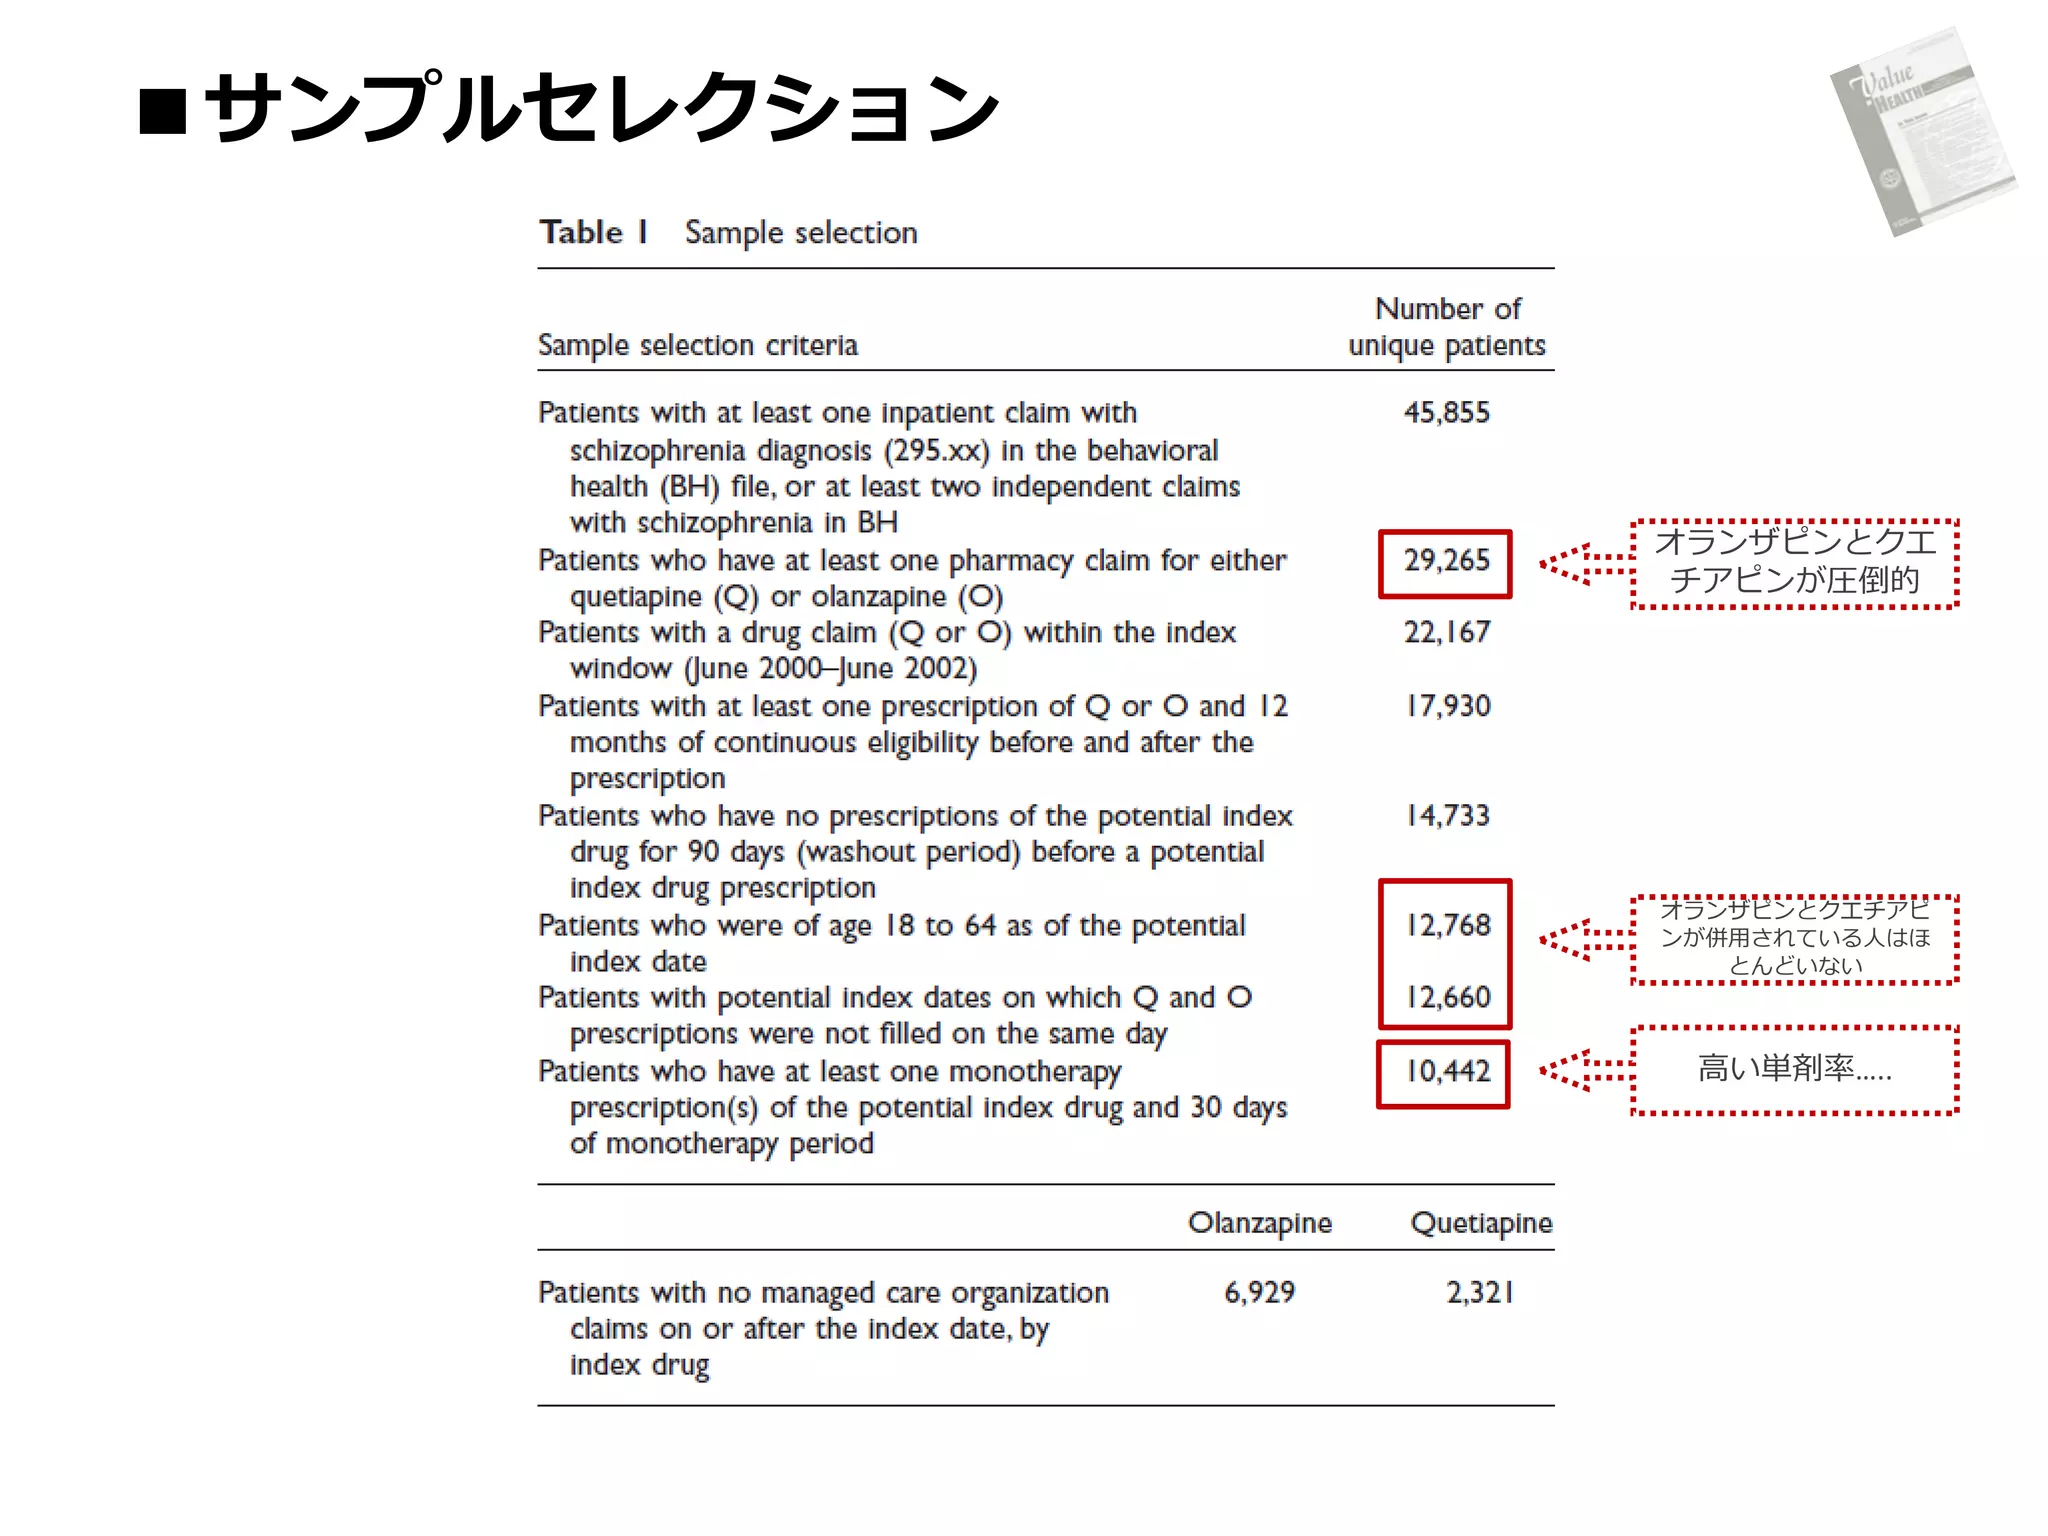
Resource Utilization andCosts of
Schizophrenia Patients Treated with
Olanzapine versus Quetiapine in a Medicaid
Population.
AP, Atanasov P, Ben‐Hamadi R, Birnbaum H, Stensland MD, Philips G. Value in Health.
2009; 12: 708–15.
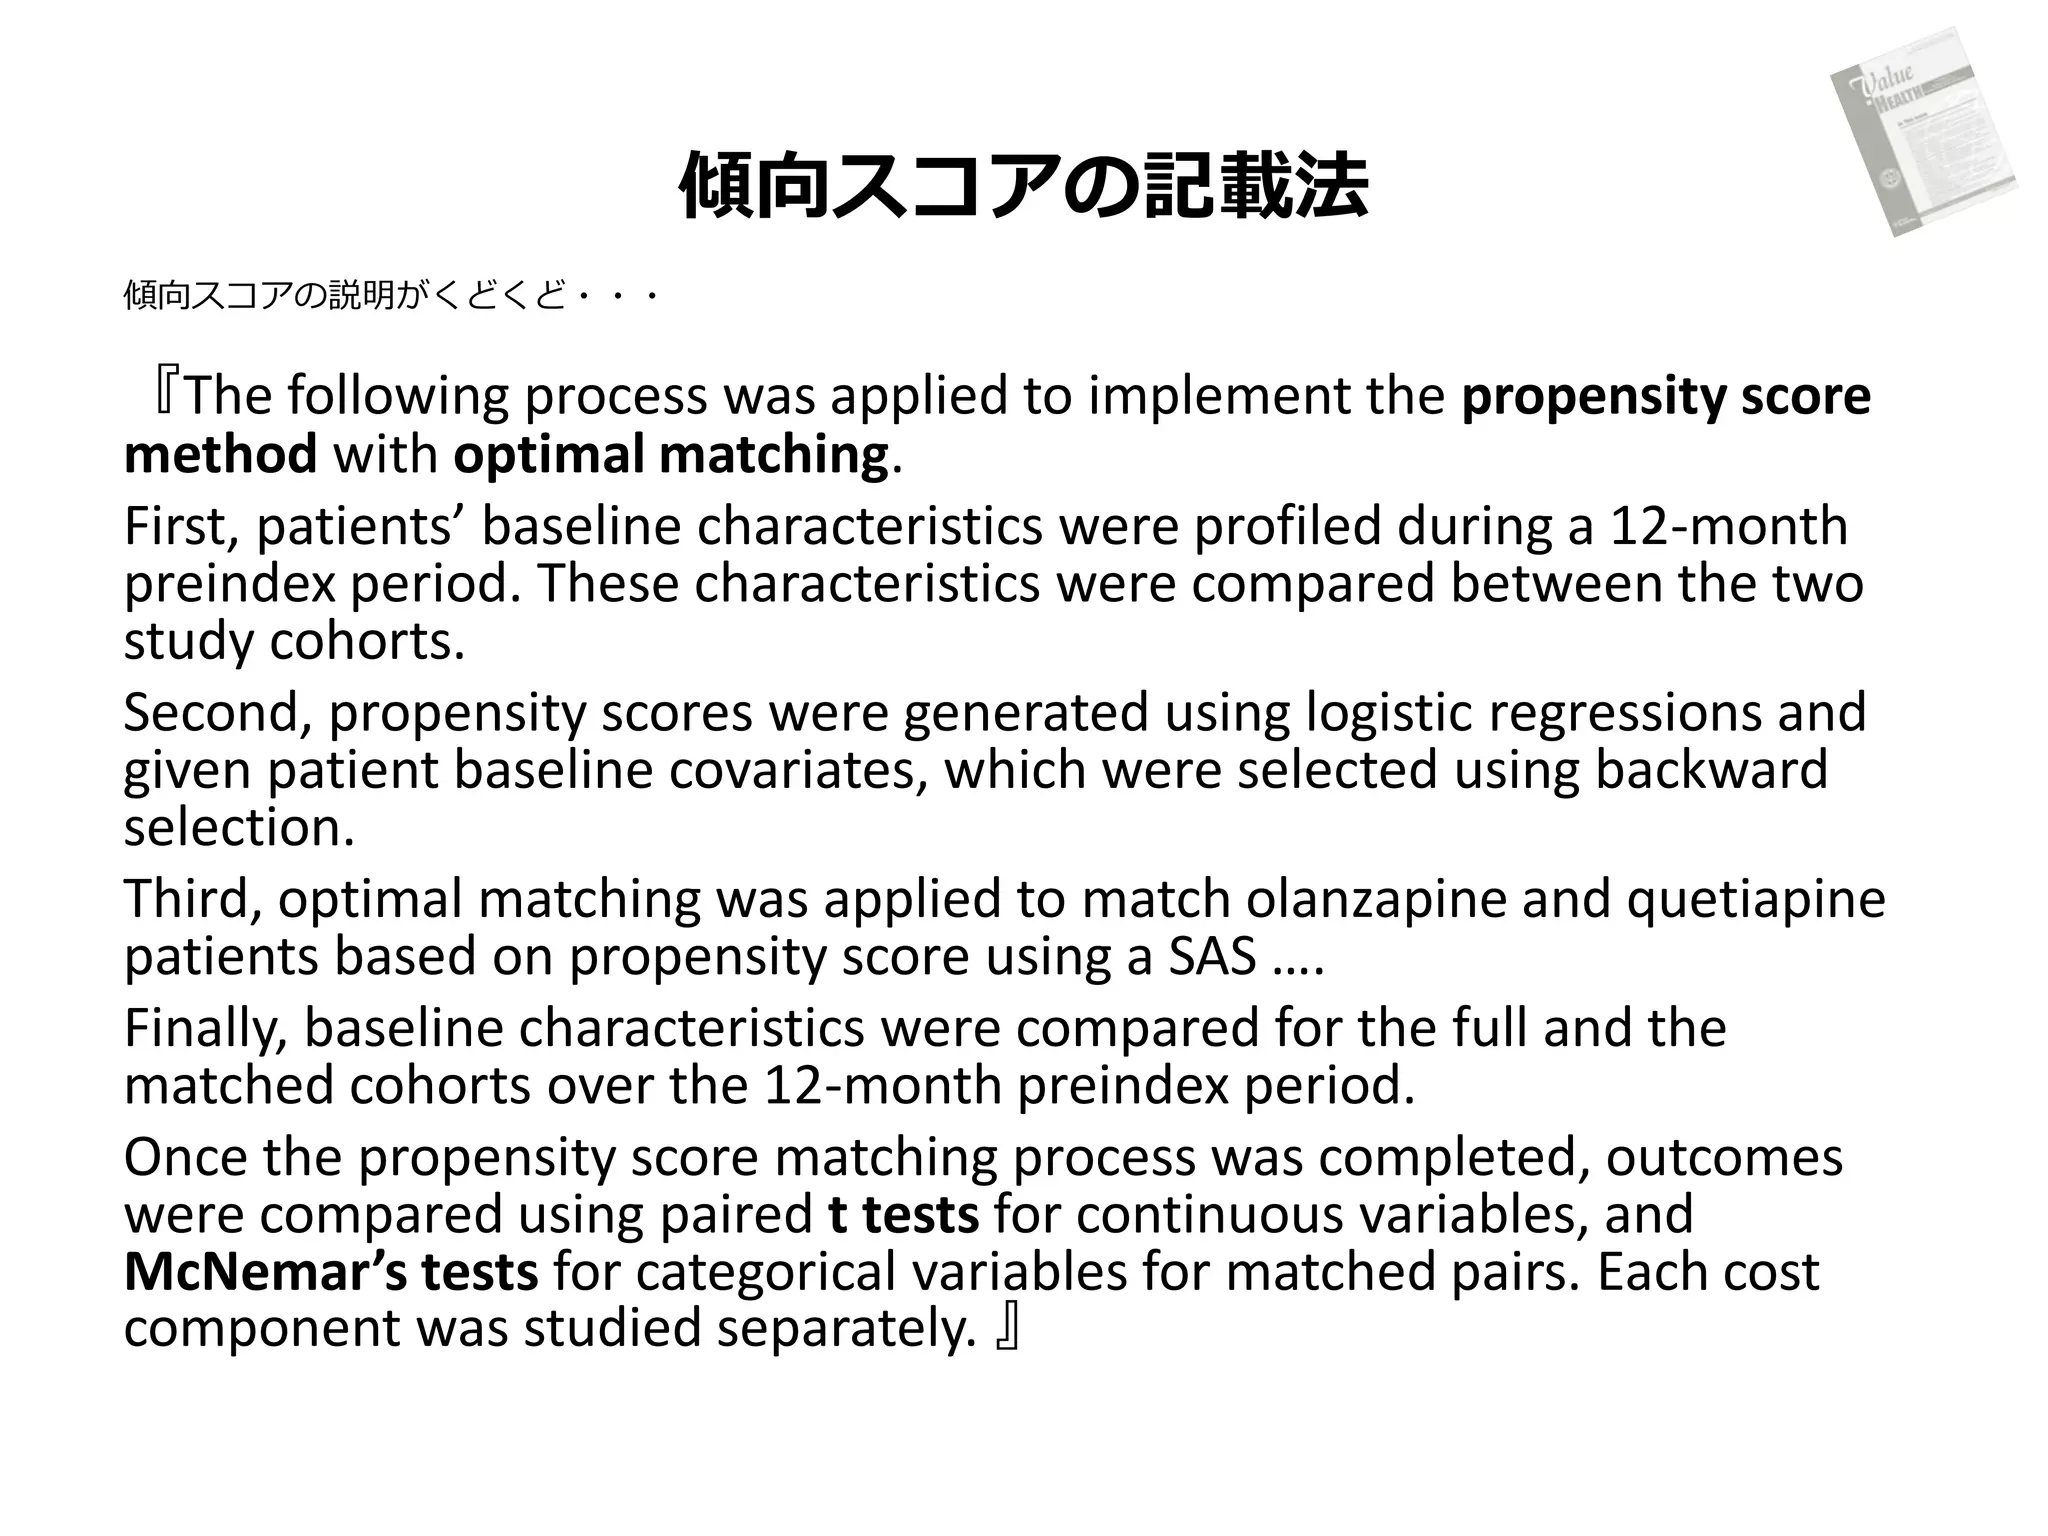
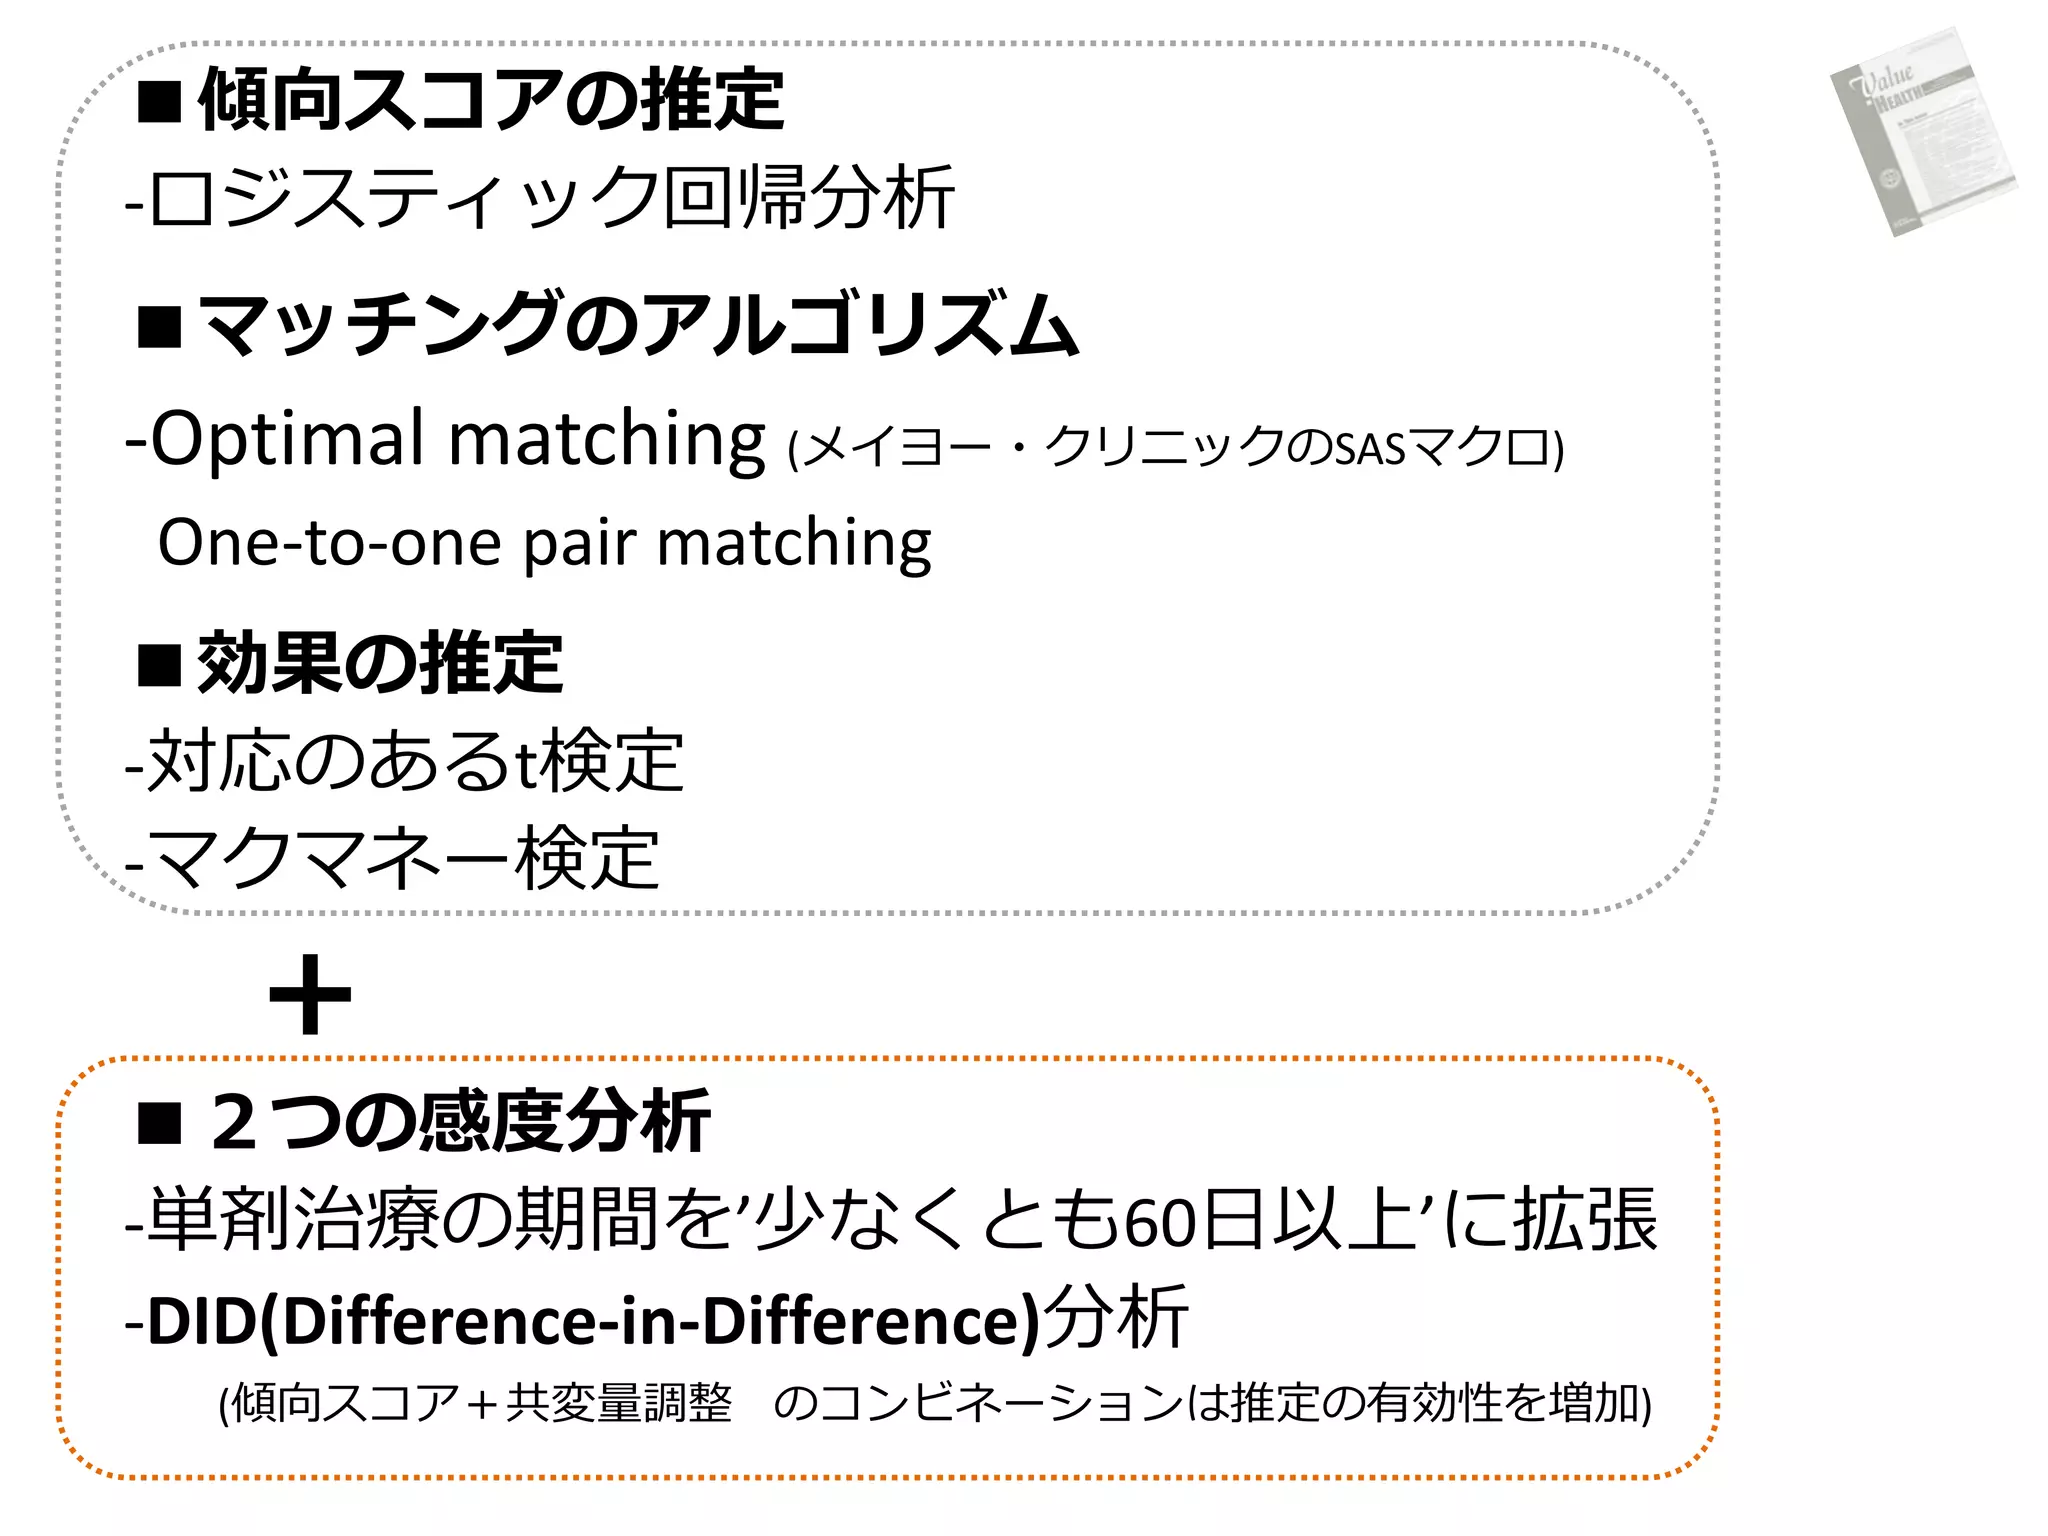
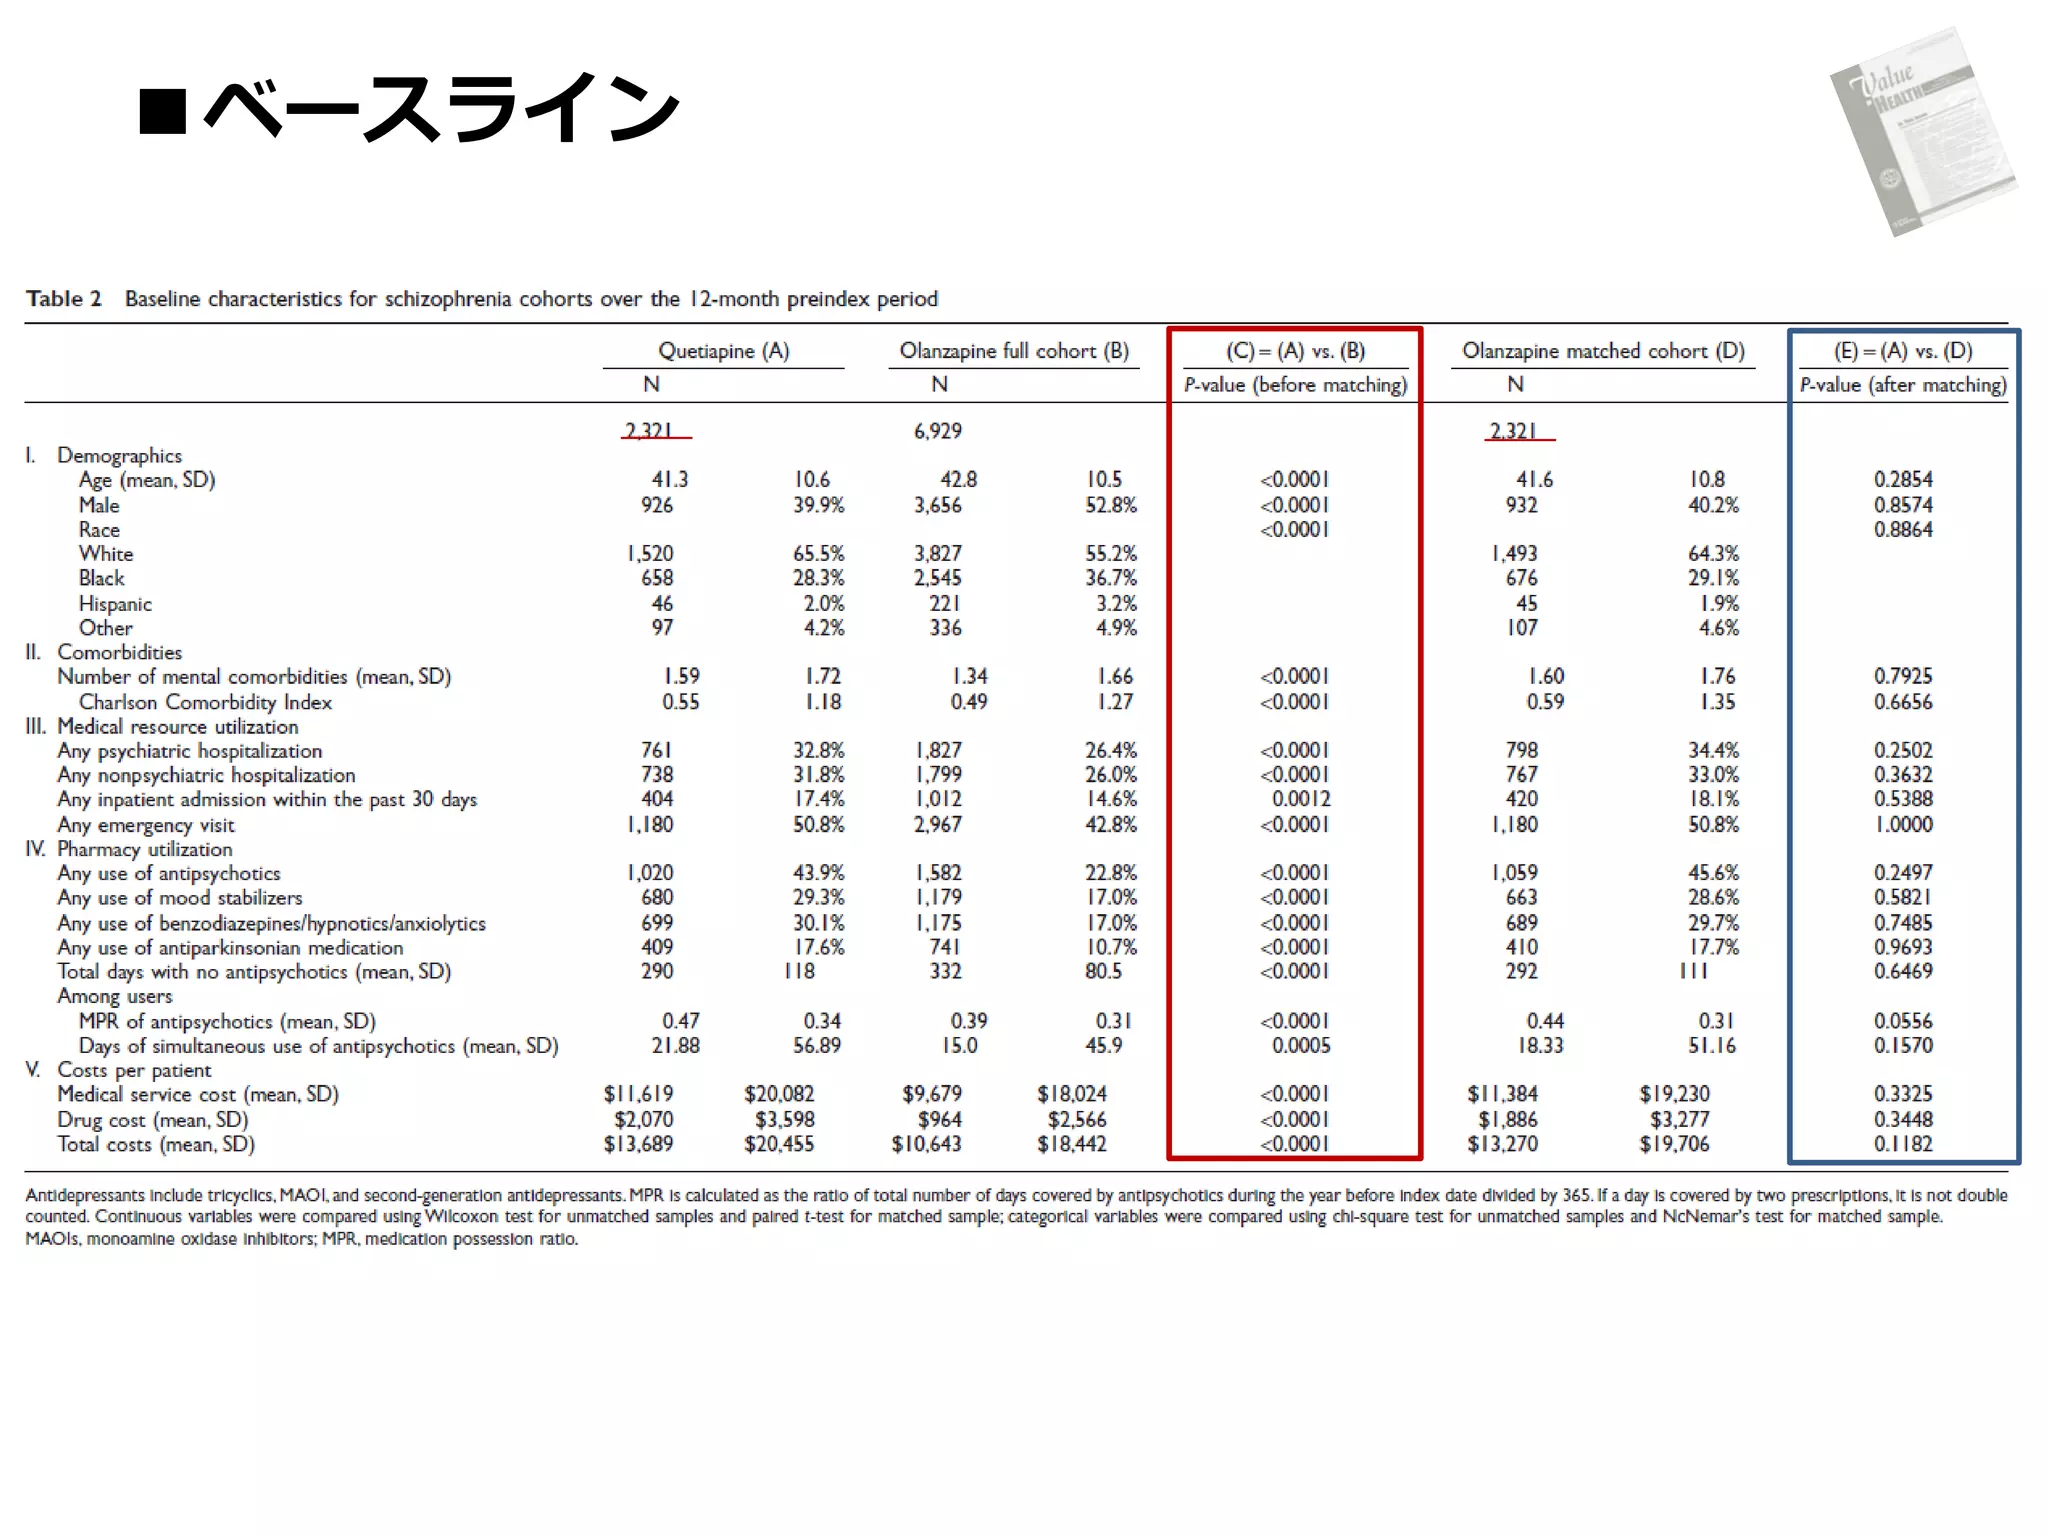
傾向スコアの記載法
傾向スコアの説明がくどくど・・・
『The following processwas applied to implement the propensity score
method with optimal matching.
First, patients’ baseline characteristics were profiled during a 12-month
preindex period. These characteristics were compared between the two
study cohorts.
Second, propensity scores were generated using logistic regressions and
given patient baseline covariates, which were selected using backward
selection.
Third, optimal matching was applied to match olanzapine and quetiapine
patients based on propensity score using a SAS ….
Finally, baseline characteristics were compared for the full and the
matched cohorts over the 12-month preindex period.
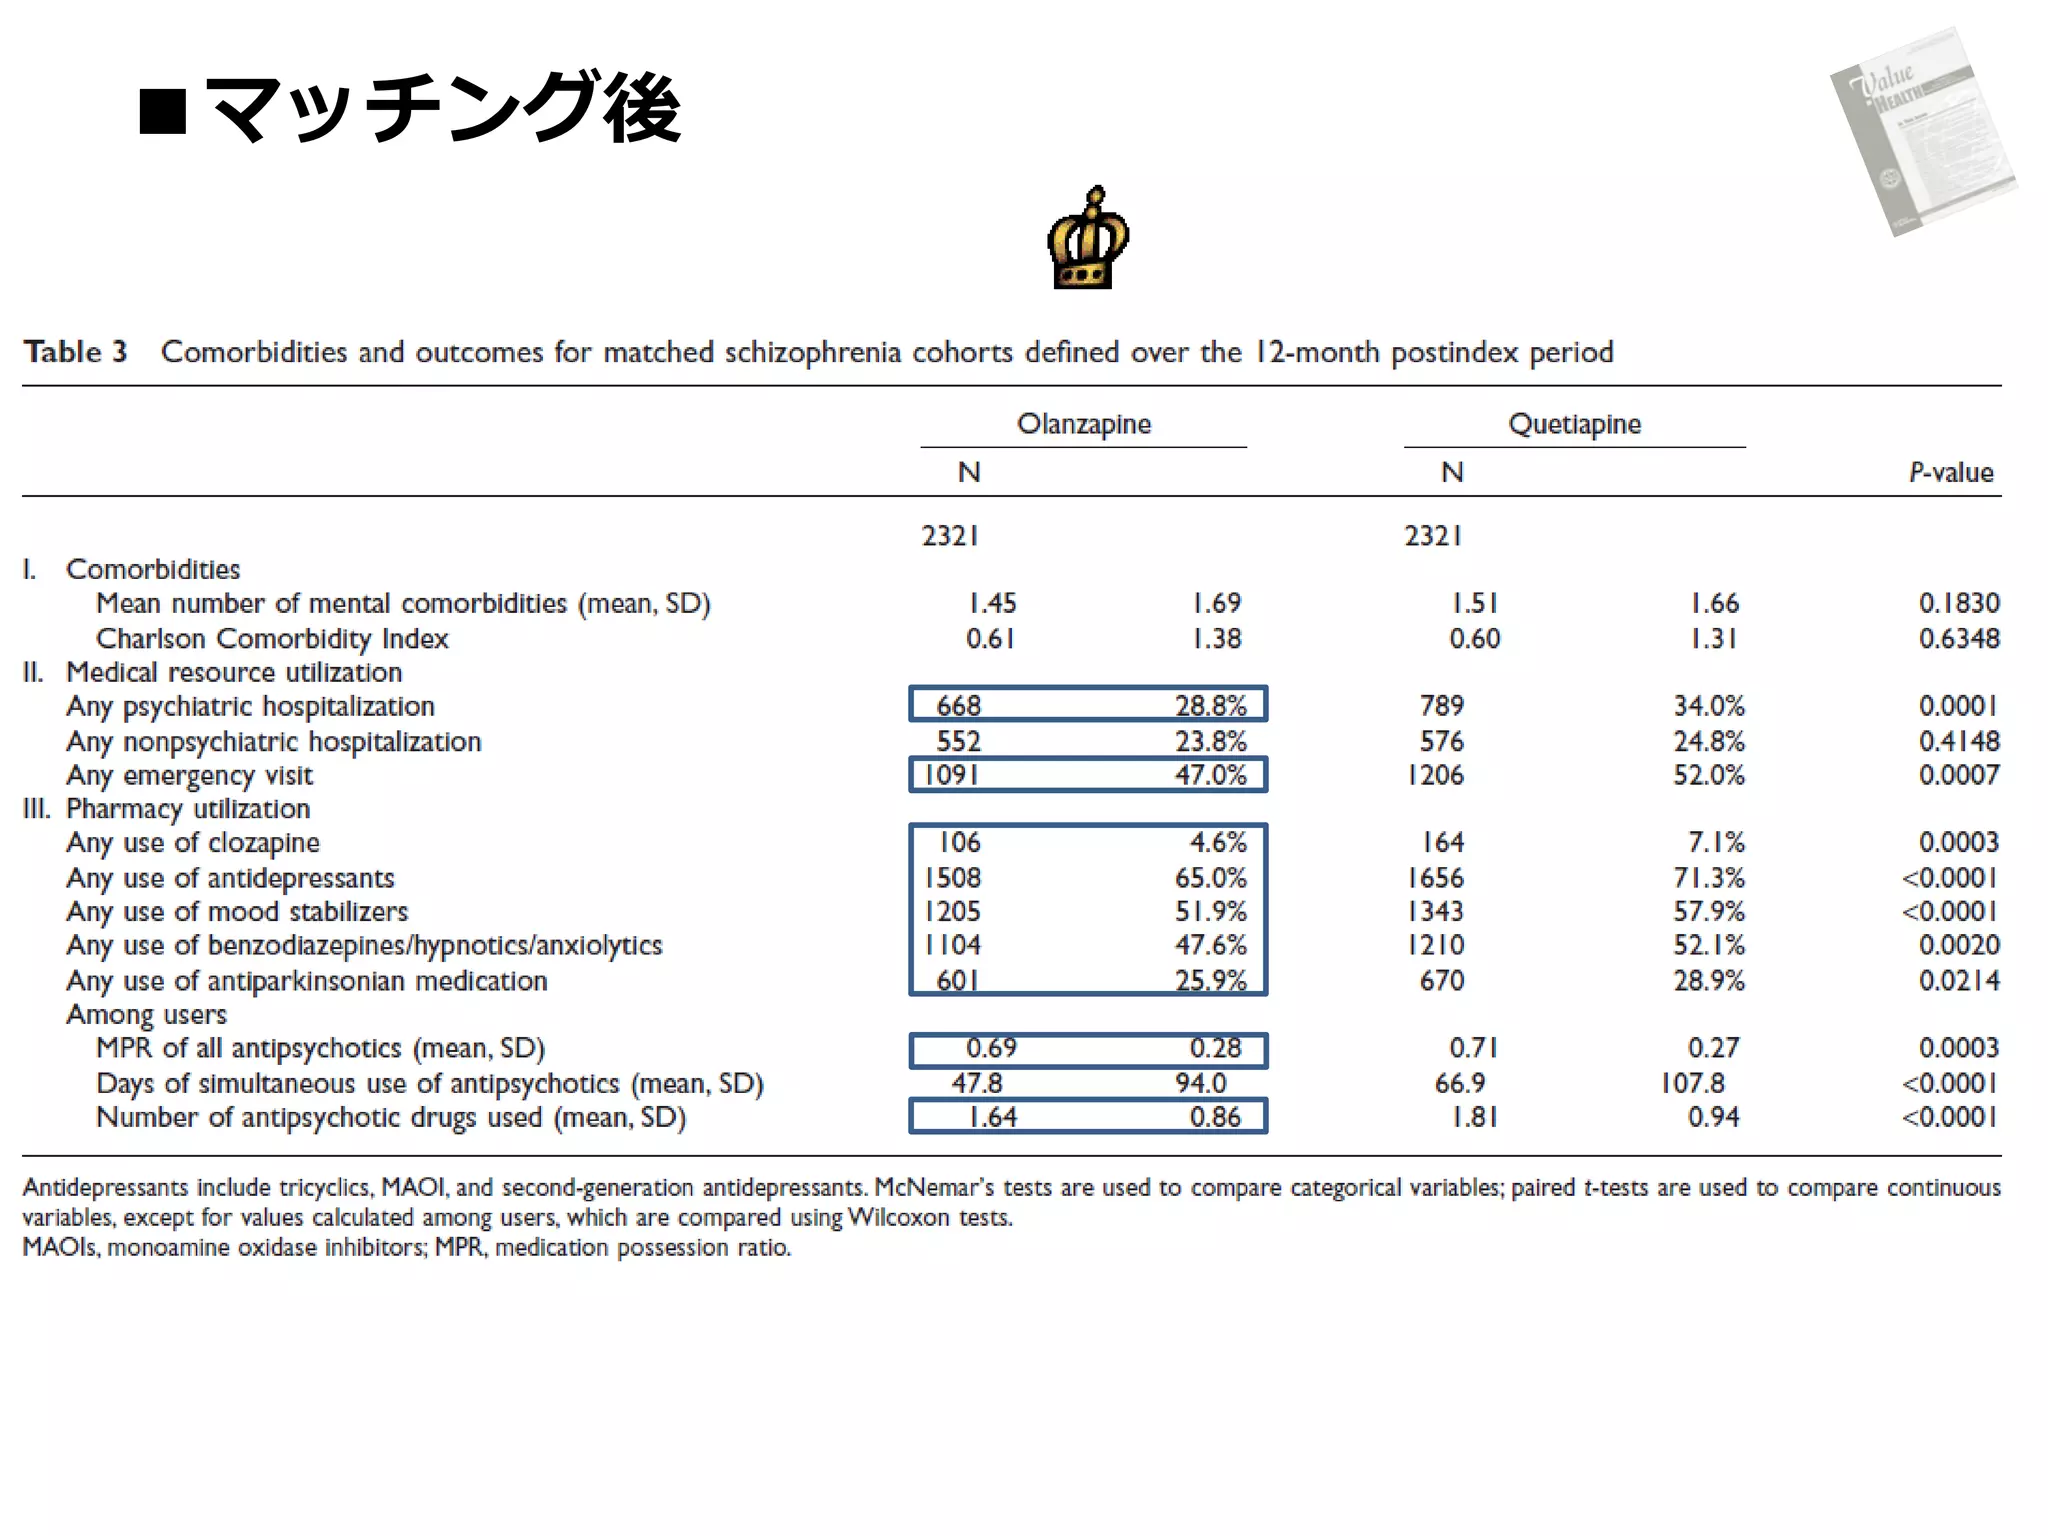
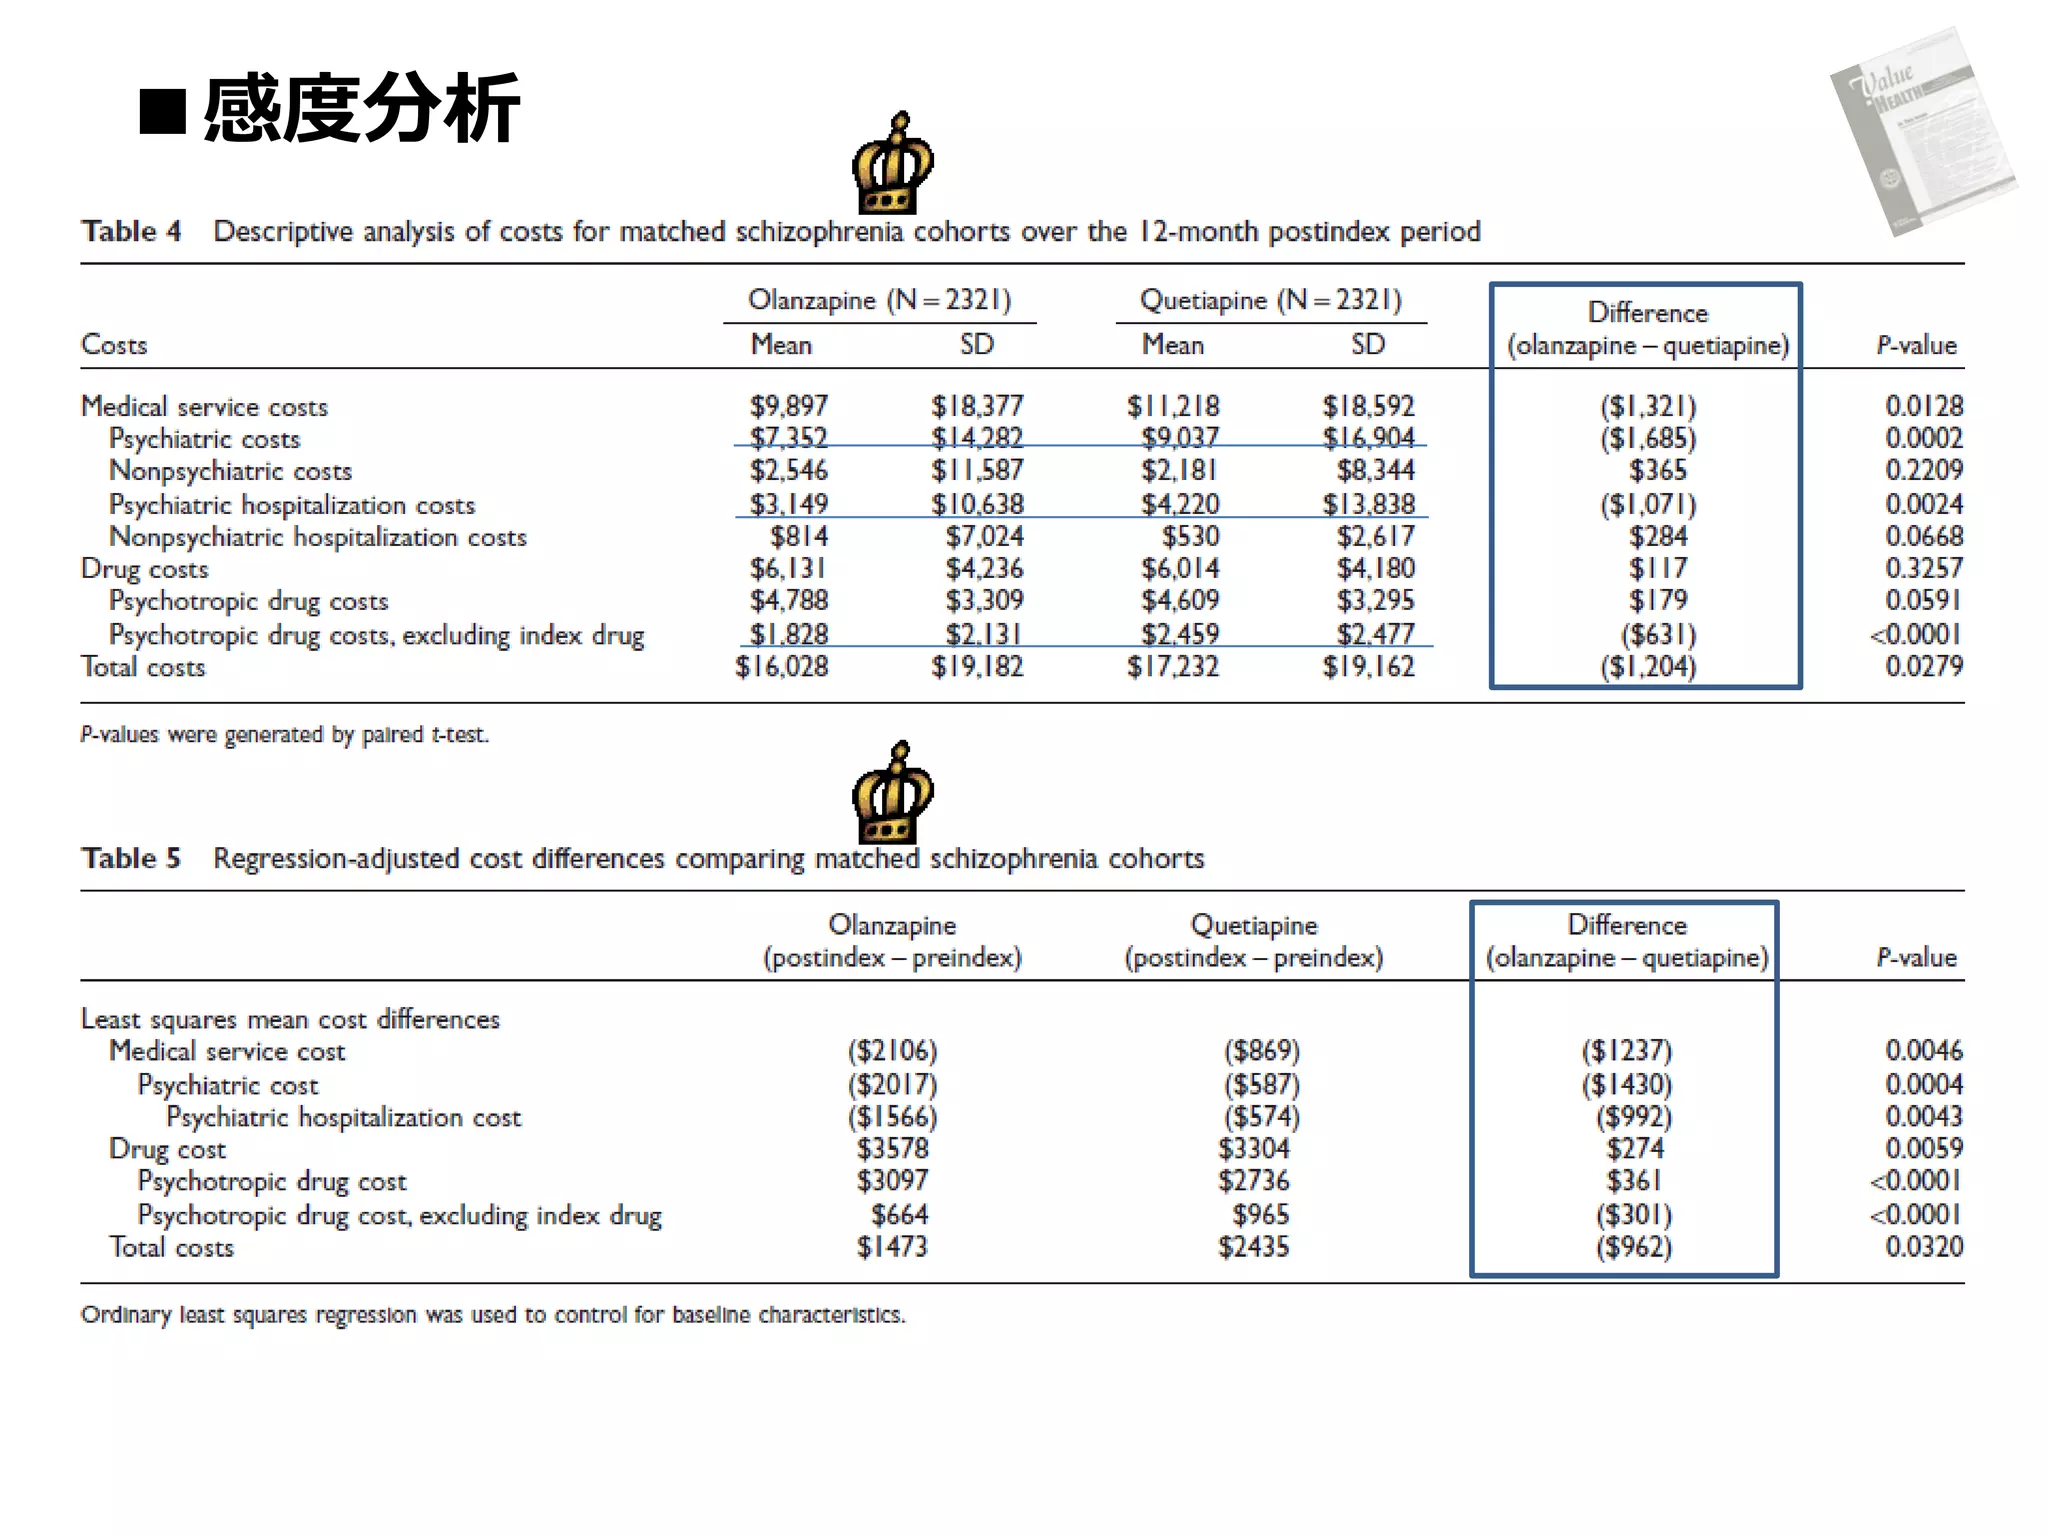
Once the propensity score matching process was completed, outcomes
were compared using paired t tests for continuous variables, and
McNemar’s tests for categorical variables for matched pairs. Each cost
component was studied separately. 』