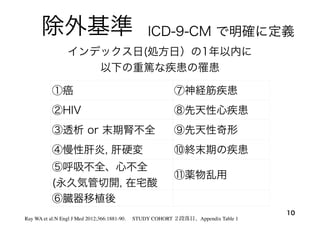
QT延長➡TdP(トルサードポワン)で突然死
5
Owens RC etal:Clin Infect Dis. 2006;43(12):1603-1611
Yang Z et al. Circ Arrhythm Electrophysiol. 2017;10:e003560.
drug con con
and Idrug
are current amplitudes in the absence and presence of azithro-
mycin, respectively. Dose–response curves were fit by the equation:
y=B1
+(B2
−B1
)/(1+10(logx0–x)*p
), where B1
is the bottom asymptote, B2
is the top asymptote, logx0 is IC50
, x is azithromycin concentration,
and p is hill slope.
ing liquid chromatography–tandem mass spectrometry as d
Statistical Analysis
Data represented using a continuous variable were summa
mean and SE for each group. For group comparisons of
Figure 1. Azithromycin-induced polymorphic ventricular tachycardia (VT) in a 24-y-old woman with no structural heart disease a
mal ECG. The arrhythmias resolved with stopping the drug.
romhttp://ahajournals.orgbyonSeptember16,2018
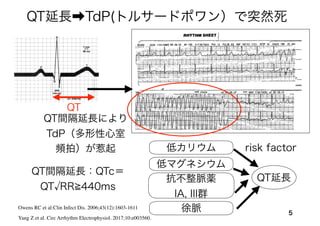
QT
QT延長
低カリウム
低マグネシウム
抗不整脈薬
IA, III群
徐脈
risk factor
QT間隔延長により
TdP(多形性心室
頻拍)が惹起
QT間隔延長:QTc=
QT RR 440ms
6.
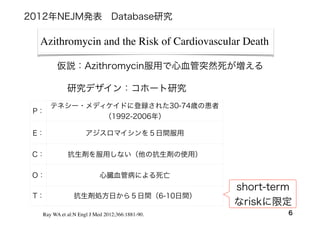
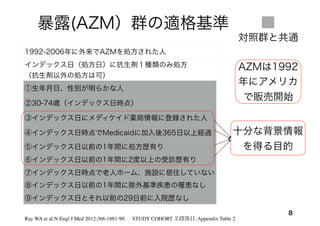
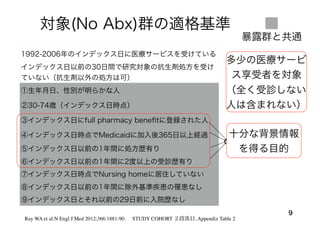
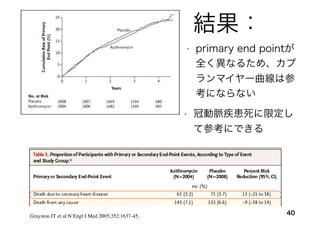
Azithromycin and theRisk of Cardiovascular Death
6
P:
テネシー・メディケイドに登録された30-74歳の患者
(1992-2006年)
E: アジスロマイシンを5日間服用
C: 抗生剤を服用しない(他の抗生剤の使用)
O: 心臓血管病による死亡
T: 抗生剤処方日から5日間(6-10日間)
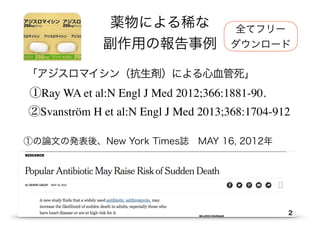
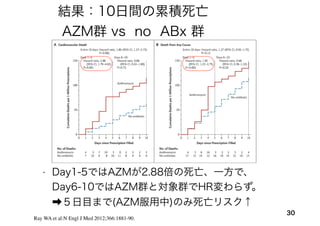
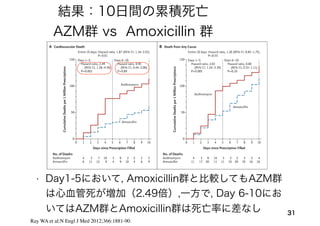
Ray WA et al:N Engl J Med 2012;366:1881-90.
2012年NEJM発表 Database研究
仮説:Azithromycin服用で心血管突然死が増える
short-term
なriskに限定
研究デザイン:コホート研究
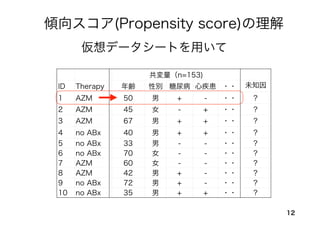
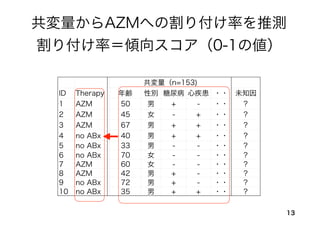
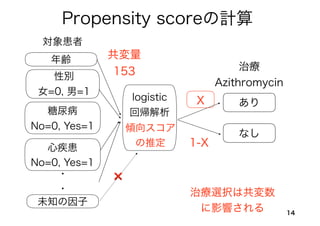
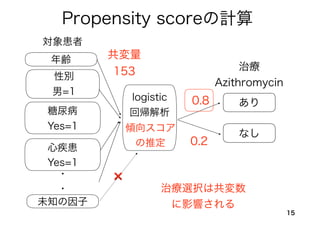
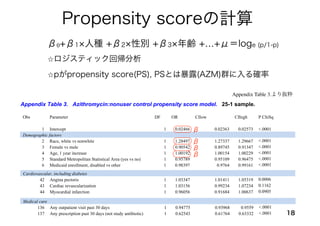
Propensity scoreの計算
18
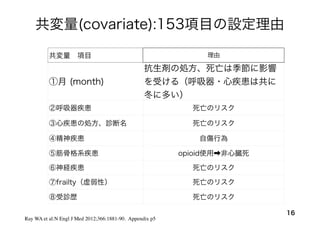
Appendix Table3.より抜粋
β0+β1 人種 +β2 性別 +β3 年齢 +…+μ=loge (p/1-p)
⭐ロジスティック回帰分析
⭐pがpropensity score(PS), PSとは暴露(AZM)群に入る確率
Appendix: Azithromycin and the Risk of Cardiovascular Death 6
Appendix Table 3. Azithromycin:nonuser control propensity score model. 25-1 sample.
Obs Parameter DF OR CIlow CIhigh P ChiSq
1 Intercept 1 0.02466 0.02363 0.02573 <.0001
Demographic factors
2 Race, white vs nonwhite 1 1.28497 1.27337 1.29667 <.0001
3 Female vs male 1 0.90542 0.89745 0.91347 <.0001
4 Age, 1 year increase 1 1.00192 1.00154 1.00229 <.0001
5 Standard Metropolitan Statistical Area (yes vs no) 1 0.95789 0.95109 0.96475 <.0001
6 Medicaid enrollment, disabled vs other 1 0.98397 0.9764 0.99161 <.0001
7 Calendar year 1992 1 0.9795 0.92322 1.03921 0.4926
8 Calendar year 1993 1 0.92582 0.88825 0.96499 0.0003
9 Calendar year 1994 1 0.84013 0.78127 0.90342 <.0001
10 Calendar year 1995 1 0.79734 0.71205 0.89284 <.0001
11 Calendar year 1996 1 0.82791 0.78477 0.87342 <.0001
12 Calendar year 1997 1 0.82992 0.79554 0.86579 <.0001
13 Calendar year 1998 1 0.81066 0.77714 0.84564 <.0001
14 Calendar year 1999 1 0.77591 0.74626 0.80674 <.0001
15 Calendar year 2000 1 0.80186 0.78022 0.8241 <.0001
Appendix: Azithromycin and the Risk of Cardiovascular Death 7
Cardiovascular, including diabetes
42 Angina pectoris 1 1.03347 1.01411 1.05319 0.0006
43 Cardiac revascularization 1 1.03156 0.99234 1.07234 0.1162
44 Myocardial infarction 1 0.96056 0.91684 1.00637 0.0905
45 Other coronary heart disease 1 1.06579 1.05022 1.0816 <.0001
46 Cardiac valve disease 1 1.00883 0.98776 1.03034 0.4145
47 Conduction disorder 1 1.00941 0.96569 1.05511 0.6783
48 Atrial fibrillation 1 1.0369 1.00292 1.07202 0.033
49 Arrhythmia 1 1.00376 0.98544 1.02243 0.6894
105 Suicide attempt 1 0.88791 0.84623 0.93164 <.0001
106 Fall 1 0.97538 0.96082 0.99017 0.0012
107 Injury ED, 1-2 visits 1 0.95417 0.94332 0.96514 <.0001
108 Injury ED, 3+ visits 1 0.93152 0.90939 0.95419 <.0001
109 Injury outpatient, 1-2 visits 1 1.03338 1.02407 1.04277 <.0001
110 Injury outpatient, 3-5 visits 1 1.02015 1.00326 1.03732 0.0192
111 Injury outpatient, 6+ visits 1 0.96453 0.93762 0.9922 0.0123
112 Morphine Rx past 12 months 1 0.88525 0.86861 0.90221 <.0001
113 Fentanyl Rx past 12 months 1 0.94324 0.92748 0.95927 <.0001
114 Meperidine Rx past 12 months 1 1.05624 1.03838 1.07441 <.0001
115 Opioids past 30 days, 1-15 days 1 0.87111 0.86132 0.881 <.0001
116 Opioids past 30 days, 16-30 days 1 1.00571 0.99095 1.02068 0.4505
117 Opioids past 30 days, 31+ days 1 0.97706 0.9599 0.99453 0.0103
118 Opioids past year, 1-60 days 1 1.14436 1.1306 1.15829 <.0001
119 Opioids past year, 61-499 days 1 1.14479 1.12544 1.16447 <.0001
120 Opioids past year, 500+ days 1 1.1576 1.12422 1.19197 <.0001
121 Opioid refill, early 1 1.08083 1.0611 1.10093 <.0001
122 Disease modifying anti-rheumatic drug 1 0.95196 0.92998 0.97446 <.0001
123 Systemic corticosteroid 1 1.12743 1.10398 1.15138 <.0001
Neurologic
124 Seizure disorder 1 0.89905 0.87925 0.9193 <.0001
125 Dementia 1 0.91069 0.88036 0.94205 <.0001
126 Anticonvulsant 1 0.99935 0.98071 1.01835 0.9464
127 Parkinsons medication 1 0.91569 0.89485 0.93702 <.0001
Frailty
128 Decubitus ulcer 1 0.93937 0.88265 0.99973 0.049
129 Amputation 1 0.90509 0.82272 0.99571 0.0405
130 Delirium 1 0.8697 0.82851 0.91293 <.0001
131 Incontinence, urine 1 1.01858 0.99701 1.04062 0.0918
132 Incontinence, fecal 1 0.99218 0.91288 1.07838 0.8535
133 Indwelling urinary catheter 1 0.92295 0.84696 1.00576 0.0674
134 Feeding/nutrition problem 1 0.90354 0.83487 0.97786 0.0119
135 Wheelchair or walker 1 0.97218 0.94924 0.99568 0.0206
Medical care
136 Any outpatient visit past 30 days 1 0.94775 0.93968 0.9559 <.0001
137 Any prescription past 30 days (not study antibiotic) 1 0.62543 0.61764 0.63332 <.0001
138 CV inpatient visit 91-365 days before t0 1 1.02644 1.00662 1.04665 0.0087
β
β
β
β
19.
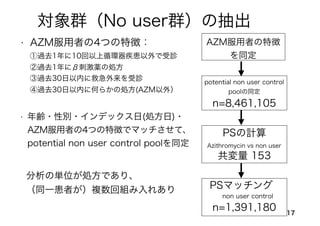
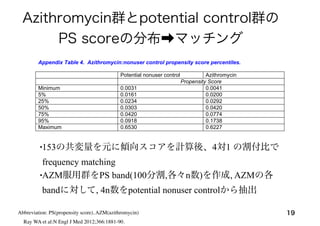
Azithromycin群とpotential control群の
PS scoreの分布➡マッチング
•153の共変量を元に傾向スコアを計算後、4対1の割付比で
frequency matching
•AZM服用群をPS band(100分割,各々n数)を作成, AZMの各
bandに対して, 4n数をpotential nonuser controlから抽出
19
Appendix: Azithromycin and the Risk of Cardiovascular Death 10
Important percentiles for the azithromycin:nonuser control propensity score are shown in Appendix
Table 4.
Appendix Table 4. Azithromycin:nonuser control propensity score percentiles.
Potential nonuser control Azithromycin
Propensity Score
Minimum 0.0031 0.0041
5% 0.0161 0.0200
25% 0.0234 0.0292
50% 0.0303 0.0420
75% 0.0420 0.0774
95% 0.0918 0.1738
Maximum 0.6530 0.6227
For each azithromycin prescription, four nonuser control periods were selected from the potential
control pool, frequency-matched according to propensity score. The first step was to create propensity score
bands: we identified 100 1-percentile intervals, each with an approximately equal number of azithromycin
prescriptions. From each of these bands, 4n control periods were randomly selected, where n was the number
of azithromycin prescriptions within the band. For this reason, the nonuser control periods are not individually
matched on either the propensity score or any of the study variables. Because the very highest band (99th
percentile) did not contain sufficient controls, the successive lower bands were oversampled to make up the
deficiency.
A key test of propensity score matching is whether or not the distribution of the covariates is balanced.
The manuscript Table 1 shows virtually complete balance with regard to study covariates.
Study Followup and Person-TimeAbbreviation: PS(propensity score), AZM(azithromycin)
Ray WA et al:N Engl J Med 2012;366:1881-90.
20.
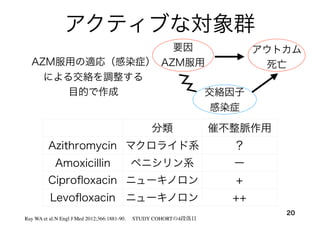
アクティブな対象群
20
Ray WA etal:N Engl J Med 2012;366:1881-90. STUDY COHORTの4段落目
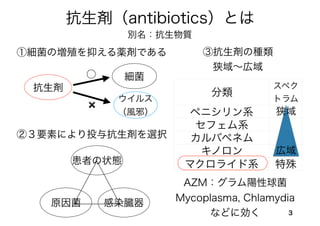
分類 催不整脈作用
Azithromycin マクロライド系 ?
Amoxicillin ペニシリン系 ー
Ciprofloxacin ニューキノロン +
Levofloxacin ニューキノロン ++
AZM服用の適応(感染症)
による交絡を調整する
目的で作成
要因
AZM服用
アウトカム
死亡
交絡因子
感染症
21.
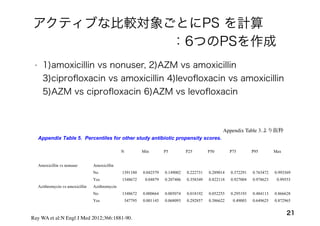
アクティブな比較対象ごとにPS を計算
• 1)amoxicillinvs nonuser, 2)AZM vs amoxicillin
3)ciprofloxacin vs amoxicillin 4)levofloxacin vs amoxicillin
5)AZM vs ciprofloxacin 6)AZM vs levofloxacin
Appendix: Azithromycin and the Risk of Cardiovascular Death 13
Appendix Table 5. Percentiles for other study antibiotic propensity scores.
N Min P5 P25 P50 P75 P95 Max
Amoxicillin vs nonuser Amoxicillin
No 1391180 0.042579 0.149002 0.222731 0.289014 0.372291 0.763472 0.993369
Yes 1348672 0.04879 0.207406 0.358349 0.822118 0.927004 0.978623 0.99553
Azithromycin vs amoxicillin Azithromycin
No 1348672 0.000664 0.005074 0.018192 0.052255 0.295193 0.484113 0.866628
Yes 347795 0.001145 0.068093 0.292857 0.386622 0.49003 0.649625 0.872965
Ciprofloxacin vs amoxicillin Ciprofloxacin
No 1348672 0.002086 0.008307 0.022776 0.073864 0.177116 0.36137 0.984417
Yes 264626 0.003003 0.05582 0.175478 0.294214 0.650018 0.843497 0.982692
Appendix Table 3.より抜粋
21
Ray WA et al:N Engl J Med 2012;366:1881-90.
:6つのPSを作成
22.
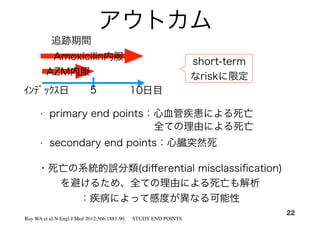
アウトカム
22
• primary endpoints:心血管疾患による死亡
インデックス日 5 10日目
AZM内服
追跡期間
Amoxicilin内服
Ray WA et al:N Engl J Med 2012;366:1881-90. STUDY END POINTS
・死亡の系統的誤分類(differential misclassification)
を避けるため、全ての理由による死亡も解析
:疾病によって感度が異なる可能性
• secondary end points:心臓突然死
short-term
なriskに限定
全ての理由による死亡
23.
23Chung CP, RayWA et al. pharmacoepidemiology and drug safety 2010; 19: 563–572
thetic) generally not performed on patients in cardiac
arrest.
Validation sample. The validation study cohort had
1870 deaths that met the computer case definition for
sudden cardiac death (Figure 1). To avoid overlap with
the development sample, the validation sample was
restricted to deaths that occurred between 1994 and
2005. To reduce the time and expense of record
retrieval, the sample was further restricted to 316
deaths in counties within a 100 mile radius of Nash-
ville. Of these, records were not sought for 74 (23.4%)
because they had no institutional (hospital, emergency
department, or hospital-based clinic) or emergency
medical services encounters in the year preceding
death. Our past experience suggested that absent these
types of encounters, information on the circumstances
of death would be insufficient to permit adjudication.
Medical records were sought for the remaining 242
deaths; access was refused for 5 (2.0%) and the records
had inadequate documentation for 63 (26.0%). This
left 174 deaths for which medical records (redacted to
remove personal identifiers and medication history)
were adjudicated (Figure 1) by both a study physician
and a cardiac electrophysiologist.
Figure 2. Computer case definition for sudden cardiac death
Copyright # 2009 John Wiley & Sons, Ltd. Pharmacoepidemiology and Drug Safety, 2010; 19: 563–572
DOI: 10.1002/pds
computer case definition for sudden cardiac death 567
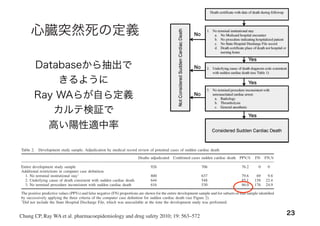
心臓突然死の定義
RESULTS
Development sample
The 926 adjudicated deaths in the development sample
were the basis for constructing the computer case
definition for sudden cardiac death. Of these deaths,
706 were classified as cases of sudden cardiac death
(49% probable, 51% possible), a positive predictive
value of 76.2% (Table 2).
We assessed the effect of the successive application
of each of the three criteria in the computer case
definition intended to reduce misclassification by
restricting deaths to those more likely to represent
true sudden cardiac deaths (Figure 2). Restriction to
deaths with no evidence of a terminal institutional
stay (Figure 2, criterion 1, 800 deaths) increased the
positive predictive value to 79.6% (Table 2). Restric-
tion to those with an underlying cause of death
diagnosis code more compatible with sudden cardiac
death (Table 1 and Figure 2, criterion 2, 644 deaths)
increased the positive predictive value to 85.1%.
Finally, excluding those deaths where terminal medical
care was inconsistent with cardiac arrest (Figure 2,
criterion 3, 616 deaths) increased the positive
predictive value to 86.0%. These further restrictions
led to misclassification of 176 deaths adjudicated as
sudden cardiac deaths, a false negative proportion of
24.9%.
We assessed the performance of the individual cause
of death codes used to identify the deaths in the
development sample (Table 3). This assessment
utilized the 800 cases in the development sample
with no evidence of a terminal hospitalization and
included both codes ultimately used and not used for
the computer case definition. For the codes used in
the computer case definition, the most frequently
recorded were myocardial infarction (285 deaths,
positive predictive value of 82.1%) and cardiovascular
NOS denotes ‘not otherwise specified’.
Table 2. Development study sample. Adjudication by medical record review of potential cases of sudden cardiac death
Deaths adjudicated Confirmed cases sudden cardiac death PPV,% FN FN,%
Entire development study sample 926 706 76.2 0 0
Additional restrictions in computer case definition
1. No terminal institutional stayÃ
800 637 79.6 69 9.8
2. Underlying cause of death consistent with sudden cardiac death 644 548 85.1 158 22.4
3. No terminal procedure inconsistent with sudden cardiac death 616 530 86.0 176 24.9
The positive predictive values (PPVs) and false negative (FN) proportions are shown for the entire development sample and for subsets of that sample identified
by successively applying the three criteria of the computer case definition for sudden cardiac death (see Figure 2).
Ã
Did not include the State Hospital Discharge File, which was unavailable at the time the development study was performed.
Copyright # 2009 John Wiley & Sons, Ltd. Pharmacoepidemiology and Drug Safety, 2010; 19: 563–572
DOI: 10.1002/pds
Databaseから抽出で
きるように
Ray WAらが自ら定義
カルテ検証で
高い陽性適中率
24.
24
The new england jour nal of medicine
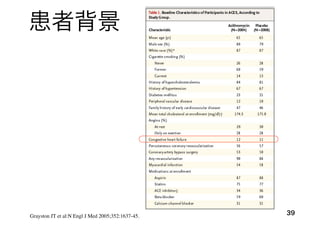
Table 1. Demographic and Clinical Characteristics of Patients at the Time That the Prescriptions for the Study Antibiotics Were Filled
and at the Beginning of the Control Period for Persons Who Received No Antibiotic Treatment.*
Characteristic No Antibiotic Amoxicillin† Ciprofloxacin Levofloxacin Azithromycin
Prescriptions (no.) 1,391,180 1,348,672 264,626 193,906 347,795
Mean age (yr) 48.6 47.7 50.5 51.5 48.6
Female sex (%) 77.5 73.3 75.5 73.5 77.5
Current or past use of medications (%)
Angiotensin-converting–enzyme inhibitor 28.1 24.0 28.4 32.8 28.1
Beta-blocker 21.6 17.3 20.9 24.8 21.5
Calcium-channel blocker 20.2 19.9 22.8 24.3 20.2
Digoxin 2.5 3.5 3.8 3.6 2.5
Loop diuretic 17.3 15.1 20.1 23.8 17.2
Other diuretic 25.9 22.4 26.3 28.9 25.9
Statin 28.1 17.9 25.2 34.5 28.0
Insulin 6.5 6.9 10.2 10.2 6.5
Oral hypoglycemic agent 16.5 13.1 18.9 21.9 16.5
Beta-agonist 40.5 28.1 28.6 43.5 40.3
Glucocorticoid 3.3 2.8 3.8 4.8 3.3
Coexisting conditions (%)
Heart failure 4.3 3.9 5.3 6.8 4.3
Chronic obstructive pulmonary disease 5.5 4.6 5.1 6.8 5.4
Complications of diabetes‡ 7.4 6.5 11.3 11.7 7.5
Incontinence of urine or feces 2.9 2.1 4.6 4.3 2.9
Use of wheelchair or walker 2.3 1.6 3.2 3.8 2.3
Hospitalization for cardiovascular condition (%) 7.2 6.0 8.5 9.5 7.2
Hospitalization for other condition (%) 15.7 14.8 19.1 20.4 15.8
Visit to emergency department in the past 30 days (%) 13.9 11.3 15.6 18.0 13.9
Use of any antibiotic in the past 30 days (%) 27.9 28.4 38.6 40.3 27.0§
Mean summary score for risk of cardiovascular disease¶ 9.2 9.5 10.3 10.6 9.3
* Medications, diagnoses, and medical care encounters were for the 365 days before the time the prescription was filled, unless otherwise
specified. Control periods with no antibiotic treatment were propensity-score–matched with the azithromycin prescriptions. P<0.01 for com-
parison of baseline characteristics between the amoxicillin, ciprofloxacin, and levofloxacin groups and the group of persons who did not use
The new engl and journal of medicine
Clinical Characteristics of Patients at the Time That the Prescriptions for the Study Antibiotics Were Filled
e Control Period for Persons Who Received No Antibiotic Treatment.*
No Antibiotic Amoxicillin† Ciprofloxacin Levofloxacin Azithromycin
1,391,180 1,348,672 264,626 193,906 347,795
48.6 47.7 50.5 51.5 48.6
77.5 73.3 75.5 73.5 77.5
dications (%)
g–enzyme inhibitor 28.1 24.0 28.4 32.8 28.1
21.6 17.3 20.9 24.8 21.5
ker 20.2 19.9 22.8 24.3 20.2
2.5 3.5 3.8 3.6 2.5
17.3 15.1 20.1 23.8 17.2
25.9 22.4 26.3 28.9 25.9
28.1 17.9 25.2 34.5 28.0
6.5 6.9 10.2 10.2 6.5
nt 16.5 13.1 18.9 21.9 16.5
40.5 28.1 28.6 43.5 40.3
3.3 2.8 3.8 4.8 3.3
4.3 3.9 5.3 6.8 4.3
ulmonary disease 5.5 4.6 5.1 6.8 5.4
etes‡ 7.4 6.5 11.3 11.7 7.5
or feces 2.9 2.1 4.6 4.3 2.9
alker 2.3 1.6 3.2 3.8 2.3
vascular condition (%) 7.2 6.0 8.5 9.5 7.2
condition (%) 15.7 14.8 19.1 20.4 15.8
ment in the past 30 days (%) 13.9 11.3 15.6 18.0 13.9
e past 30 days (%) 27.9 28.4 38.6 40.3 27.0§
risk of cardiovascular disease¶ 9.2 9.5 10.3 10.6 9.3
nd medical care encounters were for the 365 days before the time the prescription was filled, unless otherwise
with no antibiotic treatment were propensity-score–matched with the azithromycin prescriptions. P<0.01 for com-
teristics between the amoxicillin, ciprofloxacin, and levofloxacin groups and the group of persons who did not use
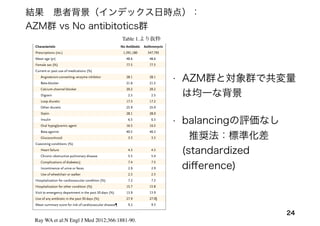
Table 1.より抜粋
• AZM群と対象群で共変量
は均一な背景
• balancingの評価なし
推奨法:標準化差
(standardized
difference)
結果 患者背景(インデックス日時点):
AZM群 vs No antibitotics群
Ray WA et al:N Engl J Med 2012;366:1881-90.
25.
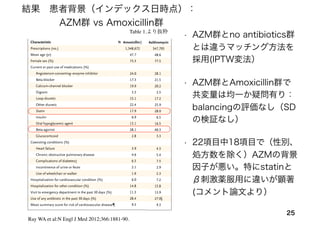
25
Table 1.より抜粋
結果 患者背景(インデックス日時点):
AZM群 vsAmoxicillin群
• AZM群とno antibiotics群
とは違うマッチング方法を
採用(IPTW変法)
• AZM群とAmoxicillin群で
共変量は均一か疑問有り:
balancingの評価なし(SD
の検証なし)
• 22項目中18項目で(性別、
処方数を除く)AZMの背景
因子が悪い。特にstatinと
β刺激薬服用に違いが顕著
(コメント論文より)
Ray WA et al:N Engl J Med 2012;366:1881-90.
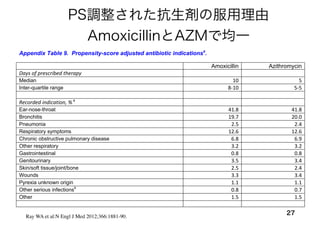
The new engl and jour nal o f medicine
Table 1. Demographic and Clinical Characteristics of Patients at the Time That the Prescriptions for the Study Antibiotics Were Filled
and at the Beginning of the Control Period for Persons Who Received No Antibiotic Treatment.*
Characteristic No Antibiotic Amoxicillin† Ciprofloxacin Levofloxacin Azithromycin
Prescriptions (no.) 1,391,180 1,348,672 264,626 193,906 347,795
Mean age (yr) 48.6 47.7 50.5 51.5 48.6
Female sex (%) 77.5 73.3 75.5 73.5 77.5
Current or past use of medications (%)
Angiotensin-converting–enzyme inhibitor 28.1 24.0 28.4 32.8 28.1
Beta-blocker 21.6 17.3 20.9 24.8 21.5
Calcium-channel blocker 20.2 19.9 22.8 24.3 20.2
Digoxin 2.5 3.5 3.8 3.6 2.5
Loop diuretic 17.3 15.1 20.1 23.8 17.2
Other diuretic 25.9 22.4 26.3 28.9 25.9
Statin 28.1 17.9 25.2 34.5 28.0
Insulin 6.5 6.9 10.2 10.2 6.5
Oral hypoglycemic agent 16.5 13.1 18.9 21.9 16.5
Beta-agonist 40.5 28.1 28.6 43.5 40.3
Glucocorticoid 3.3 2.8 3.8 4.8 3.3
Coexisting conditions (%)
Heart failure 4.3 3.9 5.3 6.8 4.3
Chronic obstructive pulmonary disease 5.5 4.6 5.1 6.8 5.4
Complications of diabetes‡ 7.4 6.5 11.3 11.7 7.5
Incontinence of urine or feces 2.9 2.1 4.6 4.3 2.9
Use of wheelchair or walker 2.3 1.6 3.2 3.8 2.3
Hospitalization for cardiovascular condition (%) 7.2 6.0 8.5 9.5 7.2
Hospitalization for other condition (%) 15.7 14.8 19.1 20.4 15.8
Visit to emergency department in the past 30 days (%) 13.9 11.3 15.6 18.0 13.9
Use of any antibiotic in the past 30 days (%) 27.9 28.4 38.6 40.3 27.0§
Mean summary score for risk of cardiovascular disease¶ 9.2 9.5 10.3 10.6 9.3
* Medications, diagnoses, and medical care encounters were for the 365 days before the time the prescription was filled, unless otherwise
specified. Control periods with no antibiotic treatment were propensity-score–matched with the azithromycin prescriptions. P<0.01 for com-
parison of baseline characteristics between the amoxicillin, ciprofloxacin, and levofloxacin groups and the group of persons who did not use
The new engl and jour nal of medicine
Clinical Characteristics of Patients at the Time That the Prescriptions for the Study Antibiotics Were Filled
e Control Period for Persons Who Received No Antibiotic Treatment.*
No Antibiotic Amoxicillin† Ciprofloxacin Levofloxacin Azithromycin
1,391,180 1,348,672 264,626 193,906 347,795
48.6 47.7 50.5 51.5 48.6
77.5 73.3 75.5 73.5 77.5
dications (%)
g–enzyme inhibitor 28.1 24.0 28.4 32.8 28.1
21.6 17.3 20.9 24.8 21.5
er 20.2 19.9 22.8 24.3 20.2
2.5 3.5 3.8 3.6 2.5
17.3 15.1 20.1 23.8 17.2
25.9 22.4 26.3 28.9 25.9
28.1 17.9 25.2 34.5 28.0
6.5 6.9 10.2 10.2 6.5
nt 16.5 13.1 18.9 21.9 16.5
40.5 28.1 28.6 43.5 40.3
3.3 2.8 3.8 4.8 3.3
4.3 3.9 5.3 6.8 4.3
lmonary disease 5.5 4.6 5.1 6.8 5.4
etes‡ 7.4 6.5 11.3 11.7 7.5
or feces 2.9 2.1 4.6 4.3 2.9
alker 2.3 1.6 3.2 3.8 2.3
ascular condition (%) 7.2 6.0 8.5 9.5 7.2
ondition (%) 15.7 14.8 19.1 20.4 15.8
ment in the past 30 days (%) 13.9 11.3 15.6 18.0 13.9
past 30 days (%) 27.9 28.4 38.6 40.3 27.0§
isk of cardiovascular disease¶ 9.2 9.5 10.3 10.6 9.3
nd medical care encounters were for the 365 days before the time the prescription was filled, unless otherwise
with no antibiotic treatment were propensity-score–matched with the azithromycin prescriptions. P<0.01 for com-
teristics between the amoxicillin, ciprofloxacin, and levofloxacin groups and the group of persons who did not use
26.
26
Table 1.より抜粋
Ray WAet al:N Engl J Med 2012;366:1881-90.
結果 患者背景(インデックス日時点):
AZM群 vs Amoxicillin群
The new engl and jour nal o f medicine
Table 1. Demographic and Clinical Characteristics of Patients at the Time That the Prescriptions for the Study Antibiotics Were Filled
and at the Beginning of the Control Period for Persons Who Received No Antibiotic Treatment.*
Characteristic No Antibiotic Amoxicillin† Ciprofloxacin Levofloxacin Azithromycin
Prescriptions (no.) 1,391,180 1,348,672 264,626 193,906 347,795
Mean age (yr) 48.6 47.7 50.5 51.5 48.6
Female sex (%) 77.5 73.3 75.5 73.5 77.5
Current or past use of medications (%)
Angiotensin-converting–enzyme inhibitor 28.1 24.0 28.4 32.8 28.1
Beta-blocker 21.6 17.3 20.9 24.8 21.5
Calcium-channel blocker 20.2 19.9 22.8 24.3 20.2
Digoxin 2.5 3.5 3.8 3.6 2.5
Loop diuretic 17.3 15.1 20.1 23.8 17.2
Other diuretic 25.9 22.4 26.3 28.9 25.9
Statin 28.1 17.9 25.2 34.5 28.0
Insulin 6.5 6.9 10.2 10.2 6.5
Oral hypoglycemic agent 16.5 13.1 18.9 21.9 16.5
Beta-agonist 40.5 28.1 28.6 43.5 40.3
Glucocorticoid 3.3 2.8 3.8 4.8 3.3
Coexisting conditions (%)
Heart failure 4.3 3.9 5.3 6.8 4.3
Chronic obstructive pulmonary disease 5.5 4.6 5.1 6.8 5.4
Complications of diabetes‡ 7.4 6.5 11.3 11.7 7.5
Incontinence of urine or feces 2.9 2.1 4.6 4.3 2.9
Use of wheelchair or walker 2.3 1.6 3.2 3.8 2.3
Hospitalization for cardiovascular condition (%) 7.2 6.0 8.5 9.5 7.2
Hospitalization for other condition (%) 15.7 14.8 19.1 20.4 15.8
Visit to emergency department in the past 30 days (%) 13.9 11.3 15.6 18.0 13.9
Use of any antibiotic in the past 30 days (%) 27.9 28.4 38.6 40.3 27.0§
Mean summary score for risk of cardiovascular disease¶ 9.2 9.5 10.3 10.6 9.3
* Medications, diagnoses, and medical care encounters were for the 365 days before the time the prescription was filled, unless otherwise
specified. Control periods with no antibiotic treatment were propensity-score–matched with the azithromycin prescriptions. P<0.01 for com-
parison of baseline characteristics between the amoxicillin, ciprofloxacin, and levofloxacin groups and the group of persons who did not use
antibiotics. See Table 7 in the Supplementary Appendix for additional cohort characteristics.
• AZM群とAmoxicillin
群で共変数は均一か疑
問有り。statinとβ刺
激薬服用に違いが顕著
• balancingの評価なし
(SDの検証なし)
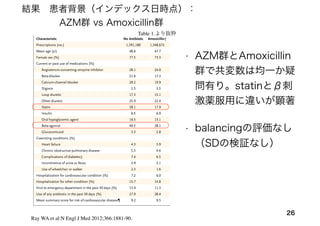
27.
PS調整された抗生剤の服用理由
AmoxicillinとAZMで均一
27
Appendix: Azithromycin andthe Risk of Cardiovascular Death 18
Appendix Table 9. Propensity-score adjusted antibiotic indicationsa
.
Amoxicillin Azithromycin
Days of prescribed therapy
Median 10 5
Inter-quartile range 8‐10 5‐5
Recorded indication, % a
Ear-nose-throat 41.8 41.8
Bronchitis 19.7 20.0
Pneumonia 2.5 2.4
Respiratory symptoms 12.6 12.6
Chronic obstructive pulmonary disease 6.8 6.9
Other respiratory 3.2 3.2
Gastrointestinal 0.8 0.8
Genitourinary 3.5 3.4
Skin/soft tissue/joint/bone 2.5 2.4
Wounds 3.3 3.4
Pyrexia unknown origin 1.1 1.1
Other serious infectionsb
0.8 0.7
Other 1.5 1.5
a
Based on proportion with known indication, see MS Table 2. The propensity score is for azithromycin vs amoxicillin.
Ray WA et al:N Engl J Med 2012;366:1881-90.
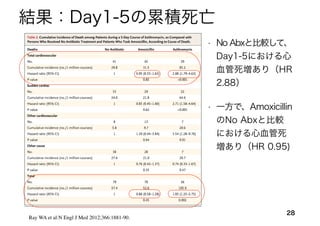
29
The regression modelcoefficients for the study covariates must be interpreted cautiously. Because
controlling for confounding relies upon the propensity score, these coefficients are not completely adjusted for
other factors. For example, male sex is associated with increased risk. However, the corresponding HRs for
these covariates are not well adjusted for other cardiovascular risk factors, as the propensity score can only be
demonstrated to perform this adjustment for azithromycin.
Appendix Table 10. Proportional hazards regression model estimates. These are for azithromycin 5
day course of therapy versus comparable period for amoxicillin, cardiovascular death endpoint.
Obs Parameter ClassVal0 Prob ChiSq Hazard Ratio CL Low CL High
1 Year before 1995 0.4179 1.5253 0.5490 4.2360
2 Age, 1 year increase <.0001 1.0551 1.0330 1.0770
3 Female vs male <.0001 0.3461 0.2150 0.5560
4 Antibiotic 4: azithromycin 0.0025 2.4909 1.3790 4.5010
5 Propensity Score Decile 9 0.0675 4.7179 0.8940 24.8870
6 8 0.2658 2.6600 0.4750 14.9000
7 7 0.1557 3.3763 0.6290 18.1160
8 6 0.7043 0.6687 0.0840 5.3420
9 5 0.9109 1.1149 0.1660 7.4960
10 4 0.2334 2.4878 0.5560 11.1390
11 3 0.1396 2.7965 0.7150 10.9420
12 2 0.1358 2.7582 0.7270 10.4600
13 1 0.4808 1.6736 0.4000 7.0050
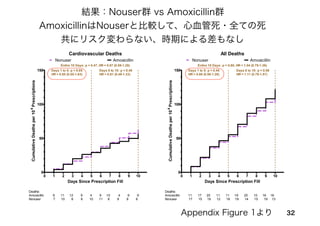
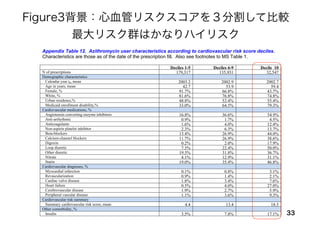
Appendix Figure 2 shows cardiovascular and total mortality for the comparison of ciprofloxacin and
levofloxacin versus amoxicillin.
Appendix: Azithromycin and the Risk of Cardiovascular Death 22
Appendix Table 11 shows alternative analyses for the comparison of cardiovascular deaths during a 5
day course of azithromycin therapy versus a comparable time period for amoxicillin. The analyses include a
propensity-score stratified analysis, in which we calculated the HR for each decile of the azithromycin:
amoxicillin propensity score. The model for each stratum included age and gender. The pooled estimated was
calculated as the inverse-variance weighted mean of the stratum-specific estimates.11
The pooled HR was
2.53 (1.37-4.67), essentially identical to that of 2.49 (1.38-4.50) from the primary analysis. We also performed
the same analysis for the azithromycin vs nonuser control comparison; the HR from the propensity-score
stratified analysis was 3.01 (1.84-4.94), very similar to that of 2.88 (1.79-4.63) from the primary analysis.
We also performed a repeated measures analysis that controls for possible within-person
dependencies (although theoretically the use of non-overlapping time periods and only one endpoint per
person should make this unnecessary) as well as one that includes terms for other potentially proarrhythmic
drugs. The latter include non-study macrolides/fluoroquinolones, methadone,12
anti-arrhythmic medications
that can cause torsade de pointes (disopyramide, procainamide, amiodarone, sotalol, quinidine, dofetilide),13;14
cisapride,15
terfenadine,16
and astemizole.17
Findings for both of these analyses were essentially identical to
those of the primary analysis.
Appendix Table 11. Alternative analyses.
All Cardiovascular Death HR 95% CI
Primary analysis 2.49 1.38-4.50
Propensity-score stratified analysis 2.53 1.37-4.67
Repeated measures analysis to control for possible
dependence between different time periods within the same
patient.
2.49 1.40-4.42
Model includes terms for other proarrhythmic drugs 2.51 1.38-4.54
様々なモデルで検証
AZMによる心血管死↑
37Albert RK etal. N Engl J Med 2011;365:689-698
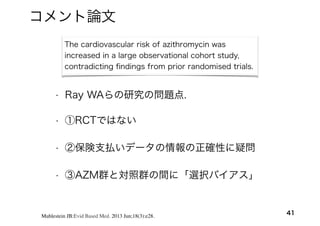
コメント論文
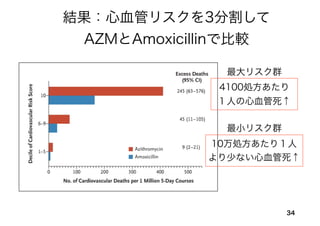
AZMによるCOPD急性増悪の予防ができるか調査したRCT
QT延長のリスク
がある患者は対象
から除外
Azithromycin for prevention of exacerbations of COPD
リスクが高い人はQT間
隔をモニタリングすれば
AZMは使用可能
AZMによるQT延長なし
38.
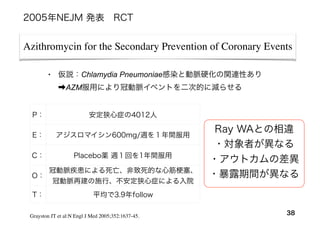
Azithromycin for theSecondary Prevention of Coronary Events
38
P: 安定狭心症の4012人
E: アジスロマイシン600mg/週を1年間服用
C: Placebo薬 週1回を1年間服用
O:
冠動脈疾患による死亡、非致死的な心筋 塞、
冠動脈再建の施行、不安定狭心症による入院
T: 平均で3.9年follow
Grayston JT et al:N Engl J Med 2005;352:1637-45.
2005年NEJM 発表 RCT
• 仮説:Chlamydia Pneumoniae感染と動脈硬化の関連性あり
➡AZM服用により冠動脈イベントを二次的に減らせる
Ray WAとの相違
・対象者が異なる
・アウトカムの差異
・暴露期間が異なる
The cardiovascular riskof azithromycin was
increased in a large observational cohort study,
contradicting findings from prior randomised trials.
• ①RCTではない
• ②保険支払いデータの情報の正確性に疑問
• ③AZM群と対照群の間に「選択バイアス」
41Muhlestein JB:Evid Based Med. 2013 Jun;18(3):e28.
• Ray WAらの研究の問題点.
コメント論文
42.
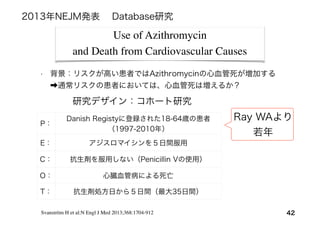
Use of Azithromycin
andDeath from Cardiovascular Causes
42
P:
Danish Registyに登録された18-64歳の患者
(1997-2010年)
E: アジスロマイシンを5日間服用
C: 抗生剤を服用しない(Penicillin Vの使用)
O: 心臓血管病による死亡
T: 抗生剤処方日から5日間(最大35日間)
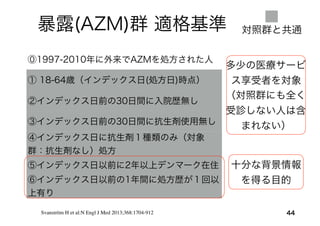
Svanström H et al:N Engl J Med 2013;368:1704-912
2013年NEJM発表 Database研究
• 背景:リスクが高い患者ではAzithromycinの心血管死が増加する
➡通常リスクの患者においては、心血管死は増えるか?
研究デザイン:コホート研究
Ray WAより
若年
• AZMと3項目をマッチさせたものを、
AZM 1件に対して1-10件採用
45SvanströmH et al:N Engl J Med 2013;368:1704-912
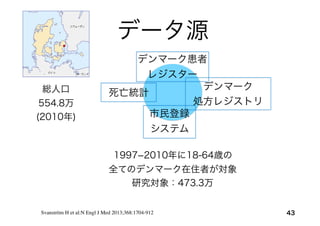
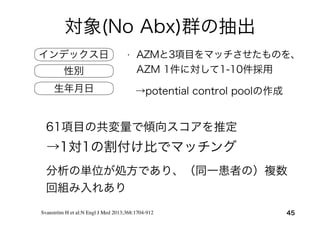
対象(No Abx)群の抽出
分析の単位が処方であり、(同一患者の)複数
回組み入れあり
インデックス日
性別
生年月日
61項目の共変量で傾向スコアを推定
→potential control poolの作成
→1対1の割付け比でマッチング
46.
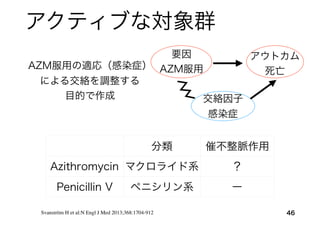
アクティブな対象群
46
分類 催不整脈作用
Azithromycin マクロライド系?
Penicillin V ペニシリン系 ー
要因
AZM服用
アウトカム
死亡
交絡因子
感染症
AZM服用の適応(感染症)
による交絡を調整する
目的で作成
Svanström H et al:N Engl J Med 2013;368:1704-912
47.
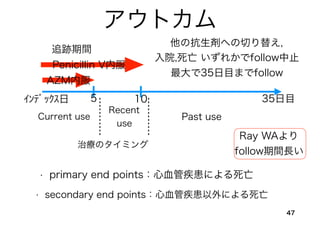
アウトカム
47
• primary endpoints:心血管疾患による死亡
• secondary end points:心血管疾患以外による死亡
他の抗生剤への切り替え,
入院,死亡 いずれかでfollow中止
最大で35日目までfollow
インデックス日 5
AZM内服
追跡期間
Penicillin V内服
10 35日目
Current use
Recent
use
Past use
治療のタイミング
Ray WAより
follow期間長い
49
背景 :balanceの評価はp値で良いのか
Svanström Het al:N Engl J Med 2013;368:1704-912
マッチング
• AZMとPenicillin Vの
比較では, 有意差があ
る項目が多い
• AZMとNo Abxの比較
でもPS matchしてい
るが、有意差のある項
目が数カ所あり
• Ray WAと比較して合
併症が少ない
50.
50
Svanström H etal:N Engl J Med 2013;368:1704-912
Primary outcome
(No Abxと比較)AZM current useでは心血管死増 RR 2.85
Recent, Past useではリスク増加無し
AZM vs Penicillin V サブ解析
51.
51
Svanström H etal:N Engl J Med 2013;368:1704-912
Primary outcome:AZM current use
による心血管死 サブ解析(Penicillin Vと比較)
性別、年齢、心疾患の既往の有無に分けた、
いずれも有意差なし
52.
52
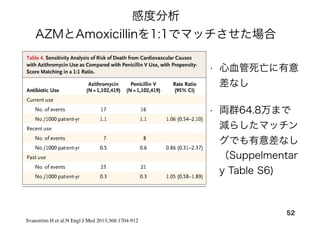
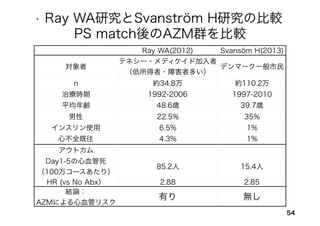
Svanström H etal:N Engl J Med 2013;368:1704-912
感度分析
AZMとAmoxicillinを1:1でマッチさせた場合
• 心血管死亡に有意
差なし
• 両群64.8万まで
減らしたマッチン
グでも有意差なし
(Suppelmentar
y Table S6)