Download to read offline
![Here is an example
The select distinct command
returns a list from the data source
with all duplicates removed
select distinct [CustomerID]
from [AdventureWorks2019].[dbo].[vw_Sales_by_Customer]
order by [CustomerID]](https://image.slidesharecdn.com/sqltipsselectdistinctonecolumn-220401094841/95/SQL-Tips-Select-Distinct-one-column-pptx-3-638.jpg)
![But suppose we want to know more
This customer has 3 separate
orders, and we want to create a
summary by customer
select [CustomerID], SUM(LineTotal) as TotalSales
, COUNT([shipdate]) as [Count of ShipDates]
, COUNT (distinct [shipdate]) as [Count of Unique ShipDates]
from [AdventureWorks2019].[dbo].[vw_Sales_by_Customer]
where customerID = 11000
group by [CustomerID]](https://image.slidesharecdn.com/sqltipsselectdistinctonecolumn-220401094841/95/SQL-Tips-Select-Distinct-one-column-pptx-4-638.jpg)
![Breaking this down
COUNT([shipdate])
as [Count of ShipDates]
This simply returns a count of the number
of values in the record set. In this case
there are 8 order lines, so it doesn’t give
us what we need
COUNT (distinct [shipdate])
as
[Count of Unique ShipDates]
Adding ‘distinct’ eliminates the
duplicates and returns the number of
unique ship dates](https://image.slidesharecdn.com/sqltipsselectdistinctonecolumn-220401094841/95/SQL-Tips-Select-Distinct-one-column-pptx-5-638.jpg)
![Use Cases
Adding distinct into your queries is a great way of excluding duplication within the records
This can be very useful in things such as customer classification, capturing the frequency of purchase
It can also be very useful to check for duplicates within a data set, by comparing the count and count distinct, if they are
the same then all relevant records must be unique
-- Customers with only one order
select [CustomerID], TotalSales from
(
select [CustomerID], SUM(LineTotal) as TotalSales
, COUNT( [shipdate]) as [Count of ShipDates]
, COUNT (distinct [shipdate]) as [Count of Unique
ShipDates]
from [AdventureWorks2019].[dbo].[vw_Sales_by_Customer]
group by [CustomerID]
) a
where [Count of Unique ShipDates] = 1
-- Customers with more than one order
select [CustomerID], TotalSales from
(
select [CustomerID], SUM(LineTotal) as TotalSales
, COUNT( [shipdate]) as [Count of ShipDates]
, COUNT (distinct [shipdate]) as [Count of Unique
ShipDates]
from
[AdventureWorks2019].[dbo].[vw_Sales_by_Customer]
group by [CustomerID]
) a
where [Count of Unique ShipDates] > 1](https://image.slidesharecdn.com/sqltipsselectdistinctonecolumn-220401094841/95/SQL-Tips-Select-Distinct-one-column-pptx-6-638.jpg)

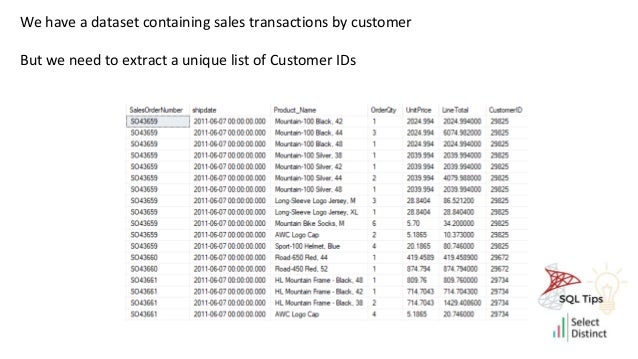
The document explains how to use the SQL 'SELECT DISTINCT' command to extract unique customer IDs from a sales transaction dataset and summarizes sales data by customer. It emphasizes the importance of using 'COUNT' and 'COUNT(DISTINCT)' to differentiate between total order counts and unique ship dates. Additionally, it provides SQL query examples to identify customers with unique and multiple orders.


![[DSC Europe 25] Boris Perkovic - Lost in performance.pptx](https://cdn.slidesharecdn.com/ss_thumbnails/uq5hrp7vsuahqkxzifux-1-251204082258-fd2ee09d-thumbnail.jpg?width=640&height=640&fit=bounds)


![[DSC Europe 25] Vid Stimac - Policy Parsimony: Between Oversimplifying and Ov...](https://cdn.slidesharecdn.com/ss_thumbnails/eqlepagzqp2rhg3gbluh-dsc-stimac-251120-251205090438-059e7f54-thumbnail.jpg?width=640&height=640&fit=bounds)


![[DSC Europe 25] Goran Obradovic - The Rise of Sovereign AI: Building the Regi...](https://cdn.slidesharecdn.com/ss_thumbnails/7nw2xxixrxqdxvrb5wca-6-251205085714-ab09a2ac-thumbnail.jpg?width=640&height=640&fit=bounds)
![[DSC Europe 25] Nikola Rajovic - Hardware Technologies Under the Hood: RISC-V...](https://cdn.slidesharecdn.com/ss_thumbnails/o2gptrmtoyqndgoshwgq-dsc2025-tenstorrent-rajovic-251205090438-814685f5-thumbnail.jpg?width=640&height=640&fit=bounds)
![[DSC Europe 25] Petar Zivanov - AI meets documents From chatbots to AI-powere...](https://cdn.slidesharecdn.com/ss_thumbnails/xer2bb6nrdc8pdpev0pc-8-251204082258-7c2fa4a1-thumbnail.jpg?width=640&height=640&fit=bounds)


![[DSC Europe 25] Bogdan Daniel Maruneac - AI - It starts with you.pptx](https://cdn.slidesharecdn.com/ss_thumbnails/odov3snhrcqs9hx5ny2n-4-251205085715-f1daacfe-thumbnail.jpg?width=640&height=640&fit=bounds)
![[DSC Europe 25] Max Talanov - Non digital NNs.pptx](https://cdn.slidesharecdn.com/ss_thumbnails/wif8tr3gtua74qvtopke-non-digital-nns-251205090438-26b0eea6-thumbnail.jpg?width=640&height=640&fit=bounds)