1. MSA 8110 Final Project
PRIORITY 1: Assessand Clean DataStep1: Imported Data Tablesfrom UA_SAMSCLUB into ES611926
Tables Imported from UA_SAMSCLUB
dbo.Store_Visits sc.Store_Visits
dbo.Member_Index sc.member_index
dbo.store_information sc.store_information
Imported to ES611926
Step 2: Assessdata for entity integrity,referential integrityandoverall data integrity
Entity Integrity
Requirements
-All PKentriesare unique andcannothave the same valuesonkey
attribute(s) andnopart of the PK may be null
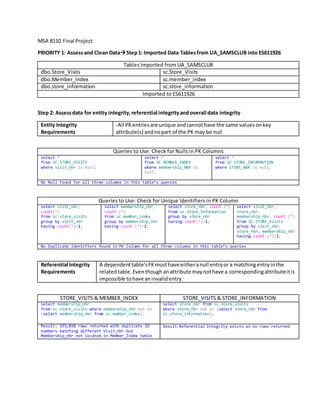
Queries to Use: Check for Nulls in PK Columns
select *
from SC.STORE_VISITS
where visit_nbr is null;
select *
from SC.MEMBER_INDEX
where membership_NBR is
null;
select *
from SC.STORE_INFORMATION
where STORE_NBR is null;
No Null Found for all three columns in this table’s queries
Queries to Use: Check for Unique Identifiers in PK Column
select visit_nbr,
count(*)
from sc.store_visits
group by visit_nbr
having count(*)>1;
select membership_nbr,
count (*)
from sc.member_index
group by membership_nbr
having count (*)>1;
select store_nbr, count (*)
from sc.Store_Information
group by store_nbr
having count(*)>1;
select visit_nbr,
store_nbr,
membership_nbr, count (*)
from SC.STORE_Visits
group by visit_nbr,
store_nbr, membership_nbr
having count (*)>1;
No Duplicate Identifiers found in PK Column for all three columns in this table’s queries
Referential Integrity
Requirements
A dependenttable’sFKmusthave eitheranull entryor a matchingentryinthe
relatedtable.Eventhoughanattribute maynothave a correspondingattributeitis
impossible tohave aninvalidentry.
STORE_VISITS & MEMBER_INDEX STORE_VISITS & STORE_INFORMATION
select membership_nbr
from sc.store_visits where membership_nbr not in
(select membership_nbr from sc.member_index);
select store_nbr from sc.store_visits
where store_nbr not in (select store_nbr from
sc.store_information);
Result: 193,898 rows returned with duplicate ID
numbers matching different Visit_nbr but
Membership_nbr not located in Member_Index table
Result: Referential Integrity exists as no rows returned
2. Data Integrity In a relational database,aconditioninwhichthe datainthe DB complywithall entityand
referentialintegrityconstraints.
Query used: checking for blank values
select *
from sc.store_visits
where len(member_code)=0;
Result: 4 rows with unique membership_nbr’s but no member_code. All other columns with no null indicators
tested successfully for values
Proposed Solution: Fill Member_code wth dummy values where code has been left blank
Query Used: Checking for (-} values where inappropriate
A) select visit_nbr, total_visit_amt, refund_code from sc.store_visits where total_visit_amt<=0;
B) select visit_nbr, total_visit_amt, refund_code from sc.store_visits where refund_code=0 and
total_visit_amt<=0;
C) select visit_nbr, membership_nbr, total_visit_amt, refund_code, member_code from sc.store_visits
where refund_code=1 and total_visit_amt>=0;
A) Results: Refund Code =1 when total_visit_amt <=0 implies a credit back to the customer has been made
therefore a (-) value should be inserted.
B) Result: No rows populated
C) Result: 12,302 rows populated with (+) values when refund code >0;
Suggested update: to 0 where rows with total_visit_amt>0 and refund_code=1. Update to 0 instead of
changing to (-) value as not enough information is available to know exactly how the credit if
applicable was applied.
Data Not Used: sales_tax, tender_amt, tot_unit_cost
Reason for Un-Used Data: not enough data on functional relations between columns to correct data, therefore
data is being excluded from analysis.
Step 3: Clean/Scrub the Data
Query Used: To Insert Dummy Value for missing Member_Code
update sc.store_visits
set member_code = 99999
where len(member_code)=0;
Query Used: To Correct incorrect (-) Values
update sc.store_visits
set total_visit_amt=0
where refund_code=1 and total_visit_amt>0;
Note: Please see Step 2 C for explanation of why this query was used.
Query Used: To Delete Membership_nbr from store_visits not found in member_index
delete from sc.store_visits
where membership_nbr not in (select membership_nbr from sc.member_index);
3. Priority 2: Data Analysis: Step4: Data Analysis usingSQL
TASK(s): Analyze and Report:
1) Overall AssessmentofStore Sales:
a) Summaryof Total Sales
b) Summaryof Total Salesbyeach store
c) Summaryof Total Salesbreakdowns:
i) Day of Week
ii) MembershipType
d) Performanyadditional analysisandprovide useful insights
2) Assessmentofmemberbuying behavior:
a) Summaryof typical purchase patterns(amount&# of items) bymemberpervisit
b) Summaryof membervisitbreakdowns:
i) Day of Week
ii) Hours duringDay
c) ID the characteristicsof the most active (insalesandfrequentvisits) members
3) Performany additional analysis and provide useful
Task 1
a) Total Sales Query:
select sum(total_visit_amt) as Sales
from sc.store_visits
where total_visit_amt>=0 or refund_code!=1;
b) Total Sales by Store:
select distinct(store_nbr), sum(total_visit_amt) as TOTAL_SALES
from sc.store_visits
where total_visit_amt>=0 and refund_code!=1
group by store_nbr
order by total_sales desc;
c) Total Sales Break Down
i) Total Sales Break Down by Day of the Week:
select datepart(weekday, transaction_date) as weekday, sum(total_visit_amt) as TotalSales
from sc.STORE_VISITS
where total_visit_amt>=0
group by datepart(weekday, transaction_date)
ii) Total Sales Break Down by Member_Type:
Note: First a combinedtable ofstore_visits &member_index.QueryUsed:
select a.MEMBER_TYPE, b.total_visit_amt
into #Sales
from sc.member_index a right join sc.store_visits b on a.membership_nbr=b.membership_nbr
group by a.member_type, b.total_visit_amt;
select distinct member_type, sum(total_visit_amt) as TotSales
from #Sales
where total_visit_amt>=0
group by member_type;
d) Additional Analysis Queries:
Top Performing Sale Days Grouped by Member_Type:
select datepart(weekday, b.transaction_date) as weekday, a.MEMBER_TYPE, b.total_visit_amt
into #Sales1
from sc.member_index a right join sc.store_visits b on a.membership_nbr=b.membership_nbr
group by b.transaction_date, a.member_type, b.total_visit_amt order by weekday;
select distinct weekday, member_type, sum(total_visit_amt) as TotSales
from #Sales1
where total_visit_amt>=0
group by weekday, member_type
order by weekday, totsales desc;
4. Member Type and Sales broken down by store:
select datepart(weekday, b.transaction_Date) as weekday, b.store_nbr, a.MEMBER_TYPE,
count(a.membership_nbr) as #Members, b.total_visit_amt
into #Sales2
from sc.member_index a right join sc.store_visits b on a.membership_nbr=b.membership_nbr
group by a.member_type, b.transaction_Date, b.store_nbr, b.total_visit_amt, a.membership_nbr;
select distinct store_nbr, member_type, sum(#members) as #type, sum(total_visit_amt) as Spent
from #sales2
where total_visit_amt>=0
group by store_nbr, member_type
order by store_nbr;
Task 2
a) Typical Purchase Patterns (amount& # of items) bymembersper visit
Create a Temp Table:
select datepart(weekday, transaction_date) as weekday,(transaction_time/1000000) as [HOUR],
visit_nbr, total_visit_amt, tot_scan_cnt
into #Sales3
from sc.store_visits
group by datepart(weekday, transaction_date), (transaction_time/1000000), visit_nbr,
total_visit_amt, tot_scan_cnt
Checking for Table:
select * from #sales3
Count of Total Visit_nbr, average sales per visit, average # of items:
select count(visit_nbr) as TotalVisits, avg(total_visit_amt) as avgsale_visit,
avg(tot_scan_cnt) as avgitemcnt
from #sales3
where total_visit_amt>=0;
Note: Above Query written to exclude returns/negative sale values
Count # of Distinct Membership_nbr and Average visit per member:
select datepart(weekday, transaction_date) as weekday,(transaction_time/1000000) as [HOUR],
membership_nbr, count(visit_nbr) as #Visit, total_visit_amt, tot_scan_cnt
into #Sales4
from sc.store_visits
group by datepart(weekday, transaction_date), (transaction_time/1000000), membership_nbr,
total_visit_amt, tot_scan_cnt
select * from #sales4
Displays # Visits Per Member
select distinct membership_nbr, sum(#Visit) as Visits
into #temp0
from #sales4
where total_visit_amt>=0
group by membership_nbr;
Displays Average Visit Per Member
select count(membership_nbr) as #members, avg(visits) as AvgVisit from #temp0
5. b) Provide Summary of MemberVisitsBreakdowns:
Create WeekDay Table:
select distinct datepart(weekday,transaction_date) as weekday
into #day
from sc.store_visits;
Checking for Table:
select * from #day;
Create a #membership tableto store allmembers
select distinct membership_nbr
into #members
from sc.member_index;
Checking for Table:
select * from #members
Create a combined #day_membertable
select weekday, membership_nbr
into #day_members
from #day cross join #members;
Checking for Table:
select * from #Day_members
Create a #Datasettableby left join#day_members with the #Sales2 table:
select a.weekday, b.membership_nbr, b.Hour, sum(b.#visit) as TotVisit, sum(b.total_visit_amt)
as TotSale, sum(b.tot_scan_cnt) as TotItem
into #Dataset
from #Day_members a left join #Sales5 b
on a.weekday=b.weekday and a.membership_nbr=b.membership_nbr
group by a.weekday, b.Hour, b.membership_nbr
order by a.weekday;
Check for Table:
select * from #Dataset;
Update Query:
select * from #dataset
update #dataset
set totSale=0
where totSale<0
update #dataset
set totItem=0
where totSale=0
i) By Day of Week:
select Weekday, count(membership_nbr) as #Members,Sum(totVisit) as Total_Visits,
sum(totSale) Total_Sales, sum(TotItem) as Total_Items
from #Dataset
group by weekday
ii) By Hours During a Day:
select distinct Hour, count(membership_nbr) as #Members,sum(totvisit) as Total_visit,
sum(totsale) as Total_sales, sum(totitem) as total_items
from #Dataset2
group by Hour
order by Hour desc
6. c) ID the characteristics of the most active (in salesand in frequentvisits) members
QUERY to ID TOP 15 based on Total_sales and #VISITS:
select top 15 membership_nbr, count(hour) as #Visits, sum(sales) as TOTAL_SALES, sum(itemcnt)
as TOTAL_ITEMCNT
from #dataset
group by membership_nbr
order by TOTAL_SALES desc, #Visits desc;
d) Avg Sale and Item by Hour and Day
select distinct Hour, avg(totsale) as AvgSale, avg(totitem) as AvgItems
from #Dataset2
group by Hour
order by Hour desc
7. Task 1 Results
a) Total Sales =$64,623,769.65
b) Store_Nbr & Total Sales
18 5791990.04
15 4756625.64
24 4530115.62
27 4382872.87
19 4281760.27
21 3867094.50
28 3730117.50
20 3558149.57
26 3480692.58
29 3425846.25
5 3381878.74
16 3267488.93
22 3184074.35
25 2875560.22
4 2598886.30
17 2573647.71
3 2486413.71
23 2450554.85
c) Day of Week& Total Sales
1 Mon 9,854,511.58
2 Tues 9,068,451.60
3 Wed 6,688,436.60
4 Thur 6,696,184.47
5 Fri 7,348,921.78
6 Sat 9,259,135.96
7 Sun 13,685,584.17
MemberType & Total Sales
E 219,401.10
Y 14,519.50
G 13,487.12
3 12,517.61
H 1,953.13
A 502,865.01
W 6,985,452.22
X 6,067,036.65
1 11,754.68
D 56,829.09
V 6,044,250.25
Z 9010.12
d) Top Sale Days organized by MemberType
Day M_Type Sales
7Sunday V $5,102,319.46
7Sunday W $3,729,507.83
2 X $1,511,115.64
5 A $154,879.90
6 E $117,923.12
5 D $13,376.19
7 G $4,435.72
6 Y $3,794.28
7 1 $3,452.14
4 3 $2,980.68
3 Z $2,386.06
2 H $1,150.99
8. Most frequentVisitorgroupedby store order by #MemberType
Store Type #Type sale
18 V 46508 $ 2,923,557.90
15 W 26895 $ 1,882,085.31
20 X 9078 $ 478,001.79
23 A 4976 $ 51,262.87
22 3 139 $ 9,231.70
26 E 112 $ 22,792.14
26 D 66 $ 9,769.09
24 Y 62 $ 5,914.94
21 G 42 $ 5,105.56
24 Z 38 $ 4,466.81
26 1 38 $ 6,869.71
22 H 6 $ 1,762.71
Task 2 Results
a) Summary of Purchase Patterns
Visits Sales Items
789,943 $64,623,769.65 $6,609,868
AveragesSale andItemsperVisit:
Total_Visit Sales Items
789,943 $81.808142 8
#Members AvgVisit/Members
282316 2
b) MembervisitBreakdowns
i) By Day ofthe Week
Totals:
Day #members TotVisit TotSales TotItems
1 Monday 92,924 128,331 $ 9,854,511.58 1,029,430
2 Tuesday 88,252 121,760 $ 9,068,451.60 919,459
3Wednesday 66,089 89,672 $ 6,688,436.60 686,271
4Thursday 63,927 87,209 $ 6,696,184.47 679,817
5Friday 69,778 95,767 $ 7,348,921.78 762,536
6Saturday 84,691 116,792 $ 9,259,135.96 976,163
7Sunday 125,017 174,532 $ 13,685,584.17 1,494,974
9. ii) By Hour of the Day (totals)
Hour #members TotVisit TotSales TotItems
21 92 117 $ 53,223.52 7,995
20 16,397 20,376 $ 2,073,567.65 194,454
19 35,547 47,182 $ 3,890,335.06 399,504
18 40,493 55,487 $ 4,202,097.93 442,749
17 50,964 69,393 $ 5,234,699.21 547,431
16 59,041 81,558 $ 6,162,529.00 639,720
15 62,606 87,344 $ 6,557,986.47 678,389
14 66,350 92,813 $ 7,081,434.92 742,840
13 67,057 94,649 $ 7,082,559.66 757,477
12 64,054 91,749 $ 6,699,729.65 714,873
11 58,605 81,479 $ 6,115,617.03 657,350
10 45,158 59,939 $ 4,575,482.35 472,832
9 17,473 22,240 $ 1,836,507.65 181,723
8 4,970 6,712 $ 704,855.45 73,829
7 1,585 2,429 $ 292,911.61 32,536
6 171 382 $ 23,438.63 3,097
5 77 162 $ 7,525.51 924
4 36 49 $ 6,669.96 924
2 2 3 $ 54.90 3
c) Characteristics ofthe most active membersin termsof frequencyand sales
The QueriesruninTask1 and Task2 reveal Member_TypesW,XandV are the
mostactive membersintermsof salesandfrequencyof visits.Theyare most
dominantintermsof salesand visitsinstore numbers18,15 & 20. However,
while the datashowsthe majorityof membersvisitandspendthe mostonDay 1
and Day 7, whichholdstrue for member_typesW&V,member_type Xmakesthe
greatestnumberof visitsandspendsthe mostonday 2. As no member_type
dominatedday1, day1 revealeditself tobe the mostdiverse inmember_type
withthe secondhighest#in salesandfrequencyof visits. Lastly,visitfrequency
and saleswere attheirmax during13:00 & 14:00.
11. Priority 3:Task 3: Summary of Highlights and Takeaways based on Task 1 & Task 2 Data Analysis
Note to Reader:
Salesdata beinganalyzedfortoday’smeetingisforthe monthandyear of January,2000 and shouldbe used
incombinationwithdataforthe yearsfollowingtoforecastsale volumesforthe monthof January.
Functionsusingtotal_visit_amouthave beencalculatedtoexclude negativevalues,andItem_cnthasbeen
updatedto0 for saiditemsreturned.
Analysismayverydue tolack of clarityand access toadditional detailsregardingthe dataprovided.
Disclaimer:The data displayhasbeenderivedfrom fictitiousdatabase andisinnoway a true representationof Sam’s
Club.
Major Highlights:
Day
Total SalesPer
Day: high, low
Member_type best
sale day
Top Performing store ordered by #M_Type
Store# M_Type #M_Type Sales
18 V 46,508 $2,923,557.90
15 W 26,895 $1,882,085.31
Totals/Day
Day #members TotVisit TotSales TotItems
1 92,924 128,331 $ 9,854,511.58 1,029,430
2 88,252 121,760 $ 9,068,451.60 919,459
3 66,089 89,672 $ 6,688,436.60 686,271
4 63,927 87,209 $ 6,696,184.47 679,817
5 69,778 95,767 $ 7,348,921.78 762,536
6 84,691 116,792 $ 9,259,135.96 976,163
7 125,017 174,532 $ 13,685,584.17 1,494,974
High Traffic Hour and Largest Sale Producer
Hour #Members #Visits Total Sales #Items
14 66,350 92,813 $ 7,081,434.92 742,840
13 67,057 94,649 $ 7,082,559.66 757,477
Note: Despite Hour #13& #14producing thegreatest sales and #visits. Averages in
Task2d show thatHour #21 produces thehighestaveragesale value 578.52anditem
count 86.
1 Monday $9,854,511.58
Day 1: Most diversein
terms of
member_type
2 Tuesday
$9,068,451.60
Type_X:
$1,511,115.64
Type_H: $1,150.99
3 Wednesday
$6,688,436.60
Type_Z: #2,386.06
4 Thursday
$6,696,184.47
Type_3: $2,980.68
5 Friday
$7,348,921.78 Type_D: $13,376.19
Type_A: $154,879.90
6 Saturday
$9,259,135.96
Type_Y: #3,794.28
7 7 Sunday $13,685,584.17
Type_W:
$3,729,507.83
Type_V:
$5,102,319.26
Type_1: $3,452.14
Type_G: $4,425.72
Major Findings:
AnalysisrevealedSam’sClub’shighesttrafficandhighestproducerstorestobe #18 and #15 withMonday and
Sunday,andhours 13:00 and14:00 producingthe bestresultsinthe same terms.Lastly,examinationalso
demonstratedfromthe averagestable inTask2dthathour #21 producedthe highestaverage sale anditemcount.Data
collectedfromtasks1 and 2 confirmsthe consistencybetweenqueryresultsfortopandbottomperformers.
Lookingsolelyatthe topperformers the hightrafficdays,hoursandstorescan be deduced. Itcan be expectedthat
Monday andSunday will see the greatestnumberof visitorswiththe highestgrossingsales,withpeakhoursacrossthe
board being13:00 and 14:00. Lastly,store #18 and #15 can expecttosee the bulkof visitsandsaleswiththe remainder
spreadout amongthe remainingstores.
The top performerdataalsoallowsfora basicstereotype the visitingmemberstobe derived. Furtheranalysis
revealsthe bulkof visitortobelongtomember_type V,Wor X.Member_type V andW spendthe most onSunday,
while member_type Xspendsthe moston Tuesdays.Interestingly,thesemember_typeseachfrequentdifferentstores:
V makesthe greatestnumberof visitstostore #18, W to store #15, and X to #20. Giventhese attributesitcanbe a
general assumptionaboutthe spendingpatternsof thesememberscanbe forecasted.
Thisdata alone,while sufficienttoroughlyforecastvisitingandspendingpatternsforthe yearof 2001, isnot sufficient
to bestanswerthe questionastowhy andhow these attributes are beinginfluence.Nordoesthe dataprovidedgive
enoughinsightintothe member_typesorproductsbeingofferedtoallow formore efficientmarketingandinventory
management.
12. Takeaways:
To assessthe cause of frequency,salesperformance,item type purchasedandmembership_type selected
additional datawhichhasnot beenrelayedthroughthe givenSam’sClubdataisdesired.
Additional Datadesiredtodevelopamore concise analysisof the topandbottomperformerswouldbe:
Store location (zipcode,state)
Unique itemidentifieranddescription(Toanalyze type andcostof productsbeingsold)
Descriptionof member_type (e.g.wholesaler,retail ect..)
Socioeconomicclassificationof memberbasedonzipcode or surveys
If the above datapointscouldbe obtainedalongwithfollowingyeardatafor the monthof January a betterunderstand
of the whyand howbehindeachdatafieldcoulddeveloped.The resultwouldnotonlybe the abilitytoprovide more
concise forecastingresultsforfrequency,salesandinventorymanagement,butalsothe abilitytounderstandand
marketmore efficientlypermember_typeandlevelineacharea.