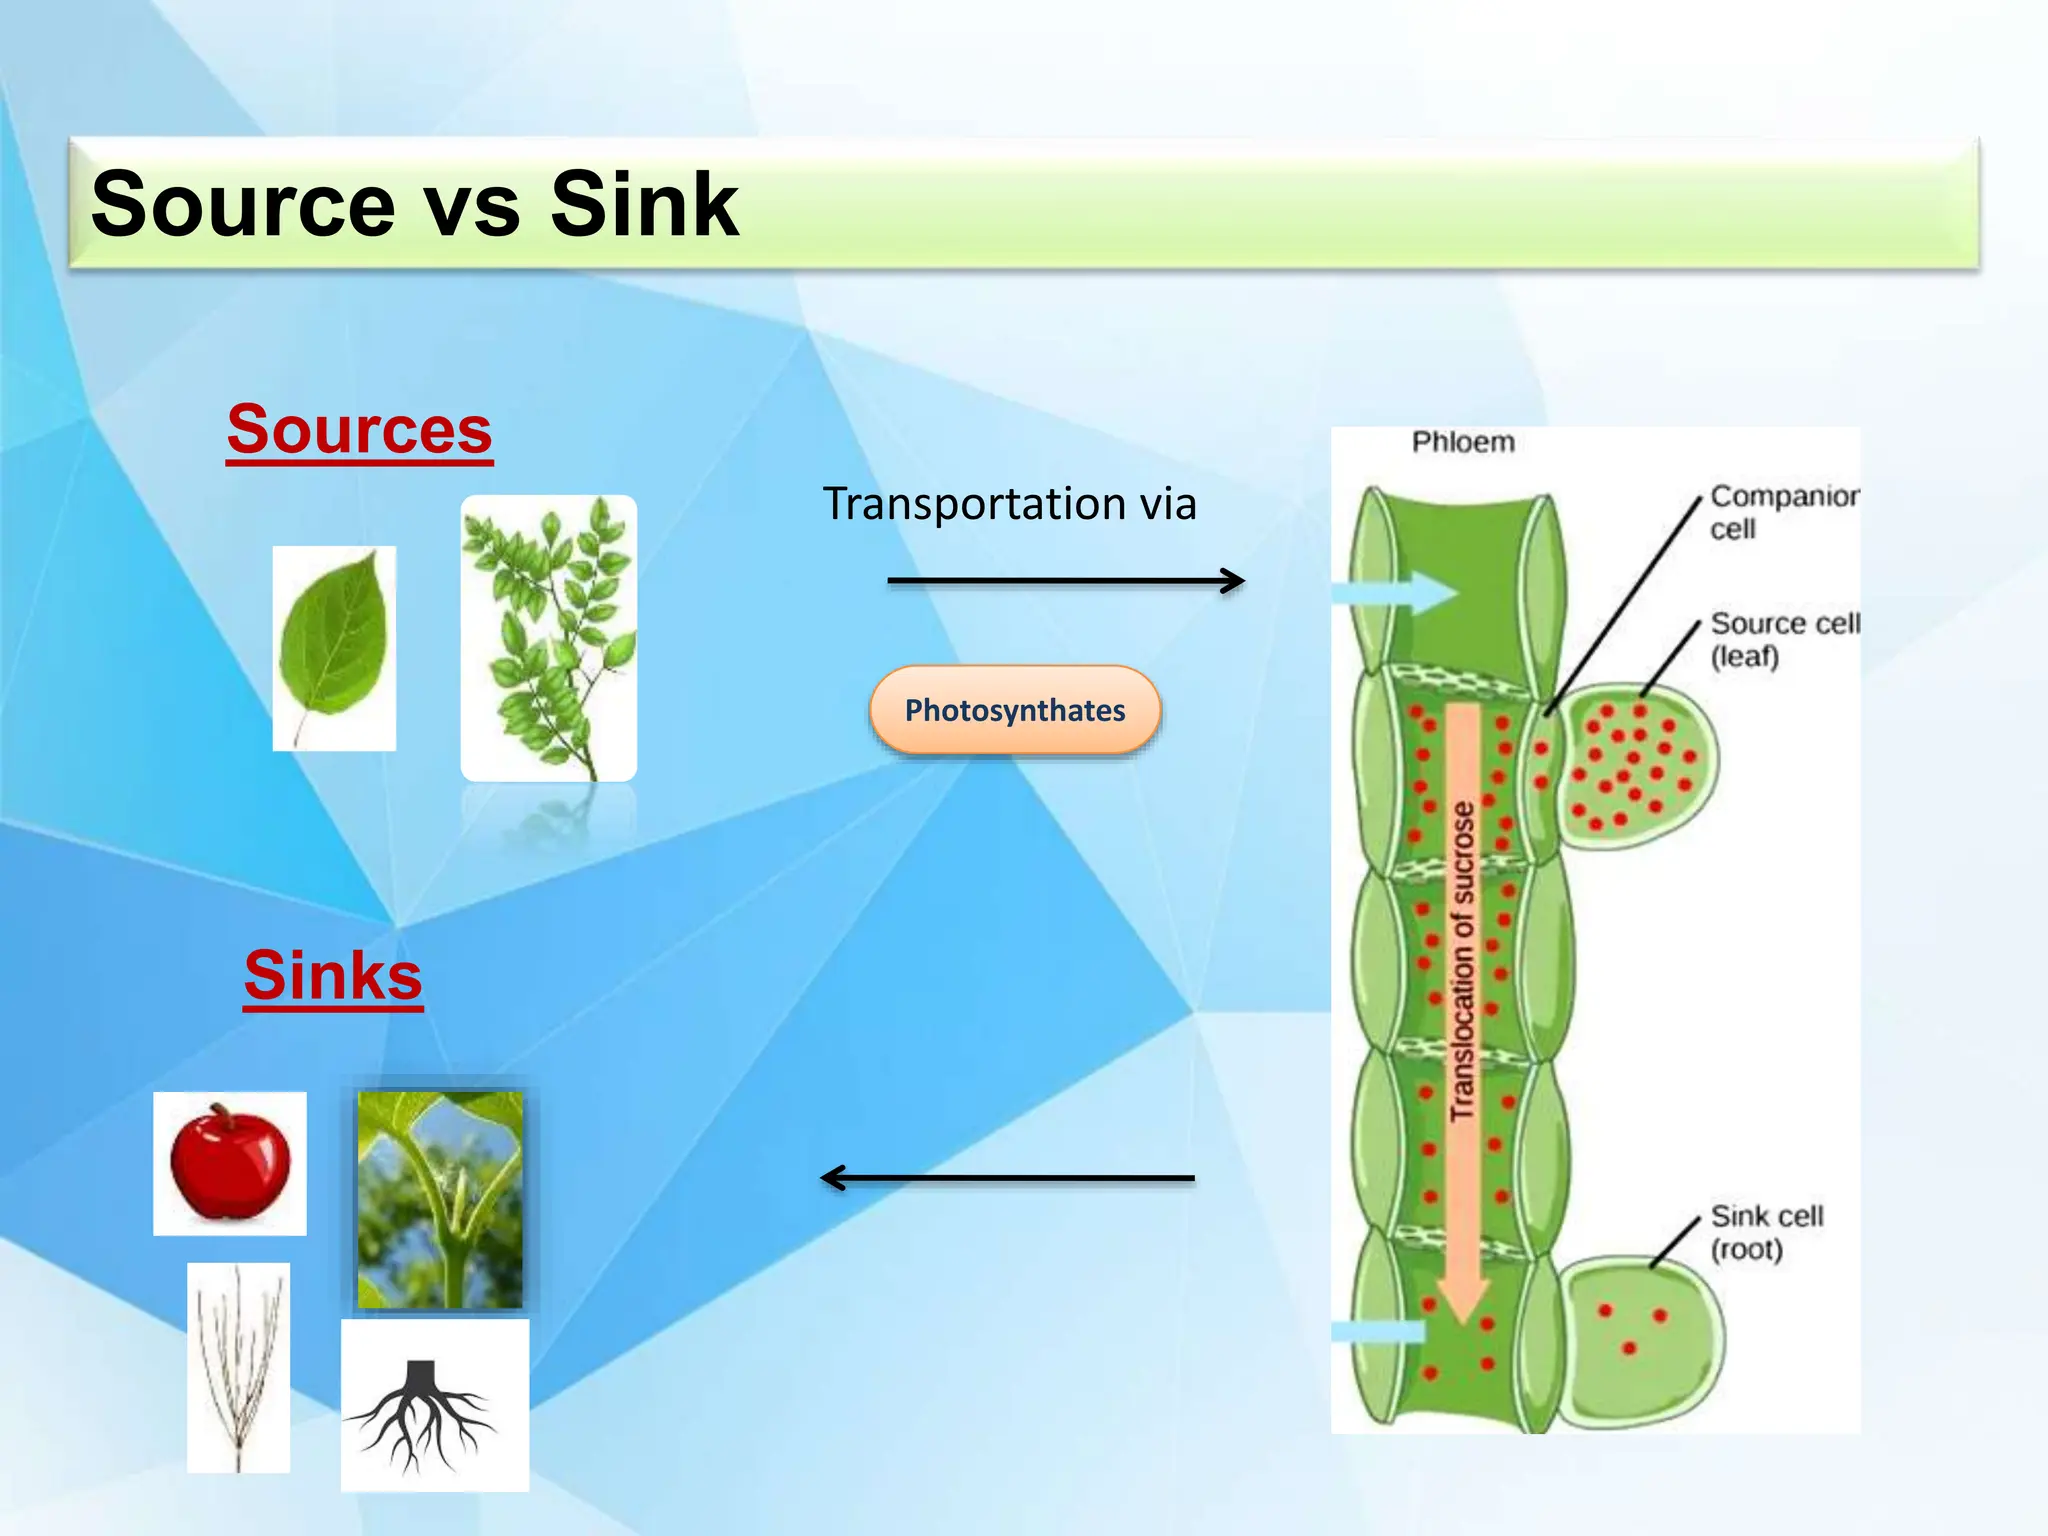
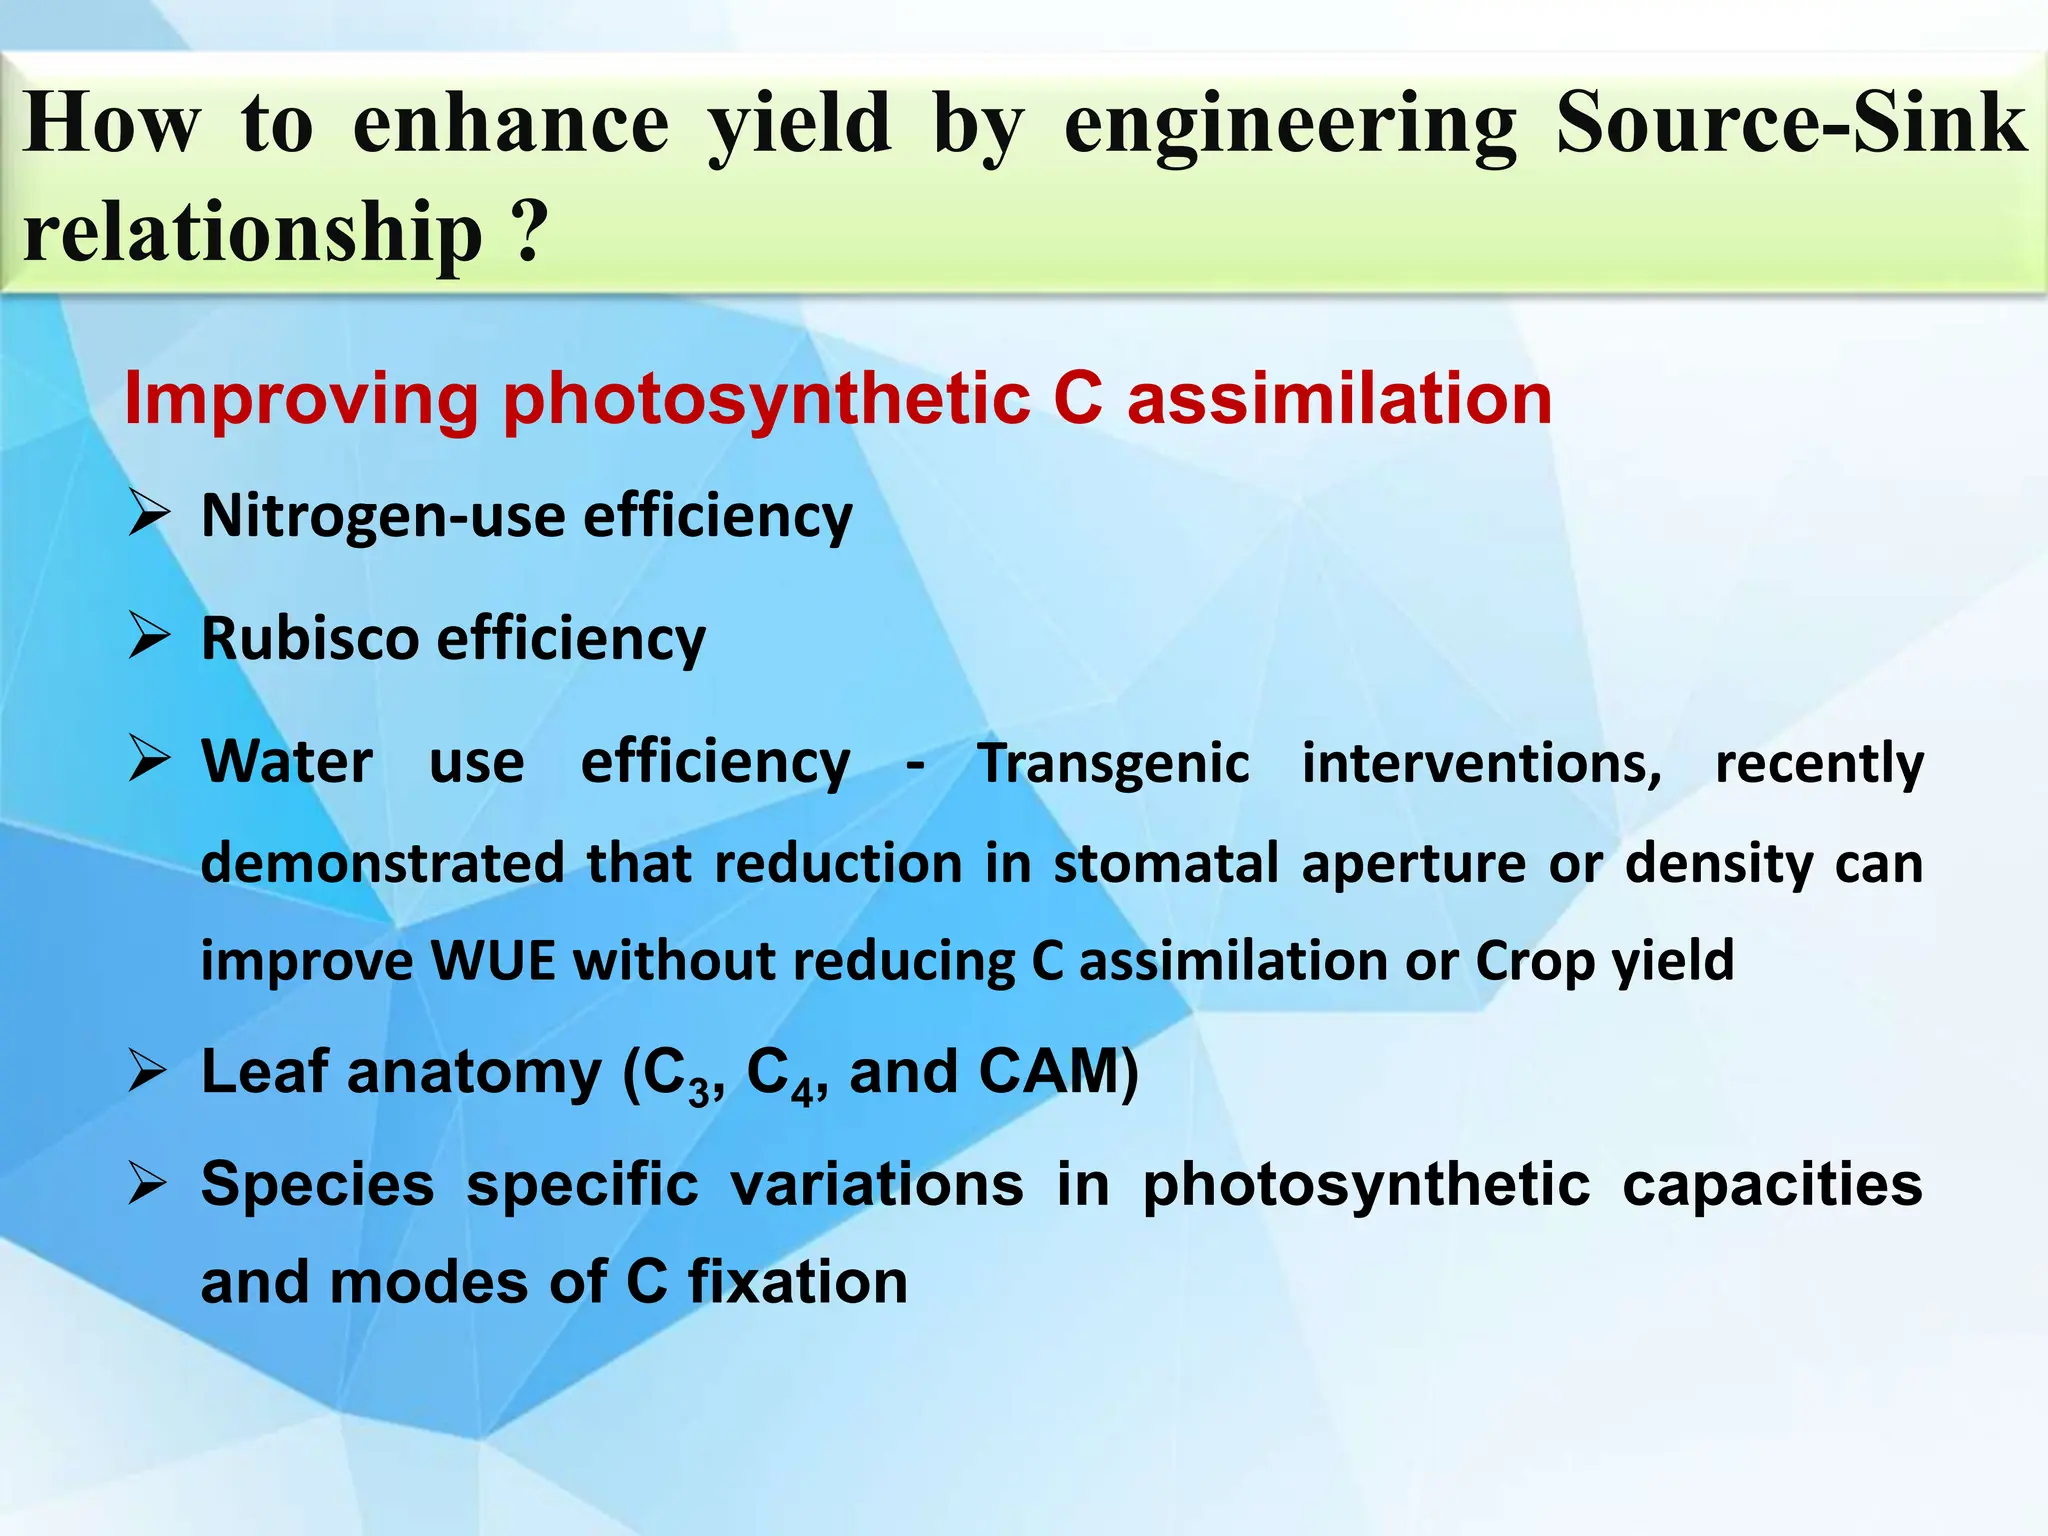
VIRUSES structure and classification ppt by Dr.Prince C P
Source and sink regulation.pptx
1. By
R. G. Vyshnavi,
Ph. D. Scholar,
Depatment of Plant Physiology,
Jawaharlal Nehru Krishi Vishwa
Vidhyalay, Jabalpur, M. P.
2. Introduction
The booming population and the environmental deterioration
is exerting pressure on agriculture to attain massive increase
in demand per hectare
Although, more emphasis has been made on the effect of
environmental conditions and diseases on yield.
Less consideration has been given to the endogenous factors
within plant such as Plant Nutrition Allocation
Whether Crop productivity is Source or Sink limited ?
i.e, whether yield is limited by C Assimilation or C usage
Based on the considerable evidence the plant growth is co-
limited by both source and sink
3. • The Yield of many crops rarely meets its maximum potential of
production
• This resulting yield gap is defined as the difference between
crop actual yield and the potential yield of the crop
• Hence, the subject of source and sink interactions will help us to
understand the disparity of yield gap, imparting in the
improvement of yield
Girdling and labeling studies support source to sink
translocation studies
4. Basic terminology
Source:
• Source is the site of photosynthetic regions. Source includes
mature green leaves and other green tissues of the plant that
produces photosynthates in the excess of their own needs and
exports them
• A Source tissue is any net producer of Photoassimilates
Sink:
• Sink includes the non-photosynthetic organs that do not
produce enough photosynthates to support their own growth.
They include developing fruits, seeds, immature leaves, roots
etc.
• A sink tissue is any net importer of Photosynthetic products
6. • Source strength = Source size x source activity
• It is determined by the rate of photosynthesis and
the efficiency of photosynthesis (C3 &C4 ) Cycle
• High plant density
• It is influenced by the leaf characteristics such as
leaf area, number of mesophyll cells, number of
Sucrose-H+ Symporters and the ability of the sieve
elements to carry the photosynthates.
Source strength
7. • Sink strength = Sink size x Sink activity
• It depends up on the potential capacity of the
sink to accumulate the photosynthates
• It is also significantly influenced by the
distance between the source and sink
Sink strength
13. • Sucrose – Sugars are translocated in non-reducing forms
(Sucrose, Raffinose and Stachyose)
• Amino acids -
a) Nitrogen fixing species : N translocates in the organic
form
b)Non-nitrogen fixing species: N translocates in both nitrate
and organic forms
• Plant Hormones – PassivelyTranslocated
• Some inorganic ions -
a) Movable : K, Mg, Phosphate and Chloride
b) Immovable: Nitrate, Ca, S, Fe
Compounds translocated in phloem
14. The mechanism of Phloem is explained by the
Pressure-Flow model
1. Phloem loading: Sucrose is actively
transported against its chemical gradient
2. After the loading of sucrose in to SEs, low
solute potential develops (negative) leading to
the low water potential
3. Hence, water enters in to the
phloem and develops turgor
pressure because of which long
distance transport occurs
4. Active Phloem unloading
5. Phloem unloading results in
high solute potential (Positive)
leading to high water potential
resulting in the movement of
water back to the xylem
15. Mechanism of Phloem loading
The phloem loading strategies:
1. Apoplatic loading
Involves SWEET transport proteins & Sucrose-H+ Symporters
Firstly, sucrose is transported from mesophyll cells to cell
wall apoplastic region through Sugars will eventually be
exported transporter proteins
And then actively imported against a concentration gradient
in to SE-CC through Sucrose-H+ Symporters .
It depends up on the sucrose concentrate gradient between
source and sink.
16. Sucrose-H+ Symporters includes as follows
1. SUC1: Encoded by SUC2 gene
2. SUC2: Located at Companion cells, involves in sucrose uptake from mesophyll
cells to companion cells
2. SUT1: Located in sieve elements, High affinity/low capacity, involves in
phloem loading in to sieve elements from companion cells
3. SUT2: Located in sieve elements, major sucrose sensor, more highly
expressed in sink
4. SUT4: Located in sieve elements, Low affinity/ High capacity, it can
complement SUT1
SUC1 carrier is
sensitive to high
Glucose levels in
mesophyll cells
17. Sequestration of sugars in the vacuole can overcome these
sugar signals, pointing to the importance of compartmentation
and the control of apoplasmic sugar levels
The sucrose leakage in the phloem (by enhancing the SWEET
Proteins)
Recently, it was reported that overexpression in maize of a rice
trehalose phosphate phosphatase in the vasculature led to
increased yield, and that this was partly due to abrogation of
feedback inhibition of photosynthesis (Fernie et al. 2020)
How feedback inhibition can be regulated ?
18. • The sucrose leakage out of the phloem is carried out by SWEET
proteins. A little portion of sucrose is anyhow required to
support surrounding stem metabolism
• However loss of excess sucrose needed to be reloaded in to the
phloem for long distance transport, Which is mediated by
sucrose or proton symporter, SUC1
• To pump protons in to the apoplast, the proton motive force is
generated by ATPases located in plasma membrane, through
ATP hydrolysis the protons are pumped in to apoplast
• the low oxygen supply in stems is a limitation for ATP
production hence, reducing the energization of phloem loading
resulting in the low PMF which can be released by AKT2
Proton Motive Force (PMF) across the SE-CC complex
19. • AKT2 in the phloem functions as a non-rectifying channel
mediating the efflux of potassium, helping to maintain the
required PMF across the SE–CC complex
• Therefore, transport phloem-specific expression of a
constitutive non-rectifying AKT variant, or any other
intervention that could ameliorate the problems associated
with a low PMF across the SE–CC complex, might therefore
provide a good strategy to improve source–sink
translocation and C loading into sink organs as a means to
increase yield (Fernie et al., 2020)
AKT2
20. Sucrose loading is regulated by
• Turgour pressure of the sieve elements
• Sucrose concentration in the apoplast
• The concentration of SUT1 transporter molecules
Sucrose efflux is regulated by
• The availability of potassium in the apoplast. Suggesting
that a better nutrient supply increases translocation to sinks
and enhances sink growth
2.Symplastic loading – Energy driven and transports sucrose,
raffinose and stachyose
Regulated by Plasmodesmata
21. Improving photosynthetic C assimilation
Nitrogen-use efficiency
Rubisco efficiency
Water use efficiency - Transgenic interventions, recently
demonstrated that reduction in stomatal aperture or density can
improve WUE without reducing C assimilation or Crop yield
Leaf anatomy (C3, C4, and CAM)
Species specific variations in photosynthetic capacities
and modes of C fixation
How to enhance yield by engineering Source-Sink
relationship ?
22. Regulating Feed back inhibition of Photosynthesis
Enhancing the constitutive non-rectifying AKT2 Variant
Compartmentation and control of Apoplastic sucrose (
Ameleoration feed back inhibition)
SWEET proteins – Sucrose leakage in Sieve elements (leaked out
sucrose is utilised by sieve element maintainance) reducing sucrose
leakage
low oxygen supply is likely to limit ATP production and, hence,
energization of phloem loading
Enhancing Photosynthesis
23. Targeted genes for enhancing Photosynthesis
Gene to be intervened Plant Result
C4 Rubisco from poaceae family
(Sorghum)
Rice Enhances the catalytic
efficiency of RUBISCO for
carboxylation
Overexpression of Rieske FeS protein Arabidopsis Increasing the quantum
efficiency of PSI &PSII
Overexpression of Sedoheptulose
biphosphatase
Wheat 22% increase in Biomass
50% increase in yield
stimulation of sedoheptulose 1,7-
bisphosphatase, fructose 1,6-
bisphophate aldolase and the
photorespiratory glycine
decarboxylase H protein
Arabidopsis Enhanced Co2
assimilation, vegetative
mass and seed yield
Overexpression of Sedoheptulose
biphosphatase
Tobacco Enhances Photosynthesis
24. Gene to be
intervened
Plant Result
Overexpression of
the rice epidermal
patterning factor
OsEPF
Rice When grown at elevated
atmospheric CO2, rice plants with low
stomatal density were able to
maintain their stomatal conductance
and survive drought and high
temperature (40 °C)
Synthetic
chloroplast
glycolate pathway
Tobacco Synthetic chloroplast glycolate
pathway Tobacco A greater than 40%
increase in biomass
Expression of a
synthetic light-
gated K+ channel–
BLINK1– in guard
cells surrounding
stomatal pores
Arabidopsis A 2.2-fold increase in biomass in
fluctuating light without cost in water
use by the plant
25. Sucrose Transporters (SUTs):
• These genes encode proteins that are
responsible for transporting sucrose from
source to sink
• They are regulated by hormones cytokinins and
auxins
Starch Synthase (SS):
• These genes encode enzymes that are involved
in the synthesis of starch in sink tissues
• They are regulated by various factors including
light intensity and hormonal signals
• They include SS1, SS2, SS3 and SS4
Genes involved in the regulation of source sink dynamics
26. Invertases
• They are involved in the breakdown of sucrose
• They include IV1, IV2 and IV3
• They are regulated by hormones and developmental
cues
Cellulose synthase (CESA)
• CESA1, CESA3 and CESA6
Transcription factors
• Several TFs are involved in regulating gene expression
related to source-sink dynamics.
• They include BZIP11, WRKY75 and NAC029
27.
28. • In potato tuber formation is depended on link
between Photoperiod and sugar transport
• Potato FT-like tuberigen interacts with a sugar
transporter to block sucrose leakage
• StSWEET11-StSP6A interaction promotes symplastic
transport of sucrose
Title: Source Sink regulation in Potato mediated by
Interaction of an FT Homolog with a SWEET Protein in Potato
31. • Therefore, the evaluation of crop responses to
source-sink ratio is a powerful tool for
knowing key phenophases for grain yield
development and more effort should be
addressed on fine tuning simulation models to
improve the accuracy of simulating source-
sink size and grain set
Conclusion