Download to read offline


![MATLAB
3
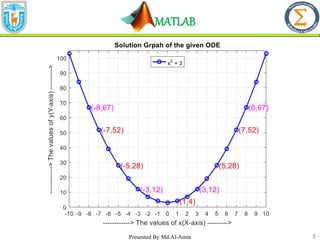
Problem 1: Solve the ODE with figure
𝒅𝒚
𝒅𝒙
= 𝟐𝒙 ; 𝒘𝒉𝒆𝒓𝒆 𝒚 𝟏 = 𝟒
Using MATLAB eval Command.
MATLAB Code:
%To remove existing data from Command Window & workspace
clc,clear all
%Solution of ODE
disp('The solution of given ODE')
ode=dsolve('Dy=2*x','y(1)=4','x')
%The range of indepentdent variable
x=-10:1:10;
%Evaluation of a object as vectorize
y=eval(vectorize(ode));
%To plot the Solution
fig=figure('color','w');
plot(x,y,'b-o','LineWidth',1.5)
grid on
xlabel('------------> The values of x(X-axis) --------->')
ylabel('------------> The values of y(Y-axis) --------->')
axis([-10 10 0 105])
Presented By Md.Al-Amin](https://image.slidesharecdn.com/solutionprocessofordinarydifferentialequationswiththeirgraphicalrepresentationandsomebasicplottingpr-230411155534-de89a47a/85/Solution-Process-of-Ordinary-Differential-Equations-with-their-Graphical-Representation-and-Some-Basic-Plotting-Process-Difference-Using-MATLAB-pptx-3-320.jpg)
![MATLAB
8
axis([-1 1 -64 290])
set(gca,'XTick',-1:0.2:1,'YTick',-64:20:290)
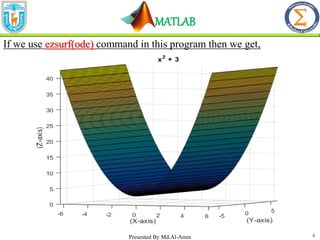
text(0,8,'(0,-4)','color','b','fontsize',13)
text(0.5,-14 ,'(-0.6,-1.7)','color','b','fontsize',13)
text(-0.6,24 ,'(-0.6,20.3)','color','b','fontsize',13)
text(-0.95,252.4920 ,'(-0.6, 252.5)','color','b','fontsize',13)
title('Solution Grpah of the given ODE')
legend('2*exp(-5*x) - 6*exp(-2*x)','Location','northeast')
Output:
The solution of given ODE
ode =
2*exp(-5*x) - 6*exp(-2*x)
Presented By Md.Al-Amin](https://image.slidesharecdn.com/solutionprocessofordinarydifferentialequationswiththeirgraphicalrepresentationandsomebasicplottingpr-230411155534-de89a47a/85/Solution-Process-of-Ordinary-Differential-Equations-with-their-Graphical-Representation-and-Some-Basic-Plotting-Process-Difference-Using-MATLAB-pptx-8-320.jpg)
![MATLAB
10
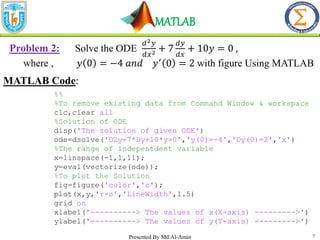
Problem 3: Solve the system of linear ODE
𝑑𝑥
𝑑𝑡
= 4𝑥 + 3𝑦,
𝑑𝑦
𝑑𝑡
=
4𝑦 − 3𝑥; 𝑤ℎ𝑒𝑟𝑒 𝑥 0 = 0 𝑎𝑛𝑑 𝑦 0 = 1 with figure using MATLAB
MATLAB Code:
%To remove existing data from Command Window &
workspace
clc,clear all
%system of ode
%for draw graph we should input conditions as then we
need to remove constant
%Denoting x and y are function of t
syms x(t) y(t)
ode1=diff(x,t)==3*x+4*y;
ode2=diff(y,t)==3*y-4*x;
cond1=x(0)==0;
cond2=y(0)==1;
cond=[cond1 cond2];
ode=[ode1 ode2];
disp('The solution of given ODE')
[x y]=dsolve(ode,cond)
Presented By Md.Al-Amin](https://image.slidesharecdn.com/solutionprocessofordinarydifferentialequationswiththeirgraphicalrepresentationandsomebasicplottingpr-230411155534-de89a47a/85/Solution-Process-of-Ordinary-Differential-Equations-with-their-Graphical-Representation-and-Some-Basic-Plotting-Process-Difference-Using-MATLAB-pptx-10-320.jpg)
![MATLAB
11
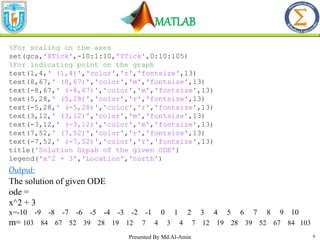
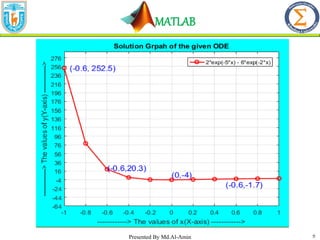
%Drawing plot
fig=figure('color','w');
fplot(x,[-1 1.5],'linewidth',1.5,'marker','o','color', 'b')
hold on
fplot(y,[-1 1.5],'linewidth',1.5,'marker','s','color','r')
hold off
grid on
set(gca,'XTick',-1:0.5:1.5,'YTick',-100:10:60)
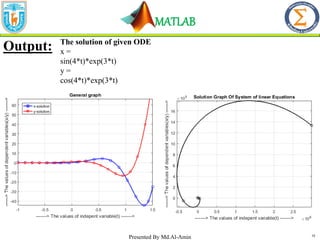
title('General graph')
xlabel('-------> The values of indepent variable(t) ------->')
ylabel('------> The values of dependent variables(x/y) ------->')
legend('x-solution','y-solution','location','northwest')
Presented By Md.Al-Amin
syms t
x=sin(4*t)*exp(3*t)
y=cos(4*t)*exp(3*t)
fplot(x,y,'color','k','linewidth',1.5,'marker','o')
grid on
xlabel('-------> The values of indepent variable(t) ------->')
ylabel('------> The values of dependent variables(x/y) ------>')
title('Solution Graph Of System of linear Equations');](https://image.slidesharecdn.com/solutionprocessofordinarydifferentialequationswiththeirgraphicalrepresentationandsomebasicplottingpr-230411155534-de89a47a/85/Solution-Process-of-Ordinary-Differential-Equations-with-their-Graphical-Representation-and-Some-Basic-Plotting-Process-Difference-Using-MATLAB-pptx-11-320.jpg)
![MATLAB
13
plot VS ezplot VS fplot
Basis For
Comparison
plot ezplot fplot
Range for
Independent
variable
Needed Not needed Not needed
By default range User defined
[-2𝜋, 2𝜋] /
[-6.2832,6.2832] [-5,5]
Validity for
“linspace”
command
Valid Not valid Not valid
In case of user
friendly
For using interval,it
is user friendly
Some limitation
exist also
User friendly from
MATLAB 2016
Execution time Most More Least
Presented By Md.Al-Amin](https://image.slidesharecdn.com/solutionprocessofordinarydifferentialequationswiththeirgraphicalrepresentationandsomebasicplottingpr-230411155534-de89a47a/85/Solution-Process-of-Ordinary-Differential-Equations-with-their-Graphical-Representation-and-Some-Basic-Plotting-Process-Difference-Using-MATLAB-pptx-13-320.jpg)
![MATLAB
15
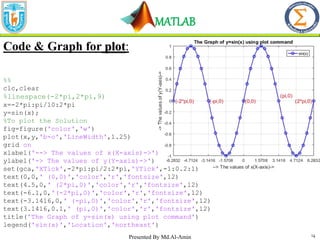
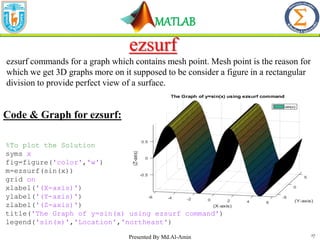
Code and Graph for ezplot :
%%
clc,clear
%To plot the Solution
syms x
fig=figure('color','w')
m=ezplot(sin(x))
set(m,'color','b','linewidth',1.5)
grid on
xlabel('-> The values of x(X-axis)->')
ylabel('-> The values of y(Y-axis)->')
axis([-2*pi 2*pi -1 1])
set(gca,'XTick',-2*pi:pi/2:2*pi,'YTick',-1:0.2:1)
text(0,0,' (0,0)','color','r','fontsize',12)
text(4.5,0,' (2*pi,0)','color','r','fontsize',12)
text(-6.1,0,'(-2*pi,0)','color','r','fontsize',12)
text(-3.1416,0,' (-pi,0)','color','r','fontsize',12)
text(3.1416,0.1,' (pi,0)','color','r','fontsize',12)
title('The Graph of y=sin(x) using ezplot command')
legend('sin(x)','Location','northeast')
Presented By Md.Al-Amin](https://image.slidesharecdn.com/solutionprocessofordinarydifferentialequationswiththeirgraphicalrepresentationandsomebasicplottingpr-230411155534-de89a47a/85/Solution-Process-of-Ordinary-Differential-Equations-with-their-Graphical-Representation-and-Some-Basic-Plotting-Process-Difference-Using-MATLAB-pptx-15-320.jpg)


The document presents a comprehensive guide on solving ordinary differential equations (ODEs) using MATLAB, showcasing various examples and their graphical representations. It covers first-order and higher-order ODE solutions, as well as systems of linear equations, while highlighting specific MATLAB commands. The document also compares different MATLAB plotting functions, such as plot, ezplot, and fplot.