Downloaded 14 times


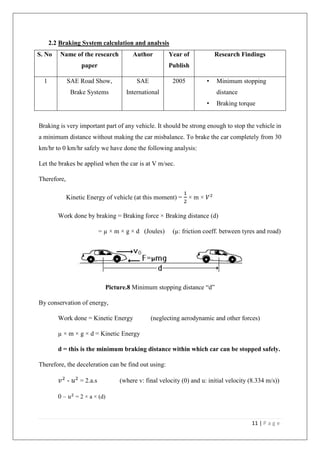
![8 | P a g e
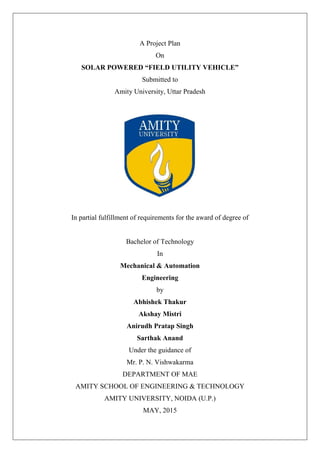
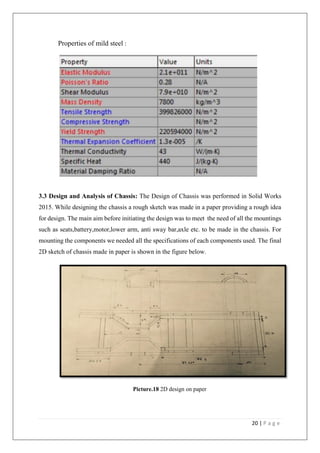
TTE [lb] = RR [lb] + GR [lb] + FA [lb]
Where:
TTE = total tractive effort [lb]
RR = force necessary to overcome rolling resistance [lb]
GR = force required to climb a grade [lb]
FA = force required to accelerate to final velocity [lb]
The components of this equation will be determined in the following steps.
Step One: Determine Rolling Resistance
Rolling Resistance (RR) is the force necessary to propel a vehicle over a particular surface.
The worst possible surface type to be encountered by the vehicle should be factored into the
equation.
RR [lb] = GVW [lb] x Crr [-]
Where:
RR = rolling resistance [lb]
GVW = gross vehicle weight [lb]
Crr = surface friction
Step Two: Determine Grade Resistance
Grade Resistance (GR) is the amount of force necessary to move a vehicle up a slope or
“grade”. This calculation must be made using the maximum angle or grade the vehicle will be
expected to climb in normal operation.
To convert incline angle, α, to grade resistance:
GR [lb] = GVW [lb] x sin (α)
Where:
GR = grade resistance [lb]
GVW = gross vehicle weight [lb]
α = maximum incline angle [degrees]
Step Three: Determine Acceleration Force
Acceleration Force (FA) is the force necessary to accelerate from a stop to maximum speed
in a desired time.
FA [lb] = GVW [lb] x 𝐕 𝐦𝐚𝐱 [ft/s] / (32.2 [ft/𝒔 𝟐
] x 𝐭 𝐚 [s])](https://image.slidesharecdn.com/finalreport-170725151554/85/Solar-Powered-Field-Utility-Vehicle-11-320.jpg)
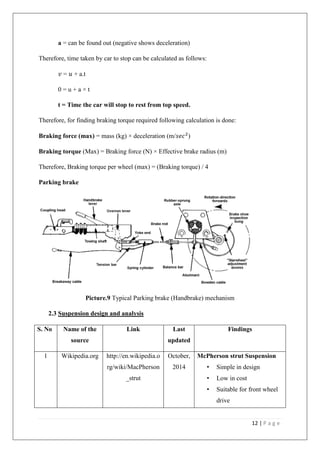
![9 | P a g e
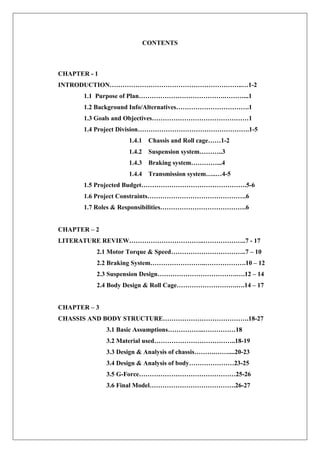
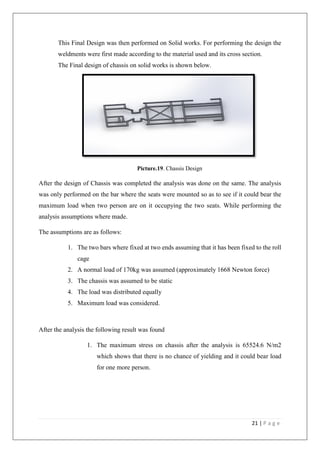
Where:
FA = acceleration force [lb]
GVW = gross vehicle weight [lb]
Vmax = maximum speed [ft/s]
ta = time required to achieve maximum speed [s]
Step Four: Determine Total Tractive Effort
The Total Tractive Effort (TTE) is the sum of the forces calculated in steps 1, 2, and 3. (On
higher speed vehicles friction in drive components may warrant the addition of 10%-15% to
the total tractive effort to ensure acceptable vehicle performance.)
TTE [lb] = RR [lb] + GR [lb] + FA [lb]
Step Five: Determine Wheel Motor Torque
To verify the vehicle will perform as designed in regards to tractive effort and acceleration, it
is necessary to calculate the required wheel torque (Tw) based on the tractive effort.
Tw [lb-in] = TTE [lb] x 𝑹 𝑾 [in] x RF [-]
Where:
Tw = wheel torque [lb-in]
TTE = total tractive effort [lb]
RW = radius of the wheel/tire [in]
RF = “resistance” factor [-] (1.1 - 1.15)
The “resistance factor” accounts for the frictional losses between the caster wheels and their
axles and the drag on the motor bearings. Typical values range between 1.1 and 1.15 (or 10 to
15%).
Step Six: Reality Check
The final step is to verify the vehicle can transmit the required torque from the drive wheel(s)
to the ground. The maximum tractive torque (MTT) a wheel can transmit is equal to the normal
load times the friction coefficient between the wheel and the ground times the radius of the
drive wheel.
MTT = 𝑾 𝑾 [lb] x μ [-] x 𝑹 𝑾
Where:
𝑊 𝑊 = weight (normal load) on drive wheel [lb]](https://image.slidesharecdn.com/finalreport-170725151554/85/Solar-Powered-Field-Utility-Vehicle-12-320.jpg)
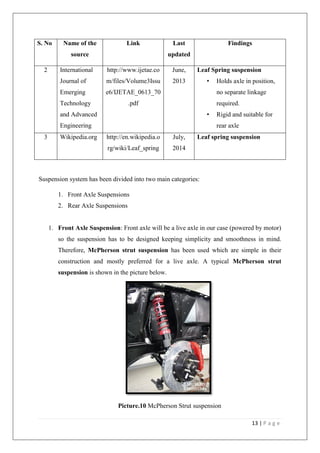
![10 | P a g e
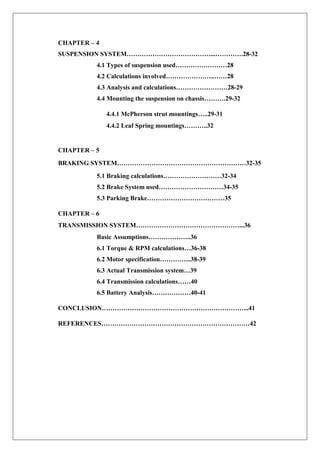
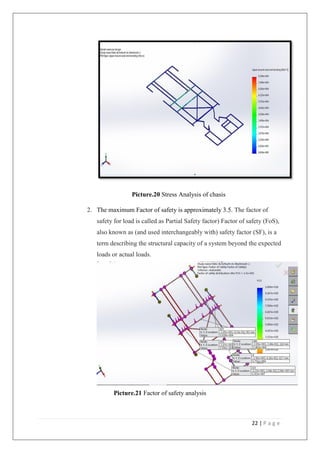
μ = friction coefficient between the wheel and the ground (~0.4 for plastic on concrete) [-]
𝑅 𝑊 = radius of drive wheel/tire [in]
Interpreting Results: Total Tractive Effort is the net horizontal force applied by the drive
wheels to the ground. If the design has two drive wheels, the force applied per drive wheel (for
straight travel) is half of the calculated TTE.
The Wheel Torque calculated in Step Five is the total wheel torque. This quantity does not
change with the number of drive wheels. The sum of the individual drive motor torques (see
Motor Specifications) must be greater than or equal to the computed Wheel Torque.
The Maximum Tractive Torque represents the maximum amount of torque that can be applied
before slipping occurs for each drive wheel. The total wheel torque calculated in Step Five
must be less than the sum of the Maximum Tractive Torques for all drive wheels or slipping
will occur.
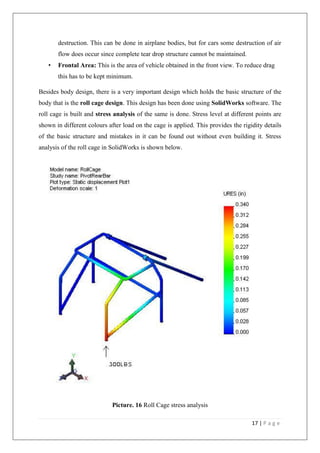
Estimating Parameters
For these calculations to be meaningful, appropriate parameters should be chosen. Typical
ranges for robot designs are provided below. Note an appropriate acceleration time must be
chosen such that the required Tw < MTT × number of drive wheels.
Picture.7 Maximum Tractive Torque curve](https://image.slidesharecdn.com/finalreport-170725151554/85/Solar-Powered-Field-Utility-Vehicle-13-320.jpg)
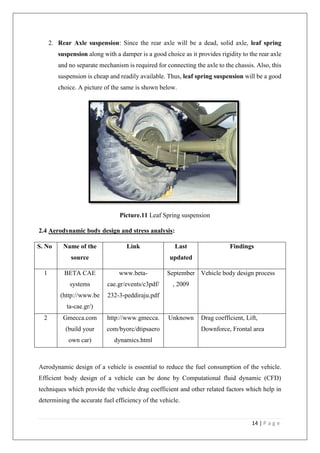

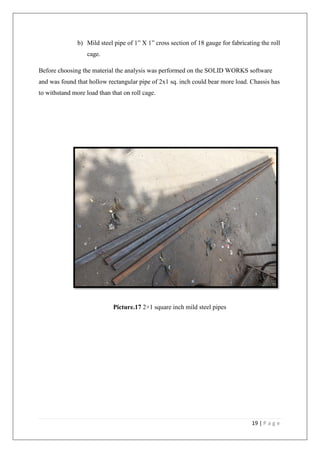
![37 | P a g e
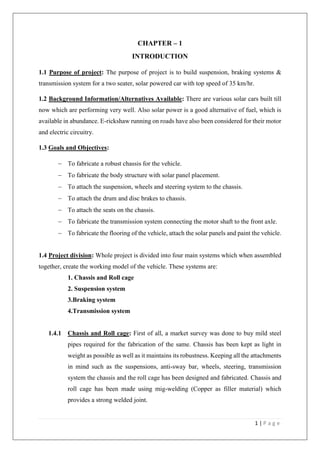
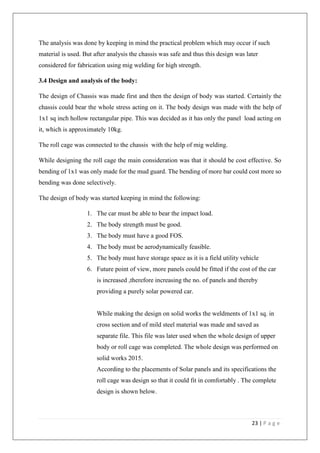
According to it, to choose a motor producing enough torque to propel the vehicle to a
desired speed we need to find the Total Tractive Effort (TTE).
TTE = Rolling Resistance (RR) + Acceleration Force (AF) [Eq. 1]
Steps to find TTE:
1. Determining Rolling Resistance (RR): This is the force required to propel the
vehicle over a flat surface.
RR = Gross vehicle weight (GVW) × Surface friction factor (𝑪 𝑹)
= 1058.22 (lb) × 0.02
= 21.164 lb (or 9.599 kg)
2. Determining Acceleration Force (AF): This is the force required to accelerate the
vehicle from stop to maximum speed in a desired time.
AF =
𝑮𝒓𝒐𝒔𝒔 𝑽𝒆𝒉𝒊𝒄𝒍𝒆 𝑾𝒆𝒊𝒈𝒉𝒕 (𝒍𝒃)× 𝑽 𝒎𝒂𝒙 (
𝒇𝒕
𝒔𝒆𝒄
)
𝟑𝟐.𝟐 (
𝒇𝒕
𝒔𝒆𝒄 𝟐)×𝒕 𝒂 (𝐬𝐞𝐜)
=
1058.22 × 27.34
32.2 × 15
= 59.90 lb (or 27.17 kg)
3. Determining Total Tractive Effort (TTE): Using equation 1,
TTE = RR + AF
= 21.164 + 59.9
= 81.64 lb (or 36.77 kg)
4. Determining Wheel Motor Torque (𝐓 𝐰): Based on total tractive effort, wheel torque
can be found out.
𝐓 𝐰 [lb-inch] = TTE × Radii of wheel (𝑹 𝒘) × Resistance Factor (RF)
= 81.064 (lb) × 8 (inch) × 1.1
= 713.36 lb-inch (or 80.59 Nm)
Tw (per wheel) =
713.36
2
= 356.68 lb-inch (or 40.295 Nm)
5. Reality Check: Final step is to verify that vehicle can transmit the required torque to
the ground without slipping or not. For this, the wheel motor torque, Tw (per wheel)
should be less than the Maximum Tractive Effort (MTE) calculated below.
MTE = Weight on each wheel × coefficient of friction (µ) × Radii of wheel](https://image.slidesharecdn.com/finalreport-170725151554/85/Solar-Powered-Field-Utility-Vehicle-40-320.jpg)
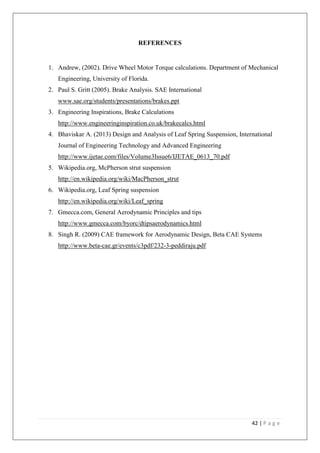

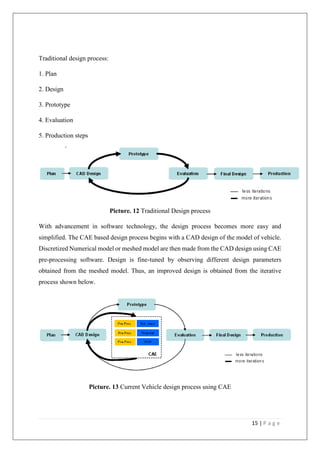
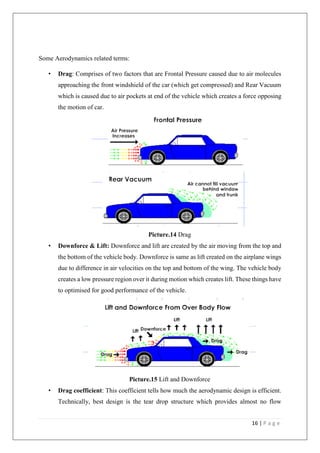
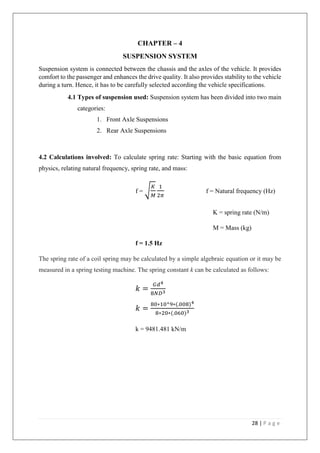
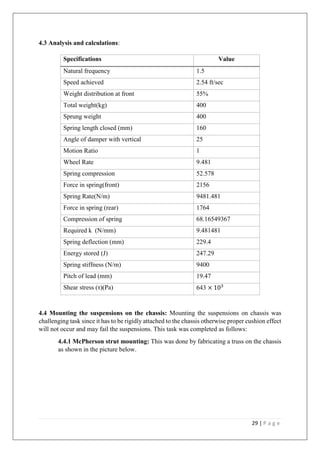
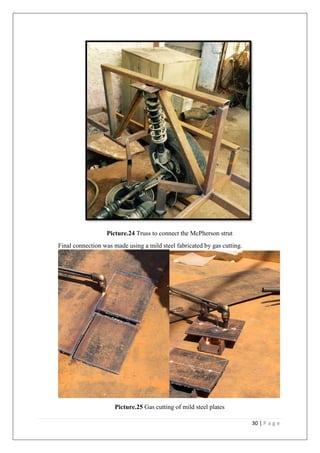
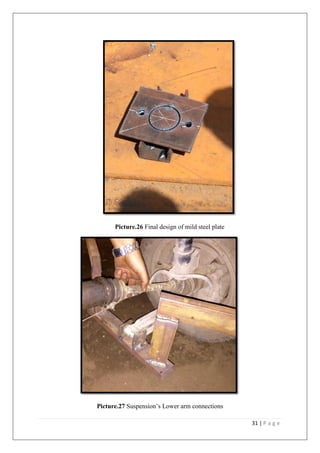
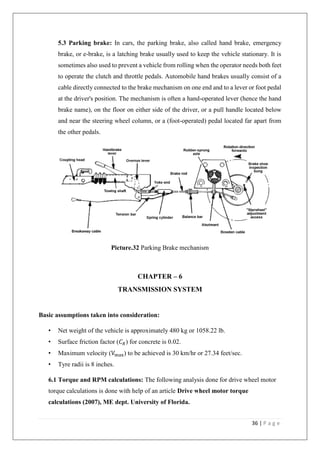
The project plan outlines the development of a two-seater solar-powered field utility vehicle, detailing its purpose, goals, and major components, including the chassis, suspension, braking, and transmission systems. A budget of INR 78,000 is projected for materials and construction, and various literature reviews on motor torque, suspension design, and braking systems are included to support the design choices. Each project phase involves specific calculations and analyses to ensure functionality and safety standards are met.