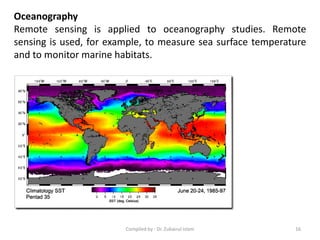
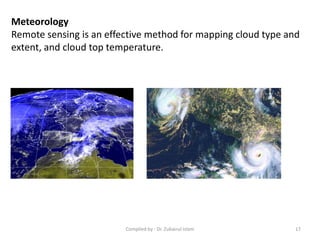
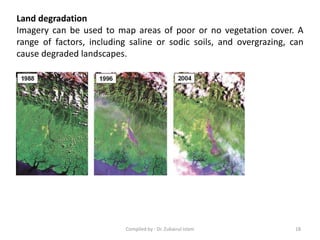
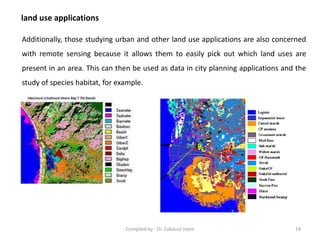
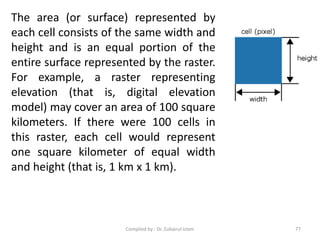
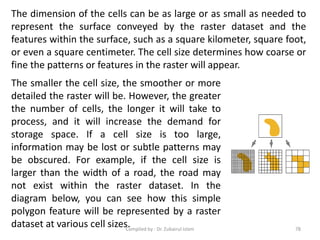
Downloaded 212 times
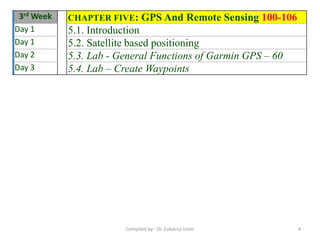
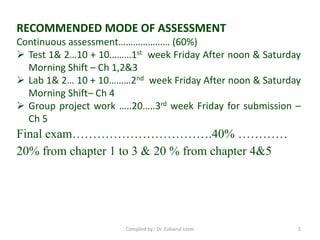
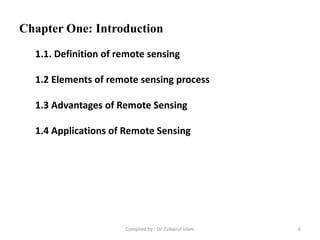
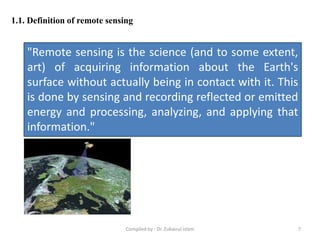

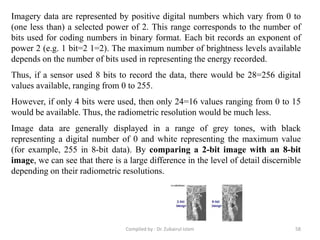


The document provides details about a course on fundamentals of remote sensing, including: - The course code, module name and code, university, and department offering the course. - An outline of the course content and schedule, divided into 3 weeks covering topics like introduction to remote sensing, electromagnetic energy and remote sensing, satellites and image characteristics, and GPS. - Recommended assessments including tests, lab exercises, and a group project to evaluate students' understanding of the material.


