![3
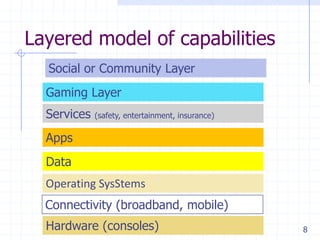
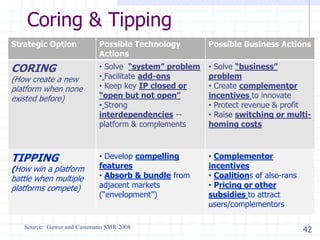
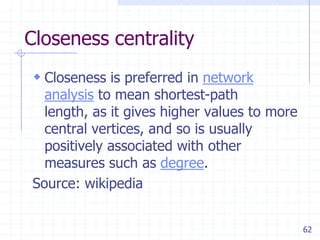
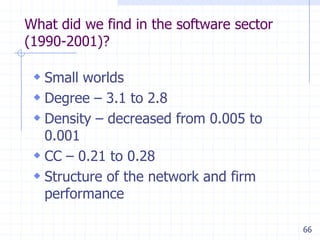
Ecosystem
Loose networks – of suppliers, distributors,
outsourcing firms, makers of related products or
services, technology providers, and a host of other
organizations – that affect, and are affected by the
creation and delivery of a company’s own
offerings. [Marco Iansiti]
An economic community supported by a
foundation of interacting organizations and
individuals—the organisms of the business world.
The economic community produces goods and
services of value to customers, who are themselves
members of the ecosystem [James Moore]](https://image.slidesharecdn.com/ecosystemvisualizationmethodology-140404074050-phpapp01/85/Understanding-Software-Ecosystems-3-320.jpg)
![4
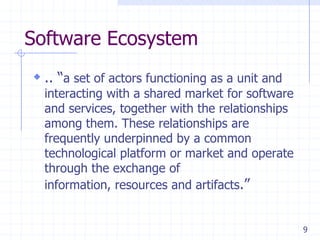
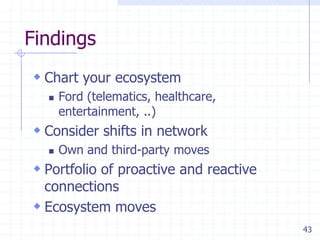
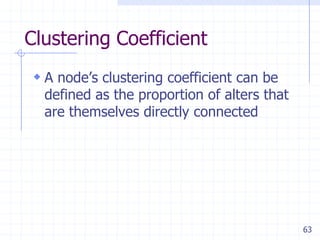
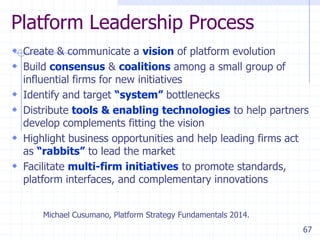
Creating Awesome Users
Don't make a better [X], make a better
[user of X].
Kathy Sierra
Think about how customers experience
the product or service](https://image.slidesharecdn.com/ecosystemvisualizationmethodology-140404074050-phpapp01/85/Understanding-Software-Ecosystems-4-320.jpg)
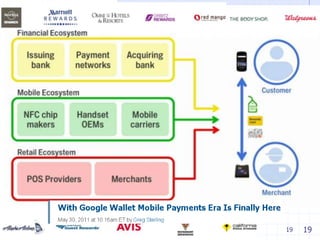
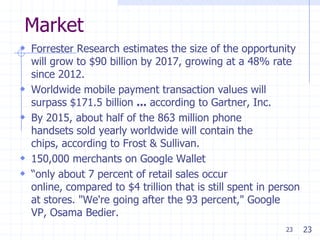
![5
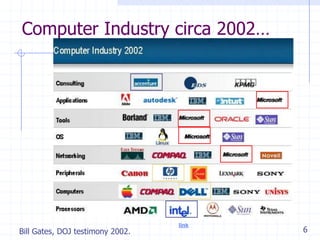
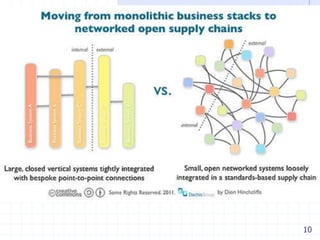
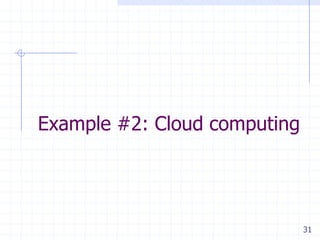
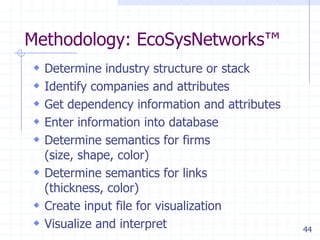
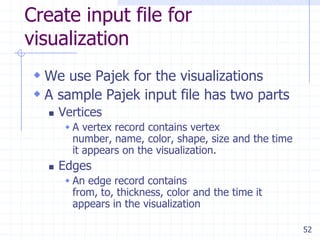
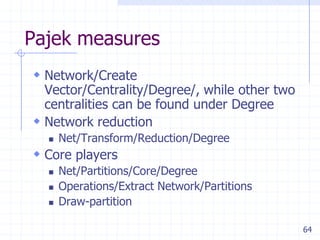
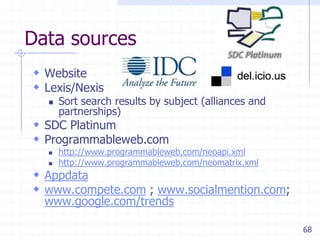
Computer Industry [circa 1980s…]
Source: Bill Gates Testimony - link
Bill Gates, DOJ testimony 2002.](https://image.slidesharecdn.com/ecosystemvisualizationmethodology-140404074050-phpapp01/85/Understanding-Software-Ecosystems-5-320.jpg)

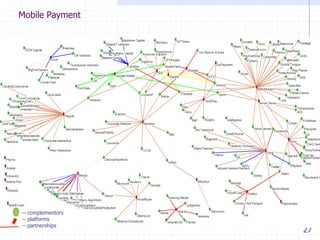
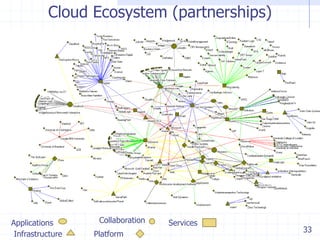
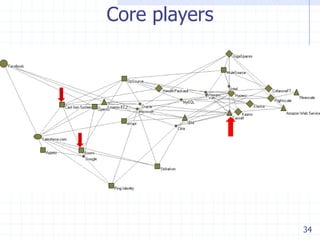

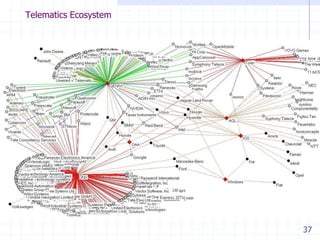
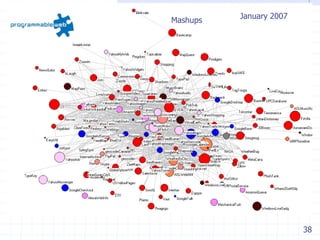
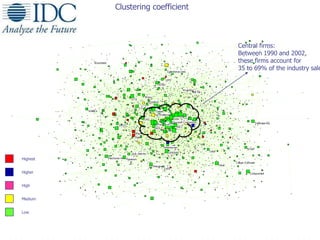
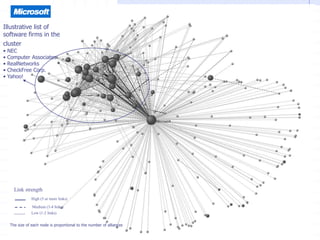
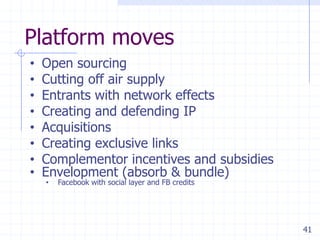
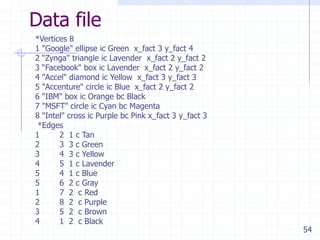
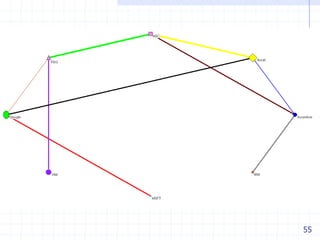
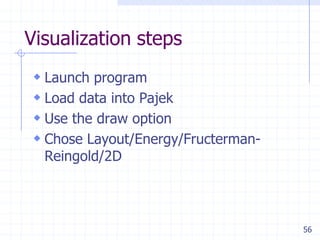

This document provides an overview of visualizing software ecosystems. It begins with an agenda and definitions of ecosystems and industry platforms. Examples of mobile payment, cloud computing, and telematics ecosystems are described. The methodology used to generate ecosystem visualizations is explained, including identifying companies, relationships, and attributes. Semantics are assigned to visualize firms by size, shape and color and relationships by thickness and color. The document concludes with findings on charting your own ecosystem and considering strategic moves.