![Ecosystem
Loose networks – of suppliers, distributors,
outsourcing firms, makers of related products or
services, technology providers, and a host of other
organizations – that affect, and are affected by the
creation and delivery of a company’s own
offerings. [Marco Iansiti]
An economic community supported by a
foundation of interacting organizations and
individuals—the organisms of the business world.
The economic community produces goods and
services of value to customers, who are themselves
members of the ecosystem [James Moore]
4 4](https://image.slidesharecdn.com/ecosystemvisualizationmethodology-120617204717-phpapp01/85/Ecosystem-visualization-methodology-4-320.jpg)


![Ecosystem risks [Ron Adner]
Co-innovation risk: Seeing the Real
Odds When You Don’t Innovate Alone
Adoption Chain Risk: Seeing All th e
Customers Before Your End Customer
40](https://image.slidesharecdn.com/ecosystemvisualizationmethodology-120617204717-phpapp01/85/Ecosystem-visualization-methodology-40-320.jpg)

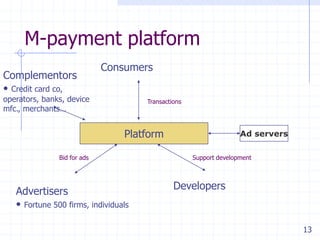
![Platform
A business platform is a set of capabilities used by multiple
parties that
A product or service should perform at least one essential
function within what can be described as a ―system of use‖
or solve an essential technological problem within an
industry, and
It should be easy to connect to or build upon to expand the
system of use as well as to allow new and even unintended
end-uses [Platform Leaders by Gawer and Cusumano, MIT
Sloan Management Review, Winter 2008]
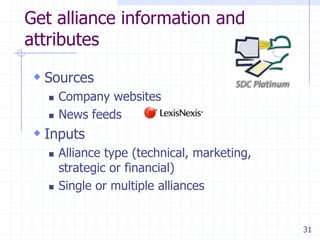
Has ―options‖ value
Creates Network Effects
Has explicit Architectural Control Points
45 45](https://image.slidesharecdn.com/ecosystemvisualizationmethodology-120617204717-phpapp01/85/Ecosystem-visualization-methodology-45-320.jpg)

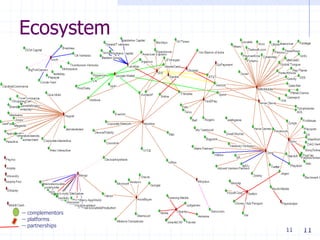
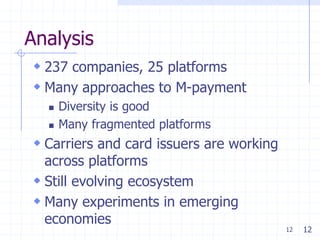
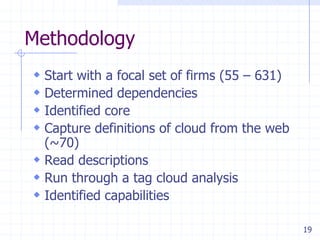
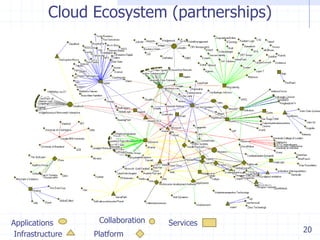
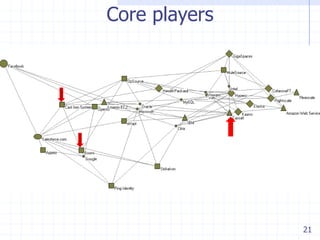
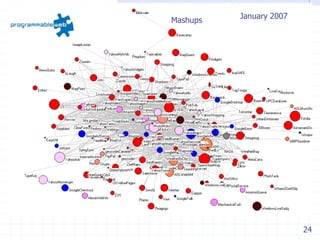
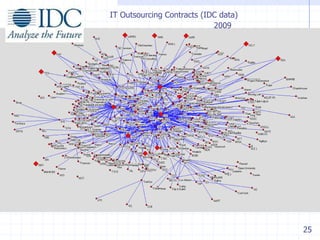
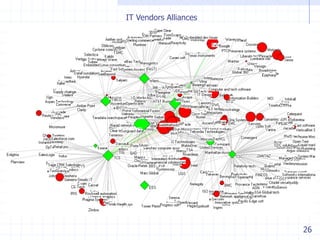
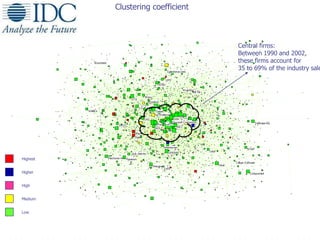
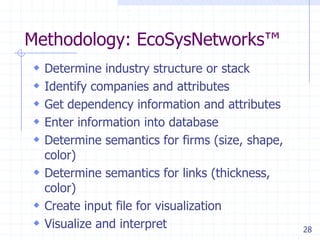
The document discusses visualizing ecosystems through network analysis. It provides examples of visualizing the mobile payments ecosystem and cloud computing ecosystem. It outlines the methodology used, which involves identifying companies and relationships, entering data into a database, defining visualization semantics, generating input files, and visualizing the networks. Key lessons discussed include identifying core players, network effects, and risks. Future directions proposed are developing decision environments for automated data collection and collaboration.


![Idea[1]generation.ppt](https://cdn.slidesharecdn.com/ss_thumbnails/idea1generation-ppt-130309092906-phpapp01-thumbnail.jpg?width=640&height=640&fit=bounds)


