Download as PDF, PPTX


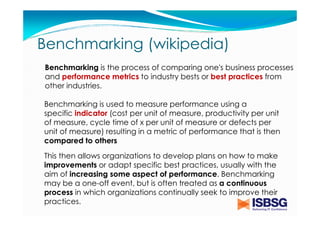

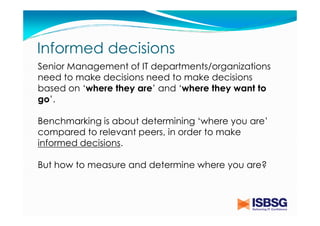
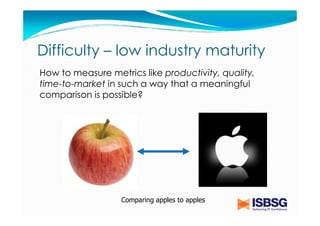

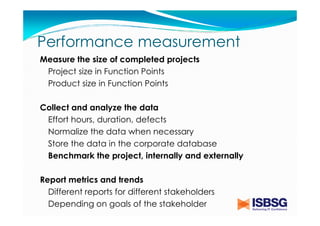
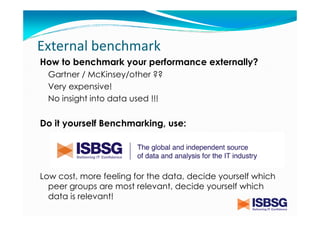
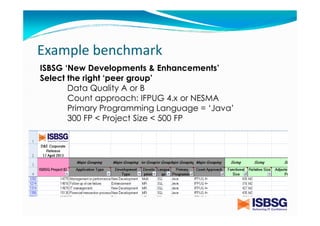
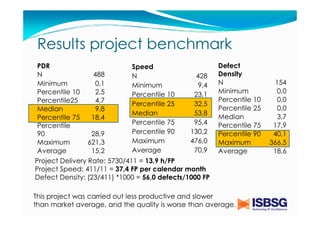

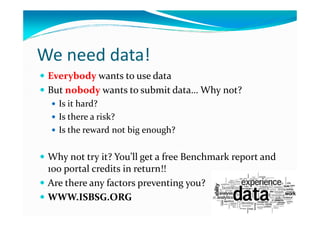


The document discusses the importance of benchmarking in the software project industry, emphasizing how organizations can compare their performance metrics to industry standards to improve productivity and competitiveness. It outlines various metrics, including functional size measurement using function points, and explains the benefits of using historical data for benchmarking purposes. The text highlights challenges in performance measurement and the significance of knowing one's current standing in relation to peers for informed decision-making.