Downloaded 49 times


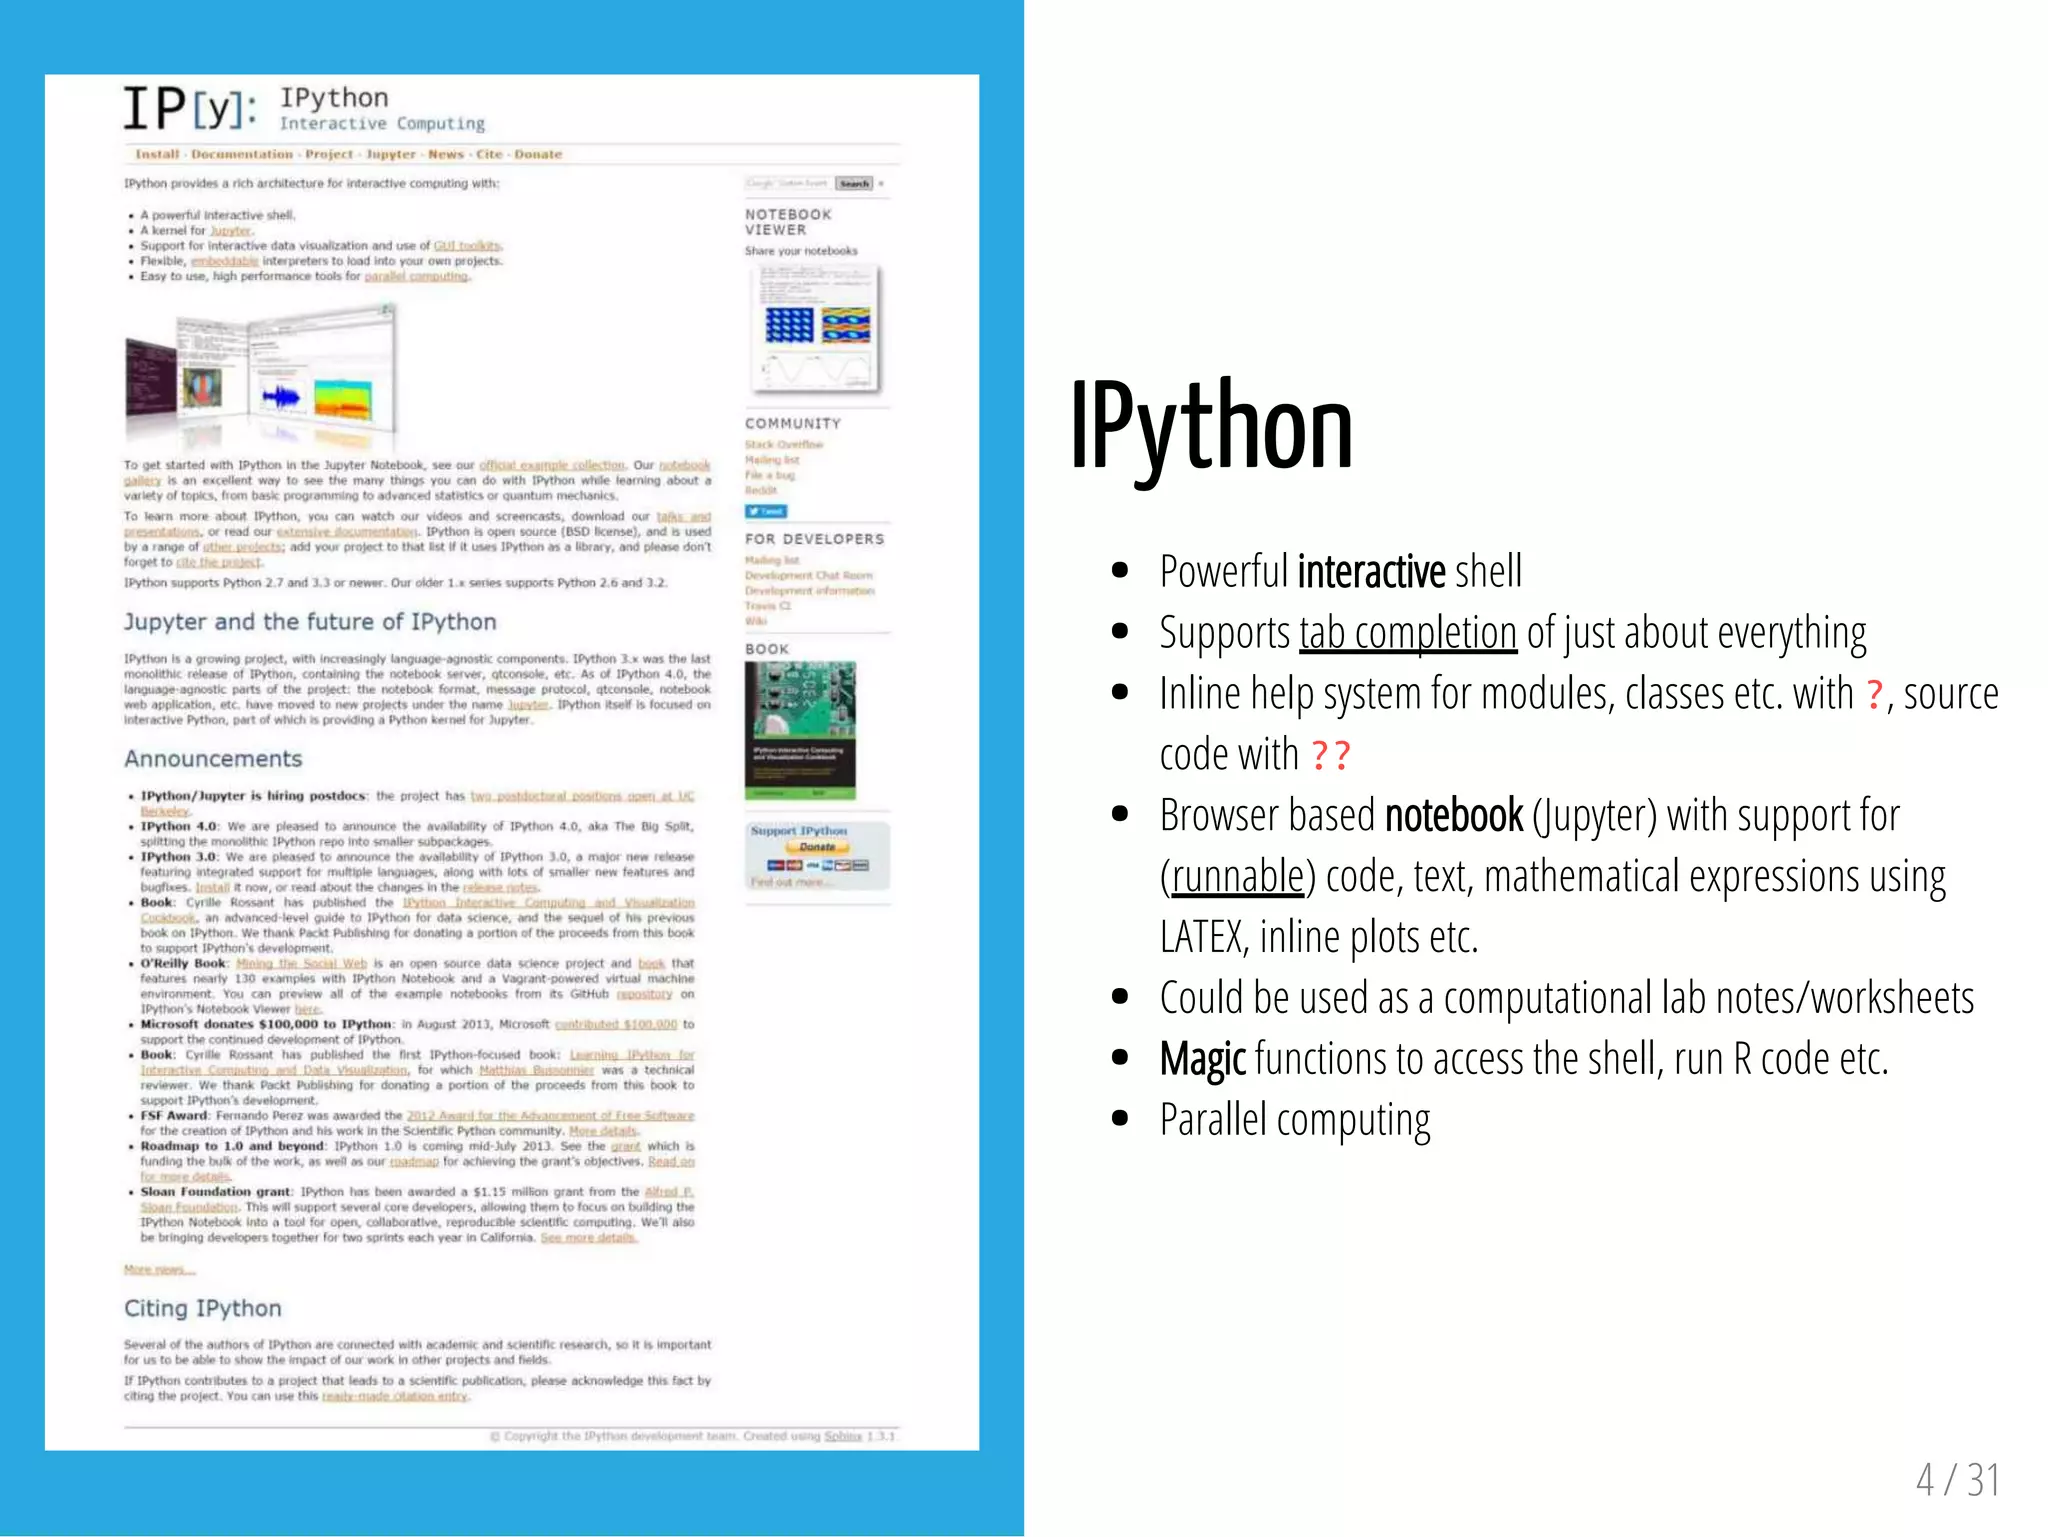


![importnumpyasnp
a=np.array([1,2,3]) #Createarank1array
printtype(a) #Prints"<type'numpy.ndarray'>"
printa.shape #Prints"(3,)"
printa[0],a[1],a[2] #Prints"123"
a[0]=5 #Changeanelementofthearray
printa #Prints"[5,2,3]"
b=np.array([[1,2,3],[4,5,6]]) #Createarank2array
printb.shape #Prints"(2,3)"
printb[0,0],b[0,1],b[1,0] #Prints"124"
#-----
a=np.zeros((2,2)) #Createanarrayofallzeros
printa #Prints"[[0. 0.]
# [0. 0.]]"
b=np.ones((1,2)) #Createanarrayofallones
printb #Prints"[[1. 1.]]"
c=np.full((2,2),7)#Createaconstantarray
printc #Prints"[[7. 7.]
# [7. 7.]]"
d=np.eye(2) #Createa2x2identitymatrix
printd #Prints"[[1. 0.]
# [0. 1.]]"
e=np.random.random((2,2))#Createanarrayfilledwithrandomvalues
printe #Mightprint"[[0.91940167 0.08143941]
# [0.68744134 0.87236687]]"
Numpy
Numpy is the core library for scientific computing in Python. It
provides a high-performance multidimensional array object
(MATLAB style), and tools for working with these arrays.
Arrays
A numpy array is a grid of values, all of the same type, and
is indexed by a tuple of nonnegative integers.
The number of dimensions is the rank of the array; the
shape of an array is a tuple of integers giving the size of
the array along each dimension.
We can initialize numpy arrays from nested Python lists,
and access elements using square brackets.
Numpy also provides many functions to create arrays.
9 / 31](https://image.slidesharecdn.com/scientific-python-151121091532-lva1-app6892/75/Scientific-Python-9-2048.jpg)


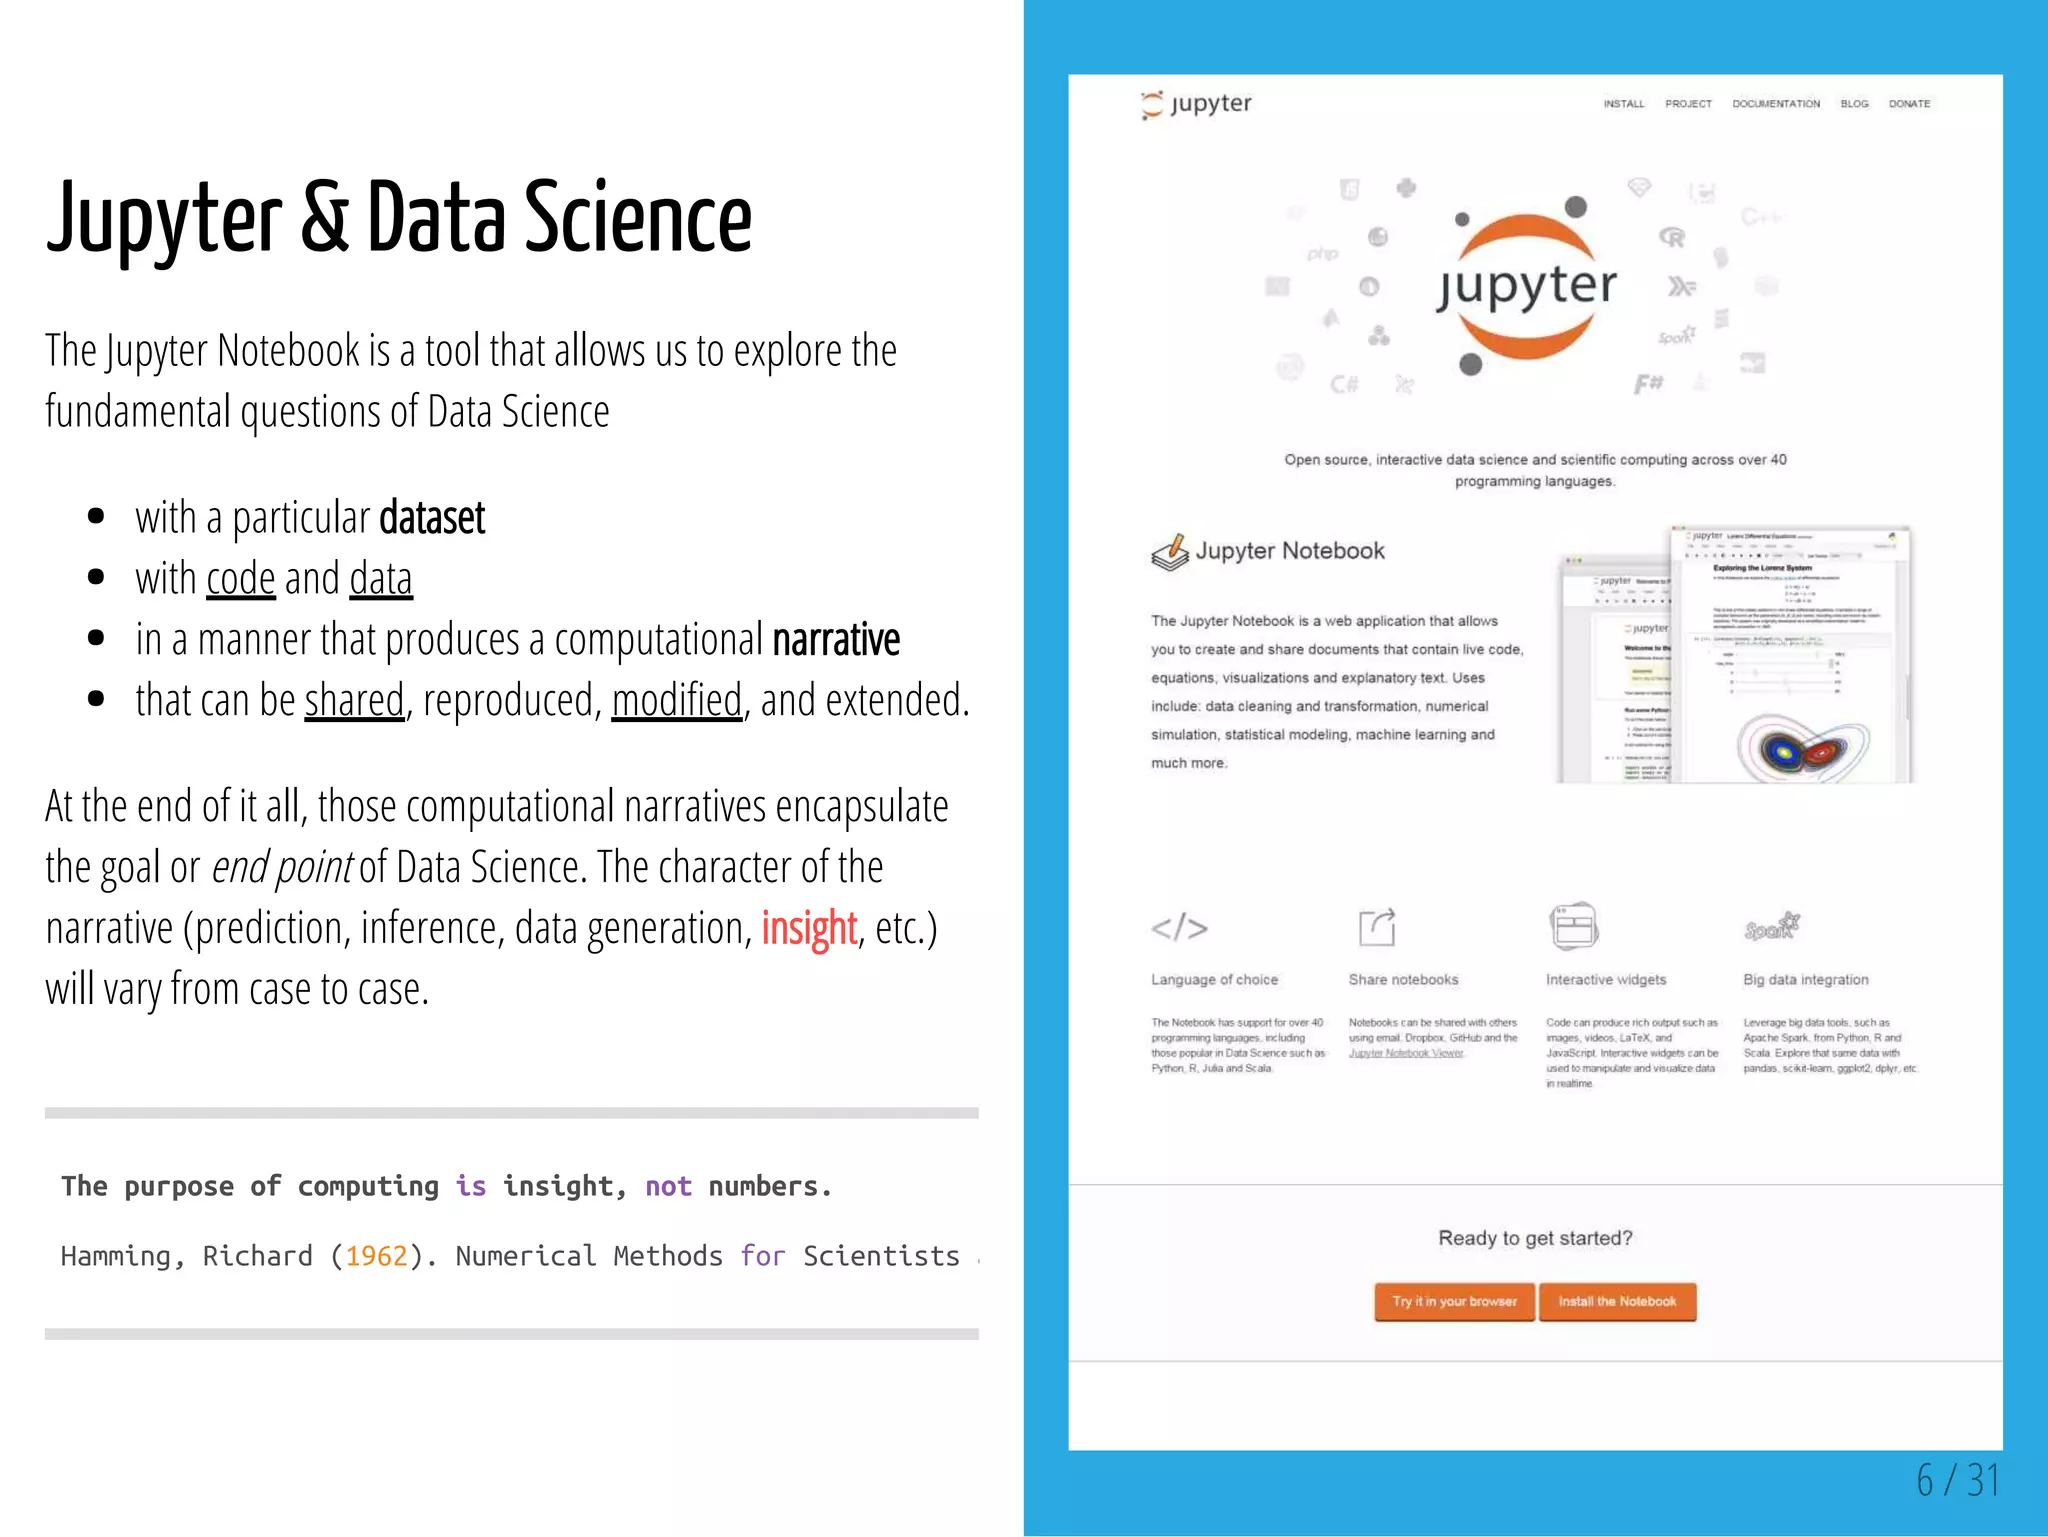
![importnumpyasnp
importmatplotlib.pyplotasplt
#Computethexandycoordinatesforpointsonasinecurve
x=np.arange(0,3*np.pi,0.1)
y=np.sin(x)
#Plotthepointsusingmatplotlib
plt.plot(x,y)
plt.show() #Youmustcallplt.show()tomakegraphicsappear.
importnumpyasnp
importmatplotlib.pyplotasplt
#Computethexandycoordinatesforpointsonsineandcosinecurves
x=np.arange(0,3*np.pi,0.1)
y_sin=np.sin(x)
y_cos=np.cos(x)
#Plotthepointsusingmatplotlib
plt.plot(x,y_sin)
plt.plot(x,y_cos)
plt.xlabel('xaxislabel')
plt.ylabel('yaxislabel')
plt.title('SineandCosine')
plt.legend(['Sine','Cosine'])
plt.show()
matplotlib
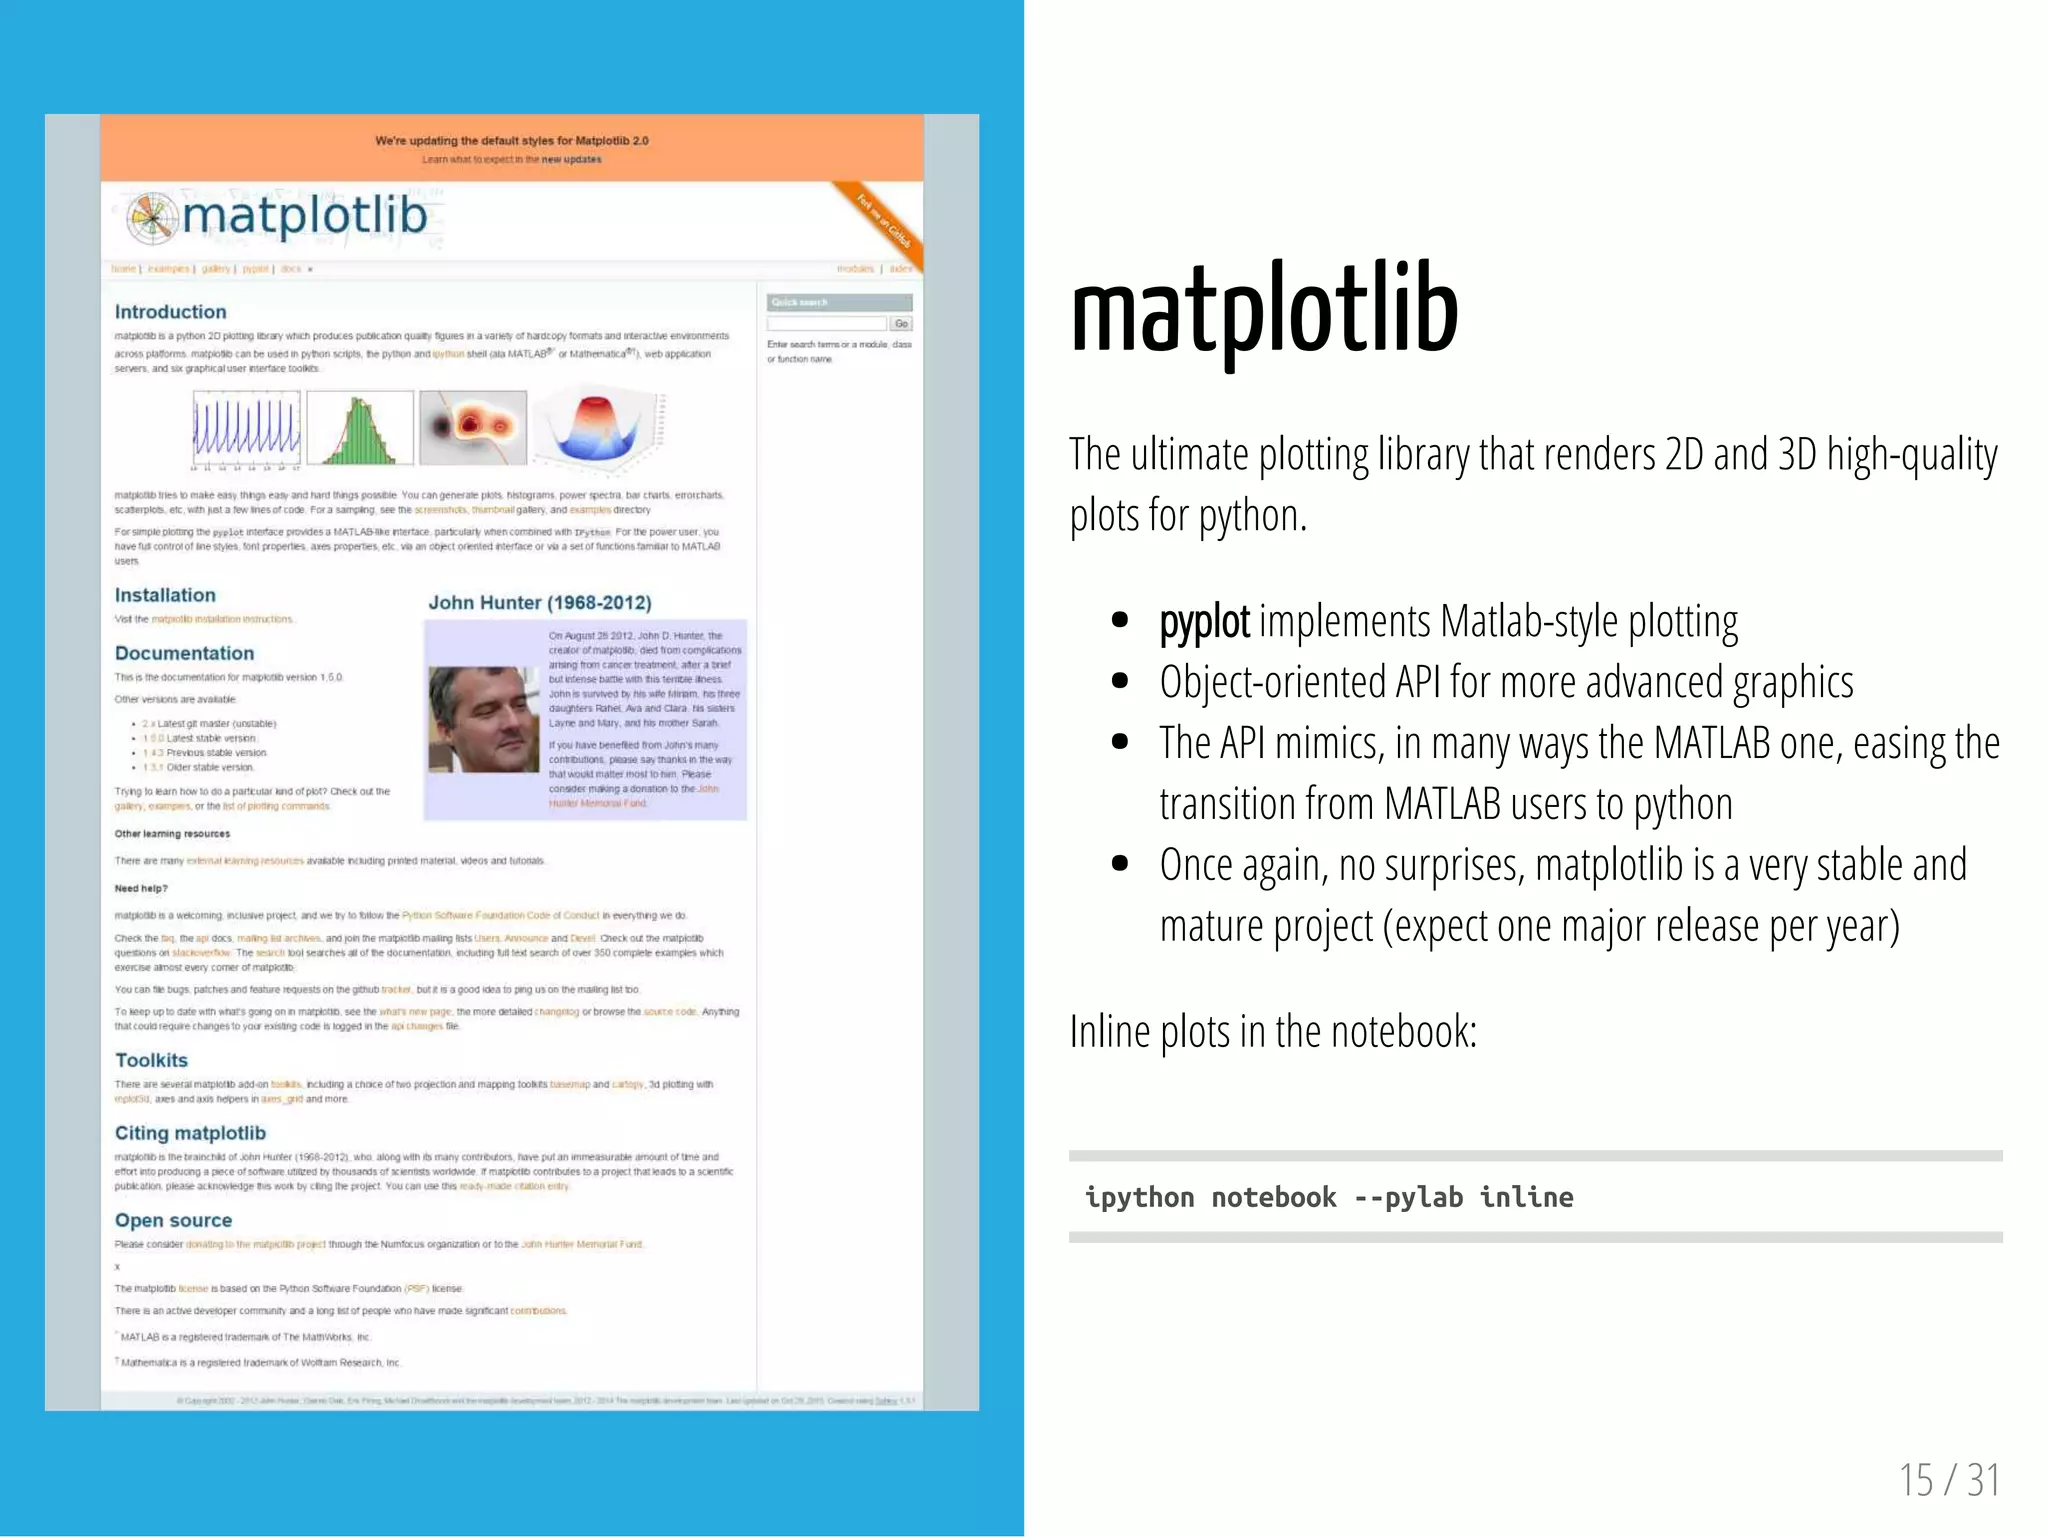
matplotlib tries to make easy things easy and hard things
possible. You can generate plots, histograms, power spectra,
bar charts, errorcharts, scatterplots, etc, with just a few lines of
code.
For simple plotting the pyplot interface provides a MATLAB-like
interface, particularly when combined with IPython. For the
power user, you have full control of line styles, font properties,
axes properties, etc, via an object oriented interface or via a set
of functions familiar to MATLAB users.
With just a little bit of extra work we can easily plot a more
complex chart e.g. multiple lines at once, and add a title,
legend, and axis labels.
16 / 31](https://image.slidesharecdn.com/scientific-python-151121091532-lva1-app6892/75/Scientific-Python-16-2048.jpg)

![importpandasaspd
importnumpyasnp
importmatplotlib.pyplotasplt
s=pd.Series([1,3,5,np.nan,6,8])
dates=pd.date_range('20130101',periods=6)
df=pd.DataFrame(np.random.randn(6,4),index=dates,columns=list(
df2=pd.DataFrame({'A':1.,
'B':pd.Timestamp('20130102'),
'C':pd.Series(1,index=list(range(4)),dtype=
'D':np.array([3]*4,dtype='int32'),
'E':pd.Categorical(["test","train","test"
'F':'foo'})
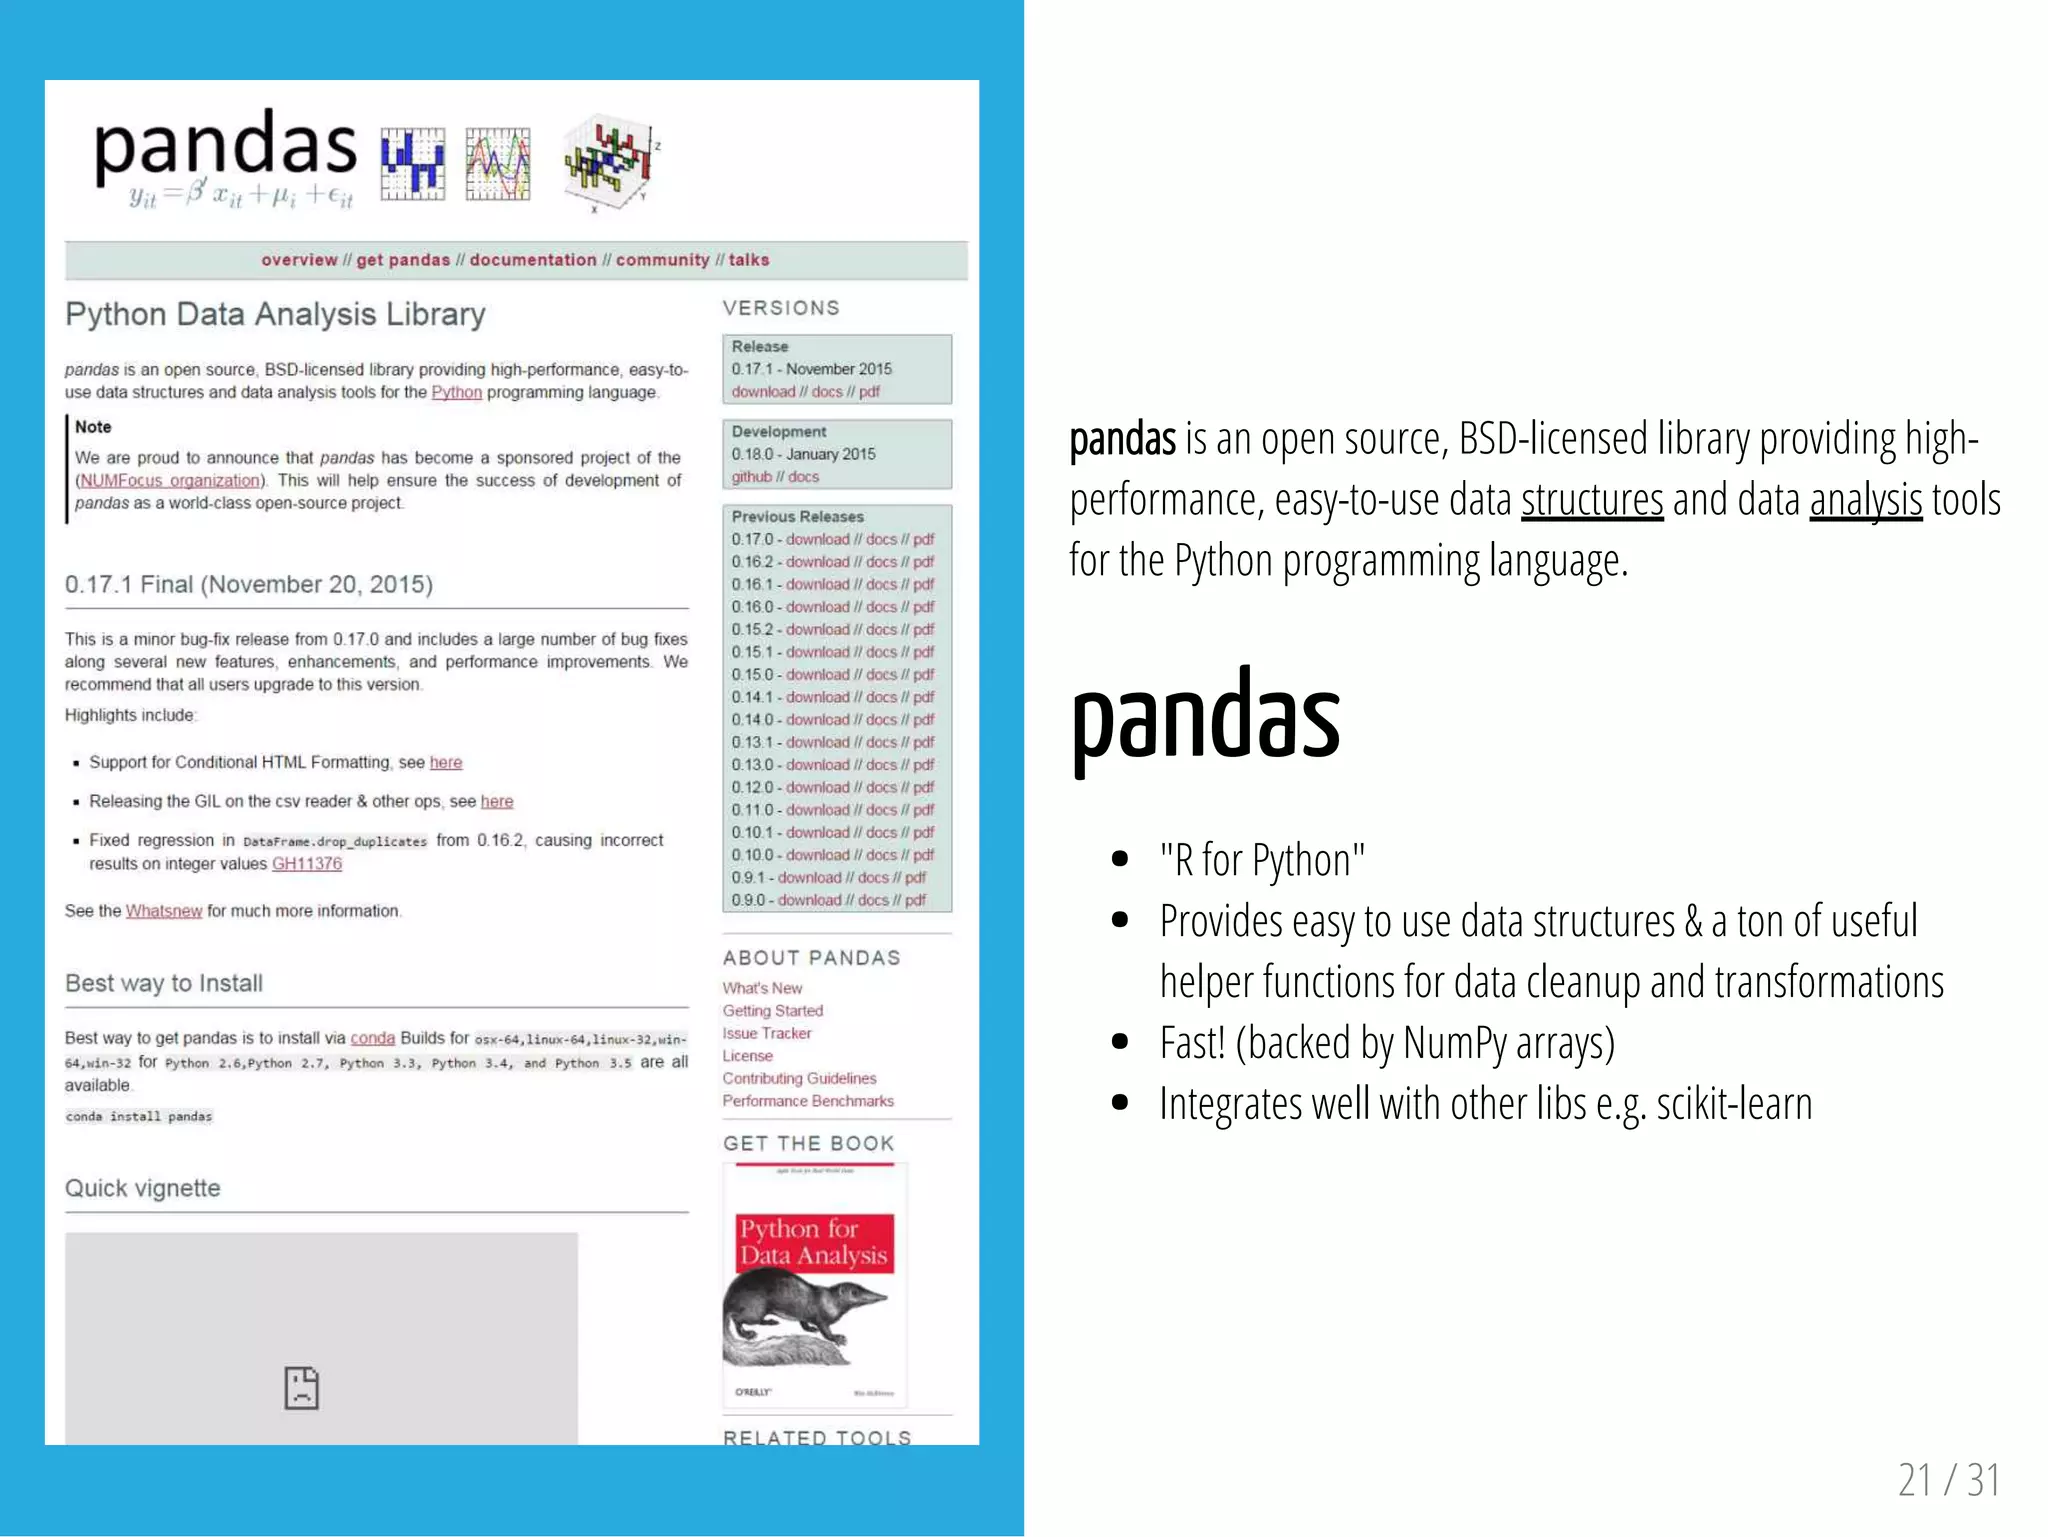
pandas
pandas provides the DataFrameclass, which is very
similar to a data.framein R
Built on top of NumPy arrays, and allows mixed column
types
Copes well with missing values (unlike NumPy)
Intelligently matches on columns/indices (supports SQL-
like joins etc.)
Read and write .csv, .xls, HTML tables etc.
Lots of useful data analysis tools built in
22 / 31](https://image.slidesharecdn.com/scientific-python-151121091532-lva1-app6892/75/Scientific-Python-22-2048.jpg)


![scikit-learn
Machine Learning algorithms implemented in Python on
top of NumPy & SciPy
Conveniently maintains the same interface to a wide
range of algorithms
Includes algorithms for: Classification, Regression,
Clustering, Dimensionality reduction
As well as lots of useful utilities (cross-validation,
preprocessing etc.)
fromsklearnimportdatasets
iris=datasets.load_iris()
digits=datasets.load_digits()
print(digits.data)
digits.target
digits.images[0]
fromsklearnimportsvm
clf=svm.SVC(gamma=0.001,C=100.)
clf.fit(digits.data[:-1],digits.target[:-1])
26 / 31](https://image.slidesharecdn.com/scientific-python-151121091532-lva1-app6892/75/Scientific-Python-26-2048.jpg)

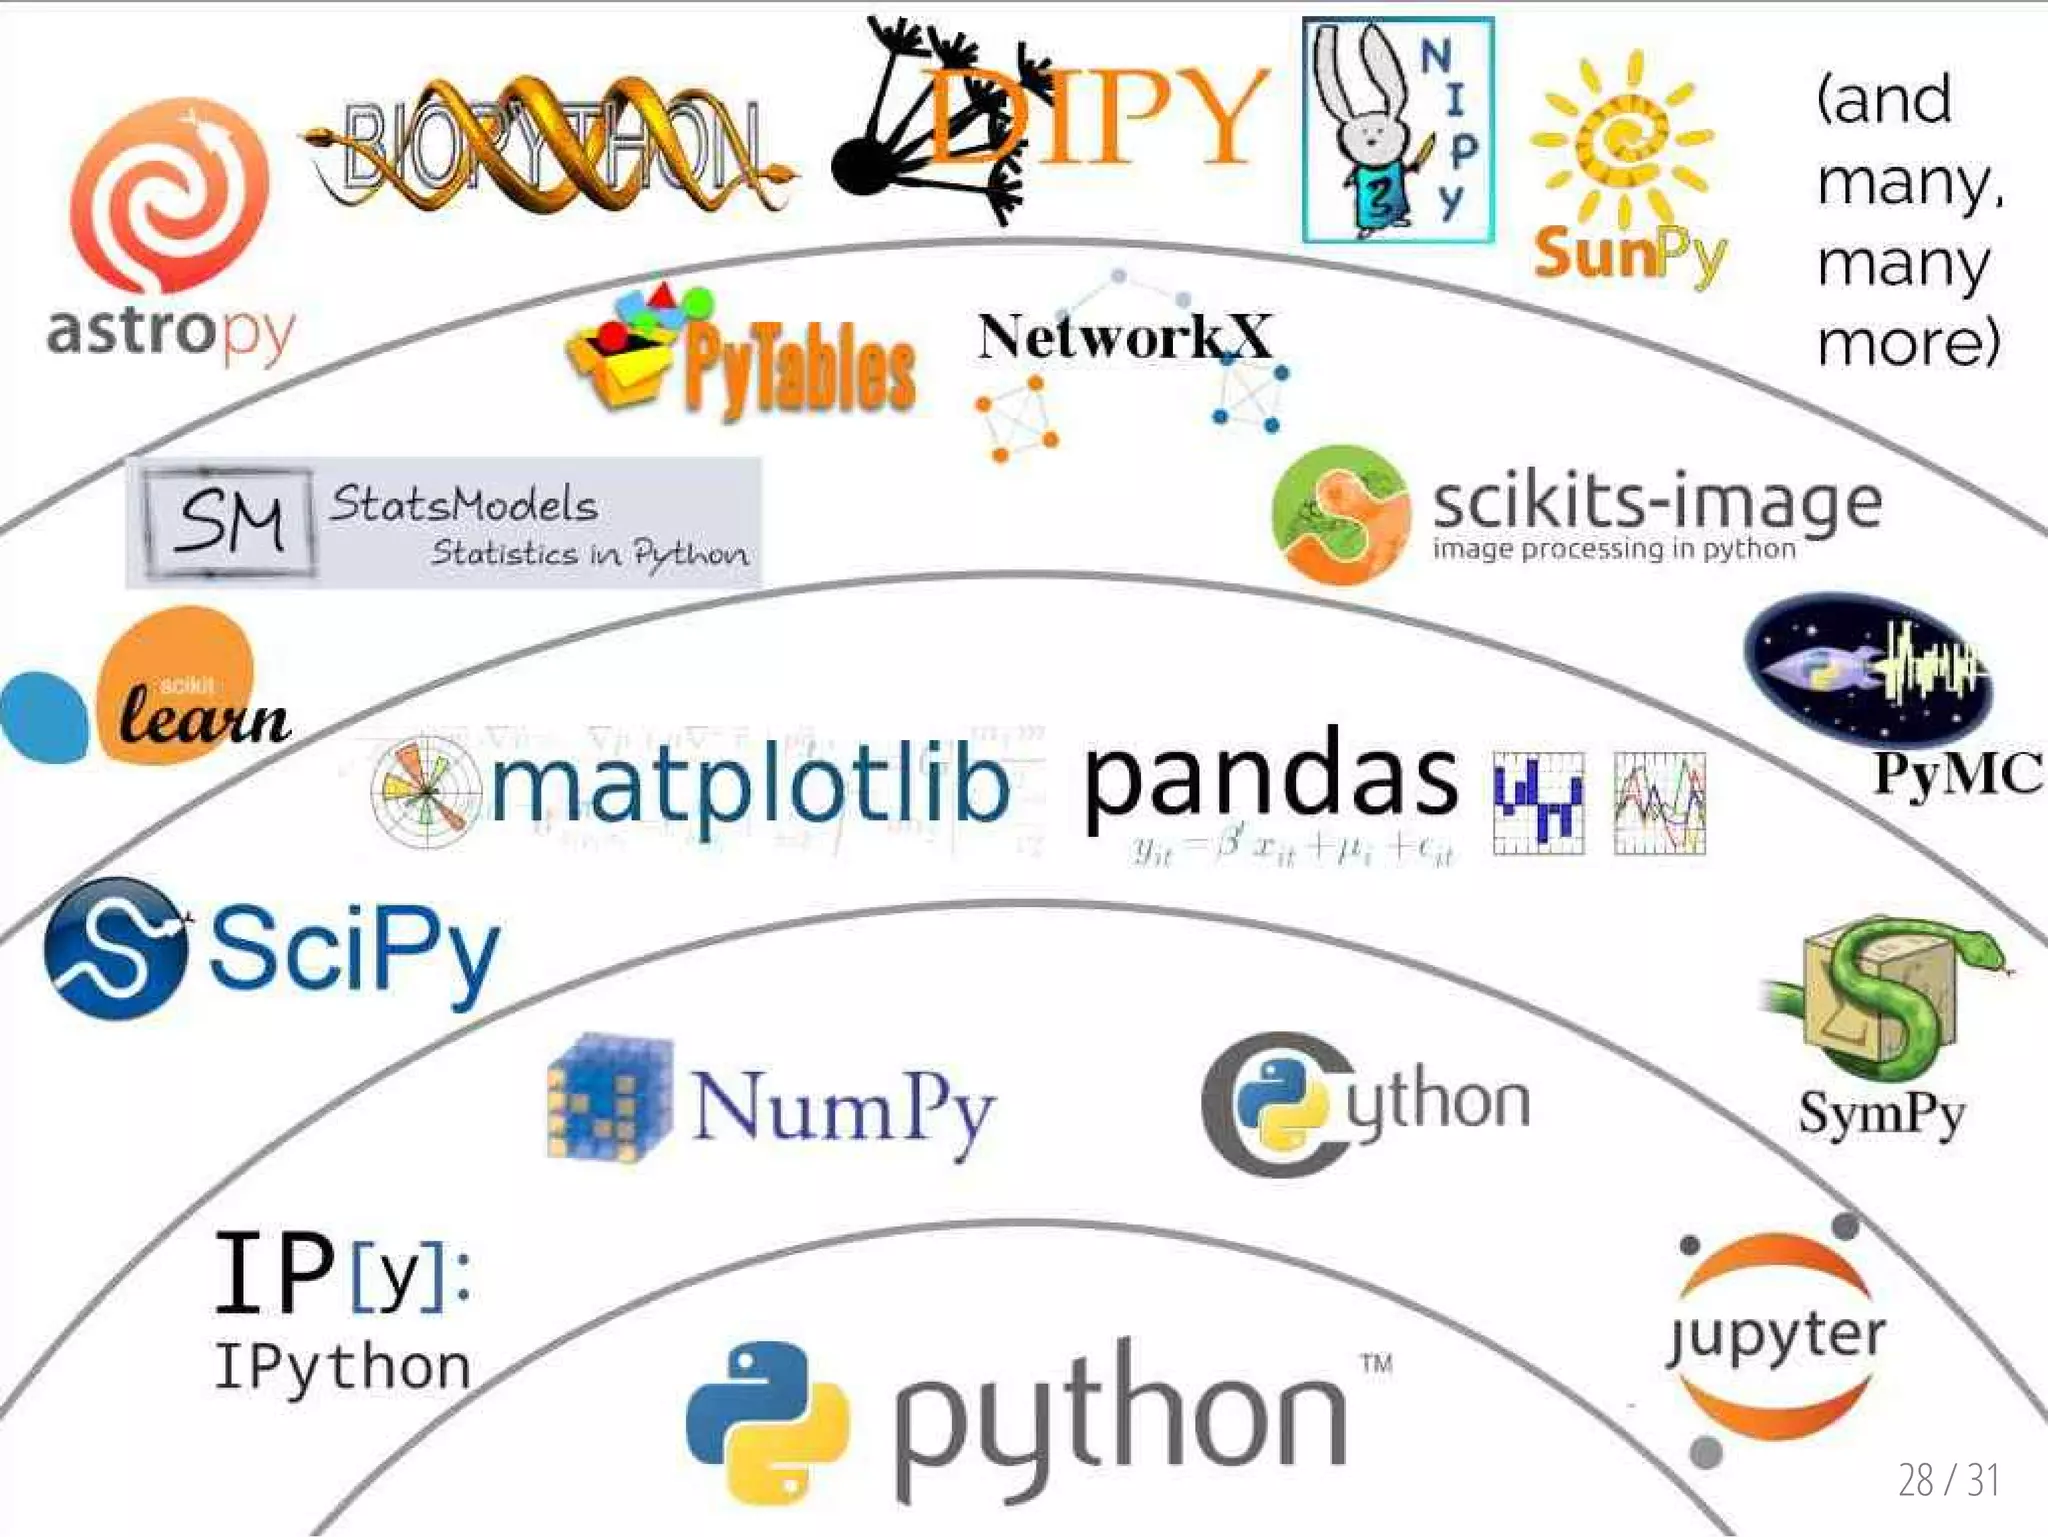


This document provides an overview and introduction to key Python packages for scientific computing and data science. It discusses Jupyter notebooks for interactive coding and visualization, NumPy for N-dimensional arrays and math operations, SciPy for scientific computing functions, matplotlib for plotting, and pandas for working with labeled data structures. The document emphasizes that NumPy provides foundational N-dimensional arrays, SciPy builds on this with additional mathematical and scientific routines, and matplotlib and pandas complement these with visualization and labeled data functionality.


![Number_Guessing_Game_Dsbsbssbzboc[1].pptx](https://cdn.slidesharecdn.com/ss_thumbnails/numberguessinggamedoc1-251206215042-a076fc05-thumbnail.jpg?width=640&height=640&fit=bounds)


