
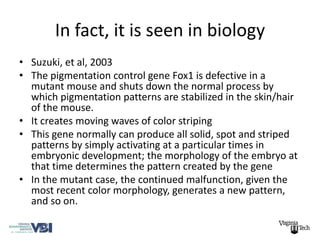
![What is interaction? What’s the issue?
• A finite undirected graph Y
• A sequence of local maps
• An ordering of the vertex set of Y
[FY,p] = P Fp(i)](https://image.slidesharecdn.com/wollongong-2012-120925215855-phpapp01/85/SMART-Seminar-Massively-Interacting-Systems-3-320.jpg)
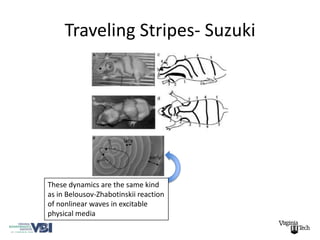
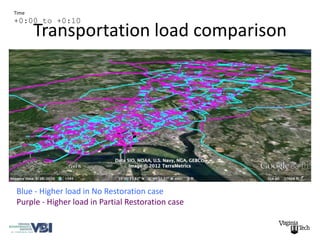
![“Genuine” social entities & interactions
“ .. [usual causal] hierarchy collapses when
causality crosses across units and
levels….human behavior in social setting is
interdependent …. although … not a new
insight, social life is interdependent in …
spatial forms – things “go together” in and
across distinct places …. which might be better
described as neighborhood causal
processes…”
Robert J. Sampson, The Great American City, 2012](https://image.slidesharecdn.com/wollongong-2012-120925215855-phpapp01/85/SMART-Seminar-Massively-Interacting-Systems-5-320.jpg)
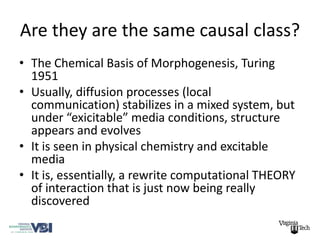

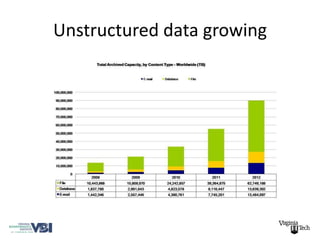
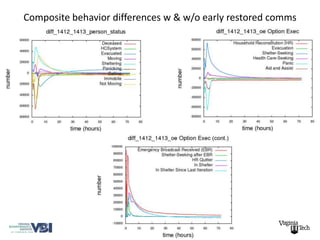
![What is Big?
• The world's technological per-capita capacity
to store information has roughly doubled
every 40 months since the 1980s; as of
2012, every day 2.5 quintillion (2.5×10¹⁸)
bytes of data were created [stored].
Wikipedia, “Big Data”, August 2012](https://image.slidesharecdn.com/wollongong-2012-120925215855-phpapp01/85/SMART-Seminar-Massively-Interacting-Systems-17-320.jpg)

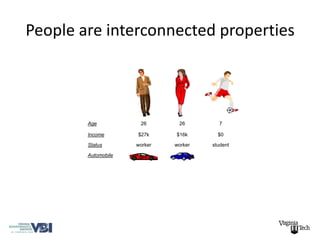
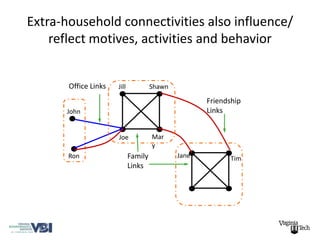
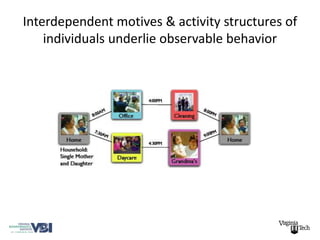
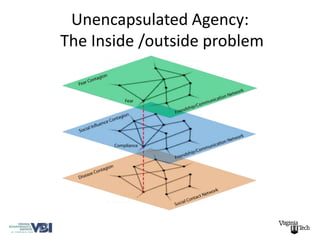
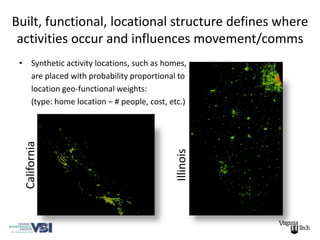
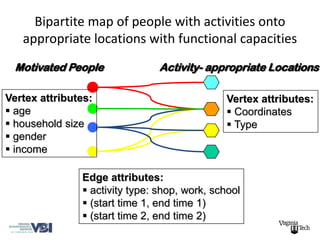
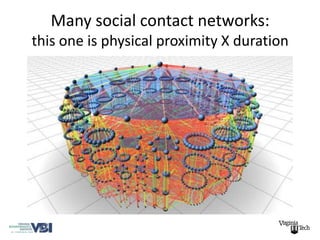
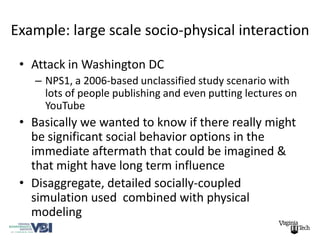


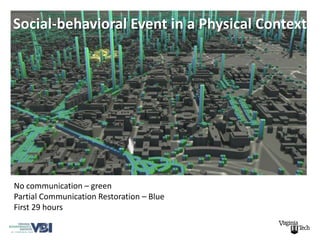
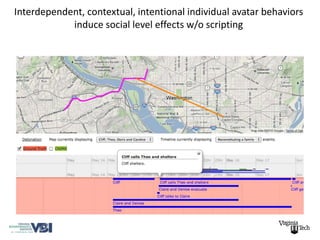
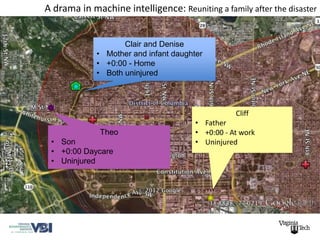
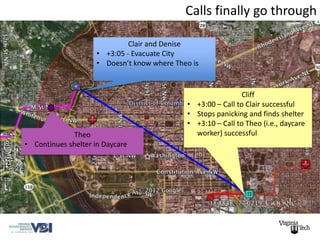

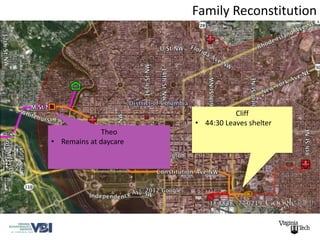


The document discusses the complexity of massively interacting systems, focusing on how human behavior and social interactions create interconnected networks that are influenced by various factors, including geography and individual agency. It highlights the significance of big data in understanding these interactions and notes the challenges of decision-making in such intricate environments. Additionally, it emphasizes the need for new analytical frameworks that integrate human expertise and cognitive systems to navigate and interpret the vast amounts of data generated by these systems.


