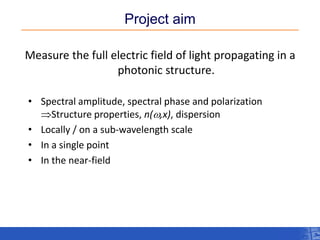
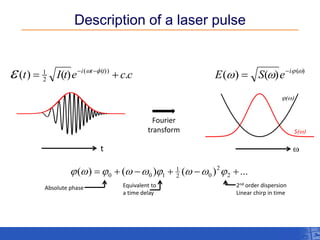
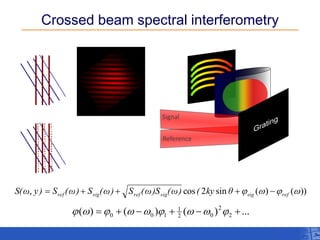
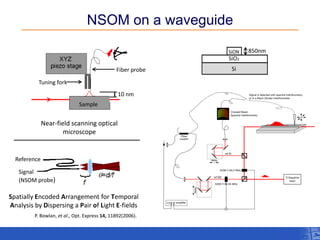
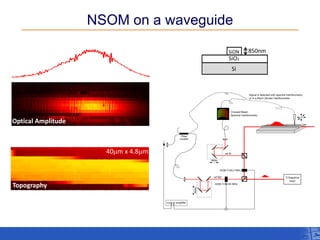
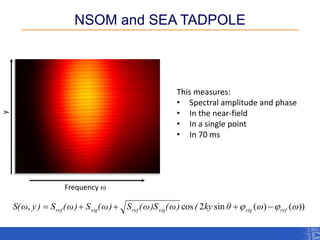
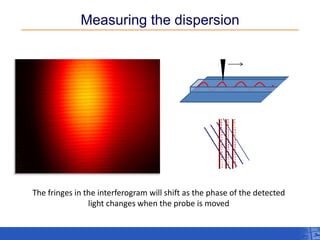
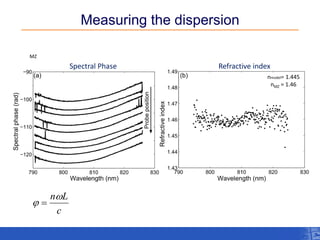
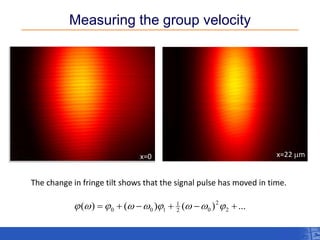
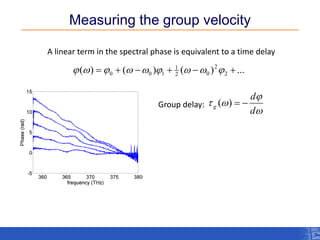
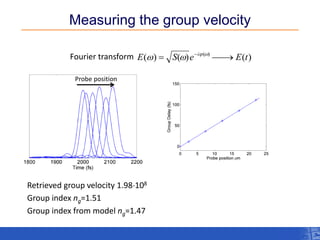
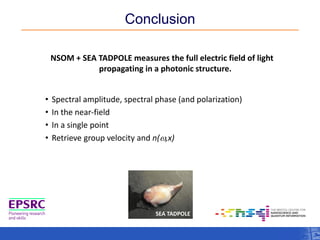
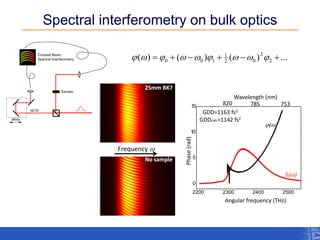
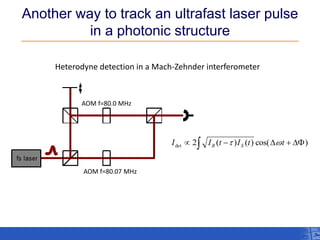
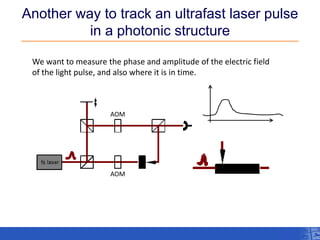
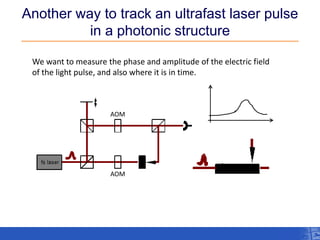
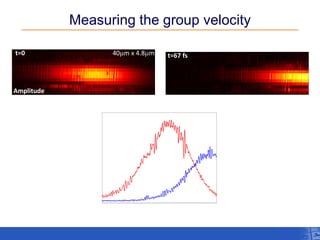
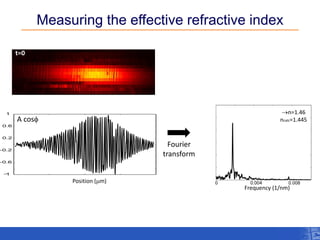
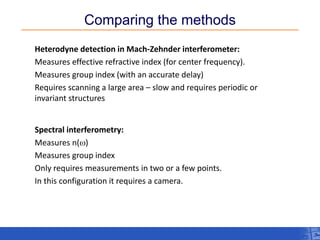
This presentation describes a method to characterize the spectral amplitude and phase of a light pulse propagating in a photonic structure. The method is substantially faster than existing methods. The research was performed at the University of Bristol.
2. Project aim
Measure the full electric field of light propagating in a photonic structure.
•Spectral amplitude, spectral phase and polarization Structure properties, n(w,x), dispersion
•Locally / on a sub-wavelength scale
•In a single point
•In the near-field
3. Description of a laser pulse
( ) ( ) ( ) w w w i E S e t I t e c c i t t ( ) ( ) . ( ( ))
2
1 w
t w
Fourier
transform
(w)
S(w)
Absolute phase
( ) ( ) ( ) ... 2
2
2 0
1
0 0 1 w w w w w
Equivalent to
a time delay
2nd order dispersion
Linear chirp in time
4. Crossed beam spectral interferometry
t=0
, cos 2 sin (w) (w)) ref sig ref sig sig ref S(ω y ) S (ω) S (ω) S (ω)S (ω) ( ky θ
( ) ( ) ( ) ... 2
2
2 0
1
0 0 1 w w w w w
Signal
Reference
5. NSOM on a waveguide
Optical amplitude
Amplitude
Si
SiO2
SiON
850nm
Sample
Near-field scanning optical microscope
Tuning fork
Fiberprobe
10 nm
Spatially Encoded Arrangement for Temporal Analysis by Dispersing a Pair of Light E-fields
Signal
(NSOM probe)
Reference
P. Bowlan, et al., Opt. Express 14, 11892(2006).
6. NSOM on a waveguide
Optical amplitude
Amplitude
40mm x 4.8mm
Topography
Si
SiO2
SiON
850nm
Optical Amplitude
7. NSOM and SEA TADPOLE
This measures:
•Spectral amplitude and phase
•In the near-field
•In a single point
•In 70 ms
Frequency w
y
))()(sin2cos,wwrefsigsigrefsigrefθky()ω()Sω(S)ω(S)ω(S)yω(S
8. Measuring the dispersion
The fringes in the interferogramwill shift as the phase of the detected light changes when the probe is moved
9. Measuring the dispersion
Spectral Phase
t=0
c
nwL
Refractive index
nmodel= 1.445
nMZ = 1.46
MZ
10. Measuring the group velocity
x=0
x=22 mm
The change in fringe tilt shows that the signal pulse has moved in time.
...)()()(22021100wwwww
11. Measuring the group velocity
A linear term in the spectral phase is equivalent to a time delay
t=0 ( ) ( ) ( ) ... 2
2
2 0
1
0 0 1 w w w w w
w
w
d
d
g Group delay: ( )
12. Measuring the group velocity
Retrieved group velocity 1.98108
Group index ng=1.51
Group index from model ng=1.47
Fourier transform ( ) ( ) ( ) ( ) E S e E t i w w w
Probe position
13. Conclusion
NSOM + SEA TADPOLE measures the full electric field of light
propagating in a photonic structure.
• Spectral amplitude, spectral phase (and polarization)
• In the near-field
• In a single point
• Retrieve group velocity and n(w,x)
SEA TADPOLE
14.
15. Spectral interferometry on bulk optics
t=0
Angular frequency (THz)
Phase (rad)
(w)
S(w)
820 785 753
Wavelength (nm)
GDD=1163 fs2
GDDcalc=1142 fs2
( ) ( ) ( ) ... 2
2
2 0
1
0 0 1 w w w w w
Frequency w
25mm BK7
No sample
16. Another way to track an ultrafast laser pulse in a photonic structure
AOM f=80.0 MHz
AOM f=80.07 MHz
Heterodyne detection in a Mach-Zehnderinterferometer
)cos()()(2detttItIISRw
17. Another way to track an ultrafast laser pulse in a photonic structure
We want to measure the phase and amplitude of the electric field of the light pulse, and also where it is in time.
AOM
AOM
18. Another way to track an ultrafast laser pulse in a photonic structure
We want to measure the phase and amplitude of the electric field of the light pulse, and also where it is in time.
AOM
AOM
20. Measuring the effective refractive index
t=0
Position (mm)
Fourier transform
n=1.46
ncalc=1.445
Frequency (1/nm)
t=0
A cos
21. Comparing the methods
Heterodyne detection in Mach-Zehnderinterferometer:
Measures effective refractive index (for centerfrequency).
Measures group index (with an accurate delay)
Requires scanning a large area –slow and requires periodic or invariant structures
t=0
Spectral interferometry:
Measures n(w)
Measures group index
Only requiresmeasurements in two or a few points.
In this configuration it requires a camera.