
Download to read offline

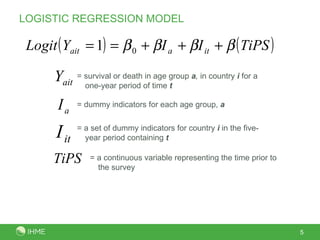
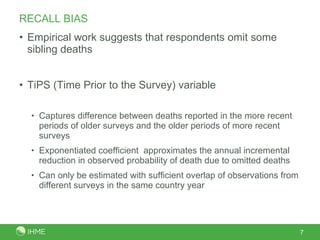
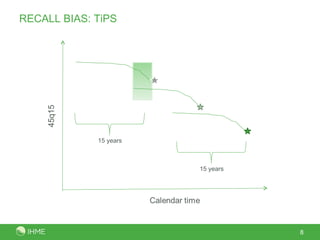
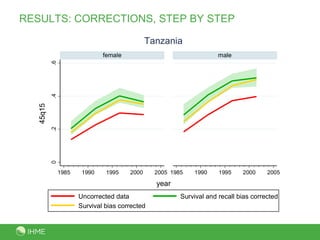
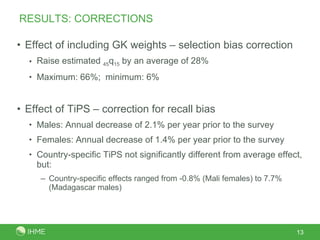
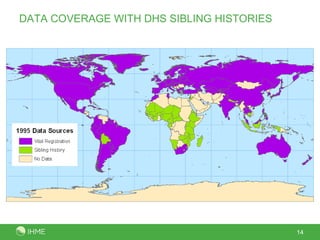
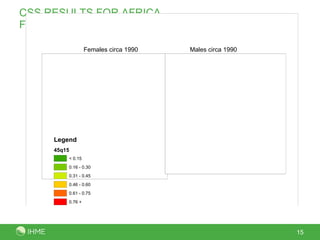
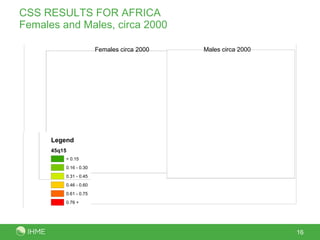
This document presents a new method called the CSS method for measuring adult mortality using sibling survival data from Demographic and Health Surveys. The method uses logistic regression to estimate mortality probabilities while accounting for selection and recall biases. Key results show the CSS method raises estimated mortality rates by an average of 28% after accounting for selection bias, and finds an annual decrease in reported deaths of 1.4-2.1% per year prior to the survey to correct for recall bias. Maps of CSS results for Africa circa 1990 and 2000 are also presented.


![Getting Started with Apache Spark: Big Data Made Simple [Free Meetup]](https://cdn.slidesharecdn.com/ss_thumbnails/apachesparkgettingstarted-260203175547-8361bcc3-thumbnail.jpg?width=640&height=640&fit=bounds)


