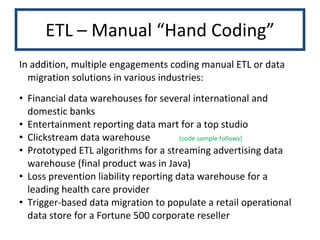
Roderick N. Lee's skills portfolio outlines his extensive experience in business intelligence, data warehousing, decision analysis, database development, and Perl scripting, with over 10 years in multi-platform ETL and software development. The document details various technical capabilities including ETL processes, Oracle PL/SQL, dashboard design, and report creation across different industries. Additionally, it showcases specific projects and examples of work, highlighting his proficiency in tools such as SSIS, Business Objects, and SQL Server Analysis Services.
![Roderick N. Lee Skills Portfolio Business Intelligence Data Warehousing Decision Analysis Database Development Perl Scripting [email_address] http://www.linkedin.com/in/RoderickNLee (714) 893 8727 H (714) 785 8479 M](https://image.slidesharecdn.com/portfolio-12756810330791-phpapp02/85/Skills-Portfolio-1-320.jpg)
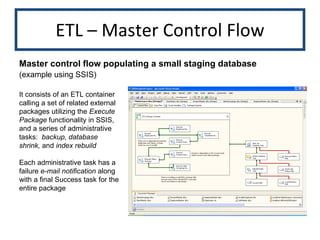
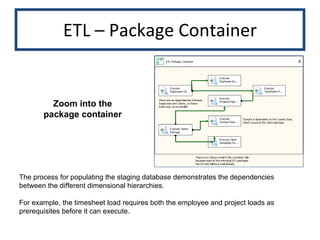
![Roderick N. Lee Skills Portfolio Business Intelligence Data Warehousing Decision Analysis Database Development Perl Scripting [email_address] http://www.linkedin.com/in/RoderickNLee (714) 893 8727 H (714) 785 8479 M](https://image.slidesharecdn.com/portfolio-12756810330791-phpapp02/75/Skills-Portfolio-1-2048.jpg)
![ETL – Oracle PL/SQL Clickstream Data Warehouse Source is a Web traffic transactional system. Databases are not linked, so ETL is a combination of Oracle Import/Export (into a staging database) and PL/SQL Packages and Stored Procedures. This procedure calculates several daily clickstream statistics. procedure p_clicks_daily_sum ( p_day_ID in number ) is [...] cursor c_pages_per_hour is select min(count( click_ID )) min_cnt_clicks , max(count( click_ID )) max_cnt_clicks , min(count(distinct URL )) min_cnt_unique_page , max(count(distinct URL )) max_cnt_unique_page , sum(count(distinct URL )) / cn_hours_per_day mean_uq_page_viewed_cnt from com_daily_ssn_details cdsd where com_ID = v_com_ID and click_day_ID = p_day_ID group by click_hour ; Cursor illustrates several calculations for the daily clickstream statistics](https://image.slidesharecdn.com/portfolio-12756810330791-phpapp02/85/Skills-Portfolio-12-320.jpg)
![ETL – Oracle PL/SQL Daily Clicks Summary Process employs a cursor loop to load the daily clickstream facts by community ID (the top-level dimension) and time begin v_cal_date := mat_stage . get_calendar_date ( p_day_ID ); for r_com in c_communities loop [...] begin insert into clicks_daily_sum values ( p_day_ID , r_com . com_ID , f_get_partition_key ( v_cal_date ) , v_min_cnt_clicks , v_max_cnt_clicks , v_min_cnt_unique_page , v_max_cnt_unique_page , v_mean_uq_page_viewed_cnt , [more columns...] , sysdate ); exception when others then DWH . DWH_process . write_errors ( parameters ); end; end loop; end p_clicks_daily_sum ; (continued)](https://image.slidesharecdn.com/portfolio-12756810330791-phpapp02/85/Skills-Portfolio-13-320.jpg)
![Oracle Application Server Web Content Management Mock-up of primary page lists all items for each content area of the website procedure magazine_list ( [parameter list] ) is begin -- Piece the dynamic query together. v_query := v_select || v_where || v_ord_grp ; open c_pages for v_query ; fetch c_pages into v_resultset(v_resultset. count +1) ; while not c_pages % NOTFOUND loop fetch c_pages into v_resultset(v_resultset. count +1) ; end loop; v_row_count := DBMS_SQL . last_row_count ; close c_pages ;](https://image.slidesharecdn.com/portfolio-12756810330791-phpapp02/85/Skills-Portfolio-27-320.jpg)
![Oracle Application Server -- Build the html frame. (does not include the navigation frame) htp.p ( ' <html> <head> <title>Untitled Document</title> <meta http-equiv="Content-Type“ content="text/html"> <script language="JavaScript"> [...] ‘ ); for i in v_first_result .. least ( v_last_result , v_resultset. count ) loop htp.p ( ‘<tr> <td>' || v_title || '</td> <td class=“list_item">' || v_resultset ( i ). ID || '</td> <td class=“list_item">' || to_char ( v_resultset ( i ). start_date, 'fmmm/dd/yyyy' ) || '</td> <td class=“list_item">' || to_char ( v_resultset ( i ). end_date, 'fmmm/dd/yyyy' ) || '</td> <td class=“list_item">' || v_edit_pvw_del || '</td> </tr>‘ ); end loop; end magazine_list ; Web Content Management (continued)](https://image.slidesharecdn.com/portfolio-12756810330791-phpapp02/85/Skills-Portfolio-28-320.jpg)
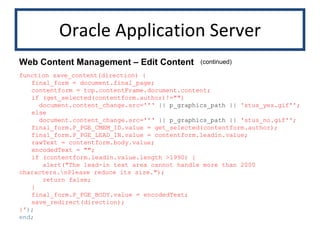
![Oracle Application Server procedure nav_load_and_save_content_mag ( p_graphics_path in varchar2 := cn_graphics_path ) is begin htp.p (' function load_content() { isSelected(''content''); final_form = document.final_page; contentform = top.contentFrame.document.content; for (i=0; i < author_list.length; i++) { contentform.author.options[contentform.author.options.length] = author_list[i]; } preload_select(contentform.author, final_form.P_PGE_CMEM_ID.value); contentform.leadin.value = final_form.P_PGE_LEAD_IN.value; contentform.body.value = final_form.P_PGE_BODY.value; } Web Content Management – Edit Content The actual content management utility employs Javascript to load content text and related data into static HTML subpages](https://image.slidesharecdn.com/portfolio-12756810330791-phpapp02/85/Skills-Portfolio-29-320.jpg)
![Perl sub a1 { print "<table border='1' bordercolor='#FFFFFF' cellspacing='0' cellpadding='2'>"; [header items] print "</table>"; […] my $sth3 = $dbh->prepare(' SELECT date_id, SUM( registrations ), SUM( ath ), SUM( listeners ), SUM( sessions ), SUM( ads_served ), SUM( ads_missed ) FROM a1 WHERE MONTH(date_ID)= ? AND YEAR(date_ID)= ? GROUP by date_ID ORDER by date_ID DESC') or die "Couldn't prepare statement: " . $dbh->errstr; Perl CGI Report Delivery for Web Streaming Advertising Note, the $dbh handle indicating the use of the DBI module to handle database agnostic SQL functionality](https://image.slidesharecdn.com/portfolio-12756810330791-phpapp02/85/Skills-Portfolio-31-320.jpg)
![Perl while (@data3 = $sth3->fetchrow_array()) { $reg_tot = $reg_tot + $data3[1]; $ath_tot = $ath_tot + $data3[2]; $listeners_tot = $listeners_tot + $data3[3]; $sessions_tot = $sessions_tot + $data3[4]; $ads_served_tot = $ads_served_tot + $data3[5]; $rowcount + rowcount + 1; } print "<TR>"; print "<TD align='center' ><B>Total</B></TD>"; print "<TD align='right' ><B>$reg_tot</TD></B>"; print "<TD align='right' ><B>$ath_tot</TD></B>"; print "<TD align='right' ><B>$listeners_tot</TD></B>"; print "<TD align='right' ><B>$sessions_tot</TD></B>"; print "<TD align='right' ><B>$ads_served_tot</TD></B>"; print "</TR>"; if ($sth3->rows == 0) { $nodata = "No Data Found in Daily Report.";} $sth3->finish; $dbh->disconnect; print "</table>"; } Perl CGI Report Delivery (continued)](https://image.slidesharecdn.com/portfolio-12756810330791-phpapp02/85/Skills-Portfolio-32-320.jpg)