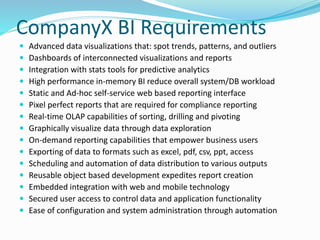
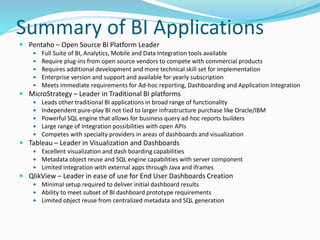
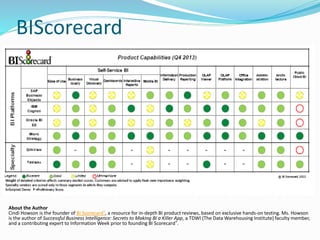
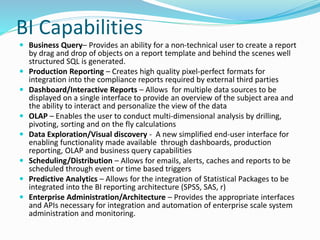
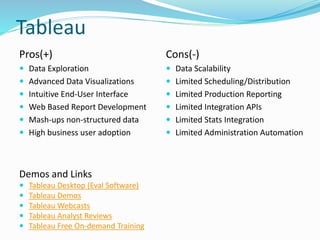
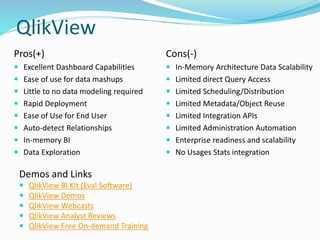
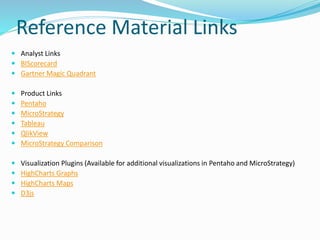
BI Reporting Applications 
Presented by Scott Mitchell 
DWApplications
CompanyX BI Requirements 
 Advanced data visualizations that: spot trends, patterns, and outliers 
 Dashboards of interconnected visualizations and reports 
 Integration with stats tools for predictive analytics 
 High performance in-memory BI reduce overall system/DB workload 
 Static and Ad-hoc self-service web based reporting interface 
 Pixel perfect reports that are required for compliance reporting 
 Real-time OLAP capabilities of sorting, drilling and pivoting 
 Graphically visualize data through data exploration 
 On-demand reporting capabilities that empower business users 
 Exporting of data to formats such as excel, pdf, csv, ppt, access 
 Scheduling and automation of data distribution to various outputs 
 Reusable object based development expedites report creation 
 Embedded integration with web and mobile technology 
 Secured user access to control data and application functionality 
 Ease of configuration and system administration through automation
Summary of BI Applications 
 Pentaho – Open Source BI Platform Leader 
 Full Suite of BI, Analytics, Mobile and Data Integration tools available 
 Require plug-ins from open source vendors to compete with commercial products 
 Requires additional development and more technical skill set for implementation 
 Enterprise version and support and available for yearly subscription 
 Meets immediate requirements for Ad-hoc reporting, Dashboarding and Application Integration 
 MicroStrategy – Leader in Traditional BI platforms 
 Leads other traditional BI applications in broad range of functionality 
 Independent pure-play BI not tied to larger infrastructure purchase like Oracle/IBM 
 Powerful SQL engine that allows for business query ad-hoc reports builders 
 Large range of integration possibilities with open APIs 
 Competes with specialty providers in areas of dashboards and visualization 
 Tableau – Leader in Visualization and Dashboards 
 Excellent visualization and dash boarding capabilities 
 Metadata object reuse and SQL engine capabilities with server component 
 Limited integration with external apps through Java and iframes 
 QlikView – Leader in ease of use for End User Dashboards Creation 
 Minimal setup required to deliver initial dashboard results 
 Ability to meet subset of BI dashboard prototype requirements 
 Limited object reuse from centralized metadata and SQL generation
BIScorecard 
About the Author 
Cindi Howson is the founder of BI Scorecard®, a resource for in-depth BI product reviews, based on exclusive hands-on testing. Ms. Howson 
is the author of Successful Business Intelligence: Secrets to Making BI a Killer App, a TDWI (The Data Warehousing Institute) faculty member, 
and a contributing expert to Information Week prior to founding BI Scorecard®.
BI Capabilities 
 Business Query– Provides an ability for a non-technical user to create a report 
by drag and drop of objects on a report template and behind the scenes well 
structured SQL is generated. 
 Production Reporting – Creates high quality pixel-perfect formats for 
integration into the compliance reports required by external third parties 
 Dashboard/Interactive Reports – Allows for multiple data sources to be 
displayed on a single interface to provide an overview of the subject area and 
the ability to interact and personalize the view of the data 
 OLAP – Enables the user to conduct multi-dimensional analysis by drilling, 
pivoting, sorting and on the fly calculations 
 Data Exploration/Visual discovery - A new simplified end-user interface for 
enabling functionality made available through dashboards, production 
reporting, OLAP and business query capabilities 
 Scheduling/Distribution – Allows for emails, alerts, caches and reports to be 
scheduled through event or time based triggers 
 Predictive Analytics – Allows for the integration of Statistical Packages to be 
integrated into the BI reporting architecture (SPSS, SAS, r) 
 Enterprise Administration/Architecture – Provides the appropriate interfaces 
and APIs necessary for integration and automation of enterprise scale system 
administration and monitoring.
BI Magic Quadrant 
Gartner describes leaders as 
"Leaders are vendors that are 
reasonably strong in the breadth and 
depth of their BI platform 
capabilities and can deliver on 
enterprise-wide implementations 
that support a broad BI strategy. 
Leaders articulate a business 
proposition that resonates with 
buyers, supported by the viability 
and operational capability to deliver 
on a global basis." 
Read The Review 
Gartner does not endorse any vendor, product or service depicted in its research publications, and does not advise technology users to select only those 
vendors with the highest ratings. Gartner research publications consist of the opinions of Gartner's research organization and should not be construed as 
statements of fact. Gartner disclaims all warranties, expressed or implied, with respect to this research, including any warranties of merchantability or 
fitness for a particular purpose.
Pentaho 
Pros(+) 
 Low Cost - Open Source Project 
 Dashboards and Visualization 
 Business Query Ad-hoc Reporting 
 Predictive Analytics Integration 
 Pixel Perfect Formatting 
 Application Integration API 
 Advanced Security Capabilities 
 Mobile Reporting App 
Cons(-) 
 Requires technical resources for 
implementation 
 Requires plug-ins to compete with 
commercial products 
 User interface will be less intuitive 
out of the box without 
customization 
Demos and Links 
 Pentaho (Eval Software) 
 Pentaho Demos 
 PentahoWebcasts 
 Penthao Analyst Reviews 
 Pentaho Training
MicroStrategy 
Pros(+) 
 Data Volume and Scale 
 Business Query Ad-hoc 
 Pixel Perfect Formatting 
 Scheduled Distribution 
 Dashboards and Visualization 
 Predictive Analytics Integration 
 Portal Integration API 
 Advanced SQL and Metadata 
 Administration Automation 
 Advanced Security Capabilities 
Cons(-) 
 Specialty BI tools lead in 
Visualizations 
 Specialty BI tools have a simplified 
user interface 
 Product works best with well 
defined data model 
Demos and Links 
 MicroStrategy BI Reporting Suite (Eval Software) 
 MicroStrategy Demos 
 MicroStrategy Webcasts 
 MicroStrategy Analyst Reviews 
 MicroStrategy Free On-demand Training
Tableau 
Pros(+) 
 Data Exploration 
 Advanced Data Visualizations 
 Intuitive End-User Interface 
 Web Based Report Development 
 Mash-ups non-structured data 
 High business user adoption 
Cons(-) 
 Data Scalability 
 Limited Scheduling/Distribution 
 Limited Production Reporting 
 Limited Integration APIs 
 Limited Stats Integration 
 Limited Administration Automation 
Demos and Links 
 Tableau Desktop (Eval Software) 
 Tableau Demos 
 Tableau Webcasts 
 Tableau Analyst Reviews 
 Tableau Free On-demand Training
QlikView 
Pros(+) 
 Excellent Dashboard Capabilities 
 Ease of use for data mashups 
 Little to no data modeling required 
 Rapid Deployment 
 Ease of Use for End User 
 Auto-detect Relationships 
 In-memory BI 
 Data Exploration 
Cons(-) 
 In-Memory Architecture Data Scalability 
 Limited direct Query Access 
 Limited Scheduling/Distribution 
 Limited Metadata/Object Reuse 
 Limited Integration APIs 
 Limited Administration Automation 
 Enterprise readiness and scalability 
 No Usages Stats integration 
Demos and Links 
 QlikView BI Kit (Eval Software) 
 QlikView Demos 
 QlikView Webcasts 
 QlikView Analyst Reviews 
 QlikView Free On-demand Training
Reference Material Links 
 Analyst Links 
 BIScorecard 
 Gartner Magic Quadrant 
 Product Links 
 Pentaho 
 MicroStrategy 
 Tableau 
 QlikView 
 MicroStrategy Comparison 
 Visualization Plugins (Available for additional visualizations in Pentaho and MicroStrategy) 
 HighCharts Graphs 
 HighCharts Maps 
 D3js

BI Reporting Application Comparison

  • 1.
    BI Reporting Applications Presented by Scott Mitchell DWApplications
  • 2.
    CompanyX BI Requirements  Advanced data visualizations that: spot trends, patterns, and outliers  Dashboards of interconnected visualizations and reports  Integration with stats tools for predictive analytics  High performance in-memory BI reduce overall system/DB workload  Static and Ad-hoc self-service web based reporting interface  Pixel perfect reports that are required for compliance reporting  Real-time OLAP capabilities of sorting, drilling and pivoting  Graphically visualize data through data exploration  On-demand reporting capabilities that empower business users  Exporting of data to formats such as excel, pdf, csv, ppt, access  Scheduling and automation of data distribution to various outputs  Reusable object based development expedites report creation  Embedded integration with web and mobile technology  Secured user access to control data and application functionality  Ease of configuration and system administration through automation
  • 3.
    Summary of BIApplications  Pentaho – Open Source BI Platform Leader  Full Suite of BI, Analytics, Mobile and Data Integration tools available  Require plug-ins from open source vendors to compete with commercial products  Requires additional development and more technical skill set for implementation  Enterprise version and support and available for yearly subscription  Meets immediate requirements for Ad-hoc reporting, Dashboarding and Application Integration  MicroStrategy – Leader in Traditional BI platforms  Leads other traditional BI applications in broad range of functionality  Independent pure-play BI not tied to larger infrastructure purchase like Oracle/IBM  Powerful SQL engine that allows for business query ad-hoc reports builders  Large range of integration possibilities with open APIs  Competes with specialty providers in areas of dashboards and visualization  Tableau – Leader in Visualization and Dashboards  Excellent visualization and dash boarding capabilities  Metadata object reuse and SQL engine capabilities with server component  Limited integration with external apps through Java and iframes  QlikView – Leader in ease of use for End User Dashboards Creation  Minimal setup required to deliver initial dashboard results  Ability to meet subset of BI dashboard prototype requirements  Limited object reuse from centralized metadata and SQL generation
  • 4.
    BIScorecard About theAuthor Cindi Howson is the founder of BI Scorecard®, a resource for in-depth BI product reviews, based on exclusive hands-on testing. Ms. Howson is the author of Successful Business Intelligence: Secrets to Making BI a Killer App, a TDWI (The Data Warehousing Institute) faculty member, and a contributing expert to Information Week prior to founding BI Scorecard®.
  • 5.
    BI Capabilities Business Query– Provides an ability for a non-technical user to create a report by drag and drop of objects on a report template and behind the scenes well structured SQL is generated.  Production Reporting – Creates high quality pixel-perfect formats for integration into the compliance reports required by external third parties  Dashboard/Interactive Reports – Allows for multiple data sources to be displayed on a single interface to provide an overview of the subject area and the ability to interact and personalize the view of the data  OLAP – Enables the user to conduct multi-dimensional analysis by drilling, pivoting, sorting and on the fly calculations  Data Exploration/Visual discovery - A new simplified end-user interface for enabling functionality made available through dashboards, production reporting, OLAP and business query capabilities  Scheduling/Distribution – Allows for emails, alerts, caches and reports to be scheduled through event or time based triggers  Predictive Analytics – Allows for the integration of Statistical Packages to be integrated into the BI reporting architecture (SPSS, SAS, r)  Enterprise Administration/Architecture – Provides the appropriate interfaces and APIs necessary for integration and automation of enterprise scale system administration and monitoring.
  • 6.
    BI Magic Quadrant Gartner describes leaders as "Leaders are vendors that are reasonably strong in the breadth and depth of their BI platform capabilities and can deliver on enterprise-wide implementations that support a broad BI strategy. Leaders articulate a business proposition that resonates with buyers, supported by the viability and operational capability to deliver on a global basis." Read The Review Gartner does not endorse any vendor, product or service depicted in its research publications, and does not advise technology users to select only those vendors with the highest ratings. Gartner research publications consist of the opinions of Gartner's research organization and should not be construed as statements of fact. Gartner disclaims all warranties, expressed or implied, with respect to this research, including any warranties of merchantability or fitness for a particular purpose.
  • 7.
    Pentaho Pros(+) Low Cost - Open Source Project  Dashboards and Visualization  Business Query Ad-hoc Reporting  Predictive Analytics Integration  Pixel Perfect Formatting  Application Integration API  Advanced Security Capabilities  Mobile Reporting App Cons(-)  Requires technical resources for implementation  Requires plug-ins to compete with commercial products  User interface will be less intuitive out of the box without customization Demos and Links  Pentaho (Eval Software)  Pentaho Demos  PentahoWebcasts  Penthao Analyst Reviews  Pentaho Training
  • 8.
    MicroStrategy Pros(+) Data Volume and Scale  Business Query Ad-hoc  Pixel Perfect Formatting  Scheduled Distribution  Dashboards and Visualization  Predictive Analytics Integration  Portal Integration API  Advanced SQL and Metadata  Administration Automation  Advanced Security Capabilities Cons(-)  Specialty BI tools lead in Visualizations  Specialty BI tools have a simplified user interface  Product works best with well defined data model Demos and Links  MicroStrategy BI Reporting Suite (Eval Software)  MicroStrategy Demos  MicroStrategy Webcasts  MicroStrategy Analyst Reviews  MicroStrategy Free On-demand Training
  • 9.
    Tableau Pros(+) Data Exploration  Advanced Data Visualizations  Intuitive End-User Interface  Web Based Report Development  Mash-ups non-structured data  High business user adoption Cons(-)  Data Scalability  Limited Scheduling/Distribution  Limited Production Reporting  Limited Integration APIs  Limited Stats Integration  Limited Administration Automation Demos and Links  Tableau Desktop (Eval Software)  Tableau Demos  Tableau Webcasts  Tableau Analyst Reviews  Tableau Free On-demand Training
  • 10.
    QlikView Pros(+) Excellent Dashboard Capabilities  Ease of use for data mashups  Little to no data modeling required  Rapid Deployment  Ease of Use for End User  Auto-detect Relationships  In-memory BI  Data Exploration Cons(-)  In-Memory Architecture Data Scalability  Limited direct Query Access  Limited Scheduling/Distribution  Limited Metadata/Object Reuse  Limited Integration APIs  Limited Administration Automation  Enterprise readiness and scalability  No Usages Stats integration Demos and Links  QlikView BI Kit (Eval Software)  QlikView Demos  QlikView Webcasts  QlikView Analyst Reviews  QlikView Free On-demand Training
  • 11.
    Reference Material Links  Analyst Links  BIScorecard  Gartner Magic Quadrant  Product Links  Pentaho  MicroStrategy  Tableau  QlikView  MicroStrategy Comparison  Visualization Plugins (Available for additional visualizations in Pentaho and MicroStrategy)  HighCharts Graphs  HighCharts Maps  D3js