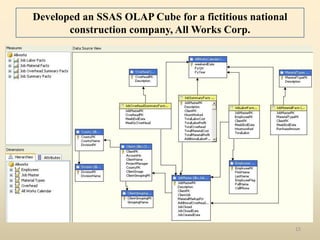
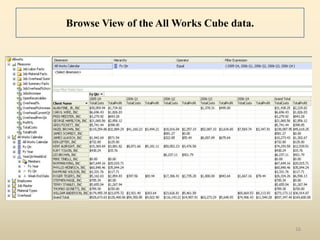
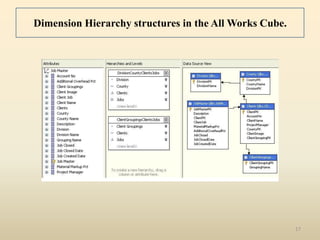
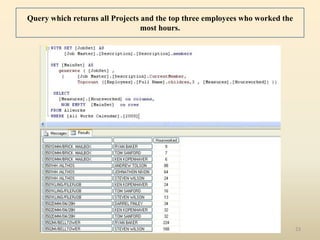
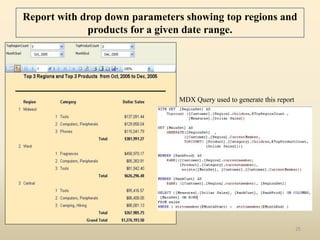
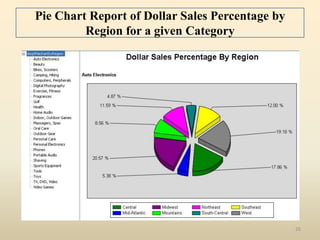
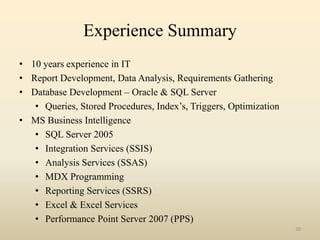
Business Intelligence
Portfolio


Name: Sam Kamara
Email: skamara1@yahoo.com
Phone: 973-472-0003
        917-318-7076


     Business


          Intelligence
                        1
Contents
    This portfolio contains examples of my development
          skills in the Business Intelligence arena.
               Subject                               Page
•   Data Modeling                                     3
•   SQL Programming                                   5
•   SQL Server Integration Services (SSIS)            9
•   SQL Server Analysis Services (SSAS)               14
•   MDX Programming                                   21
•   SQL Server Reporting Services (SSRS)              24
•   Performance Point Server (PPS)                    27
•   Experience Summary                                30
                                                            2
Data Modeling


                3
A data model created for a book sales data
               warehouse


                                             4
SQL Server
T-SQL Programming


                    5
This query returns a list of books where there are less than
                 ten copies and more than 50 reservations.


SELECT ti.title_no,
   ti.title,
   rs.isbn,
   COUNT(*) as total_reservations
FROM Title ti
 JOIN item itm ON ti.title_no = itm.title_no
 JOIN reservation rs ON rs.isbn = itm.isbn
WHERE 11 > (SELECT count(cp.copy_no)
              FROM copy cp
              WHERE cp.isbn = itm.isbn)
AND itm.isbn IN (SELECT DISTINCT rs1.isbn
                 FROM reservation rs1
                 WHERE 50 < (SELECT COUNT(*)
                                    FROM Reservation rs2
                                    WHERE rs1.isbn = s2.isbn))
GROUP BY ti.title_no, ti.title, rs.isbn
ORDER BY ti.title_no


                                                                        6
Script to load Date Dimension data into an Analysis Services
                    staging database table.
                                               (Results on next page)


declare @startDate DateTime,
        @EndDate datetime

set @StartDate = '1-1-2006'
set @EndDate = '12-31-2010'

while @StartDate <= @EndDate
 begin
   insert into DimDates (ActualDate, WeekEndDate, MonthDescr, QuarterDescr, Year,
                           MonthKey, QuarterKey, ShortWeekEnd, ShortActualDate )
   values (@StartDate,
            @StartDate + (7 - datepart(dw,@StartDate)), -- assumes a Sunday to Saturday business week
            datename(m,@StartDate) + ' ' + cast(year(@StartDate) as varchar(4)) , -- "March 2006"
            'Q' + cast(datepart(qq,@StartDate) as varchar(1)) + ' ' + cast(year(@StartDate) as varchar(4)) , -- "Q3 2006"
            Year(@StartDate) , -- “2006”
            cast(year(@StartDate) as varchar(4)) + '-' +
               case when datepart(m,@StartDate) < 10 then '0' else '' end +
                  cast(datepart(m,@StartDate) as varchar(2)) , -- "2006-12“ or "2006-01"
            cast(year(@StartDate) as varchar(4)) + '-' +
               cast(datepart(qq,@StartDate) as varchar(1)), -- "2006-1" for key for Q1 2006
            '',''
          )
    set @StartDate = @StartDate + 1
 end
update DimDates set ShortWeekEnd = cast(WeekEndDate as varchar(11))
update DimDates set ShortActualDate = cast(ActualDate as varchar(11))
                                                                                                                            7
GO
Sampling of results of Date Dimension data load.


                                                   8
SQL Server
Integration Services (SSIS)


                              9
ETL process which imports multiple CSV files containing Job Time Sheets and
 loads them into a staging database. A status email is sent upon completion,
                           indicating job statistics.


                                                                               10
Data flow task for the Job Time Sheets package processes through a
single CSV file doing multiple lookups to ensure database integrity.
     It logs any rows that error out for review and correction.


                                                                       11
VB.Net script used in previous package to keep a
running total of the rows processed and the rows that
                   contained errors.


                                                        12
ETL Master Package which runs all ETL packages and then runs database
  maintenance tasks. Email is sent out upon completion with job stats.


                                                                         13
SQL Server
Analysis Services (SSAS)


                           14
Developed an SSAS OLAP Cube for a fictitious national
       construction company, All Works Corp.


                                                        15
Browse View of the All Works Cube data.


                                          16
Dimension Hierarchy structures in the All Works Cube.


                                                        17
Definitions of Calculated Members.


                                     18
Definition of Key Performance Indicator (KPI).


                                                 19
KPI Exported to an Excel Pivot


                                 20
MDX Programming


                  21
Query which returns Overhead Totals by Category for 2 Quarters, and the
                   percent change between the two.


                                                                          22
Query which returns all Projects and the top three employees who worked the
                                 most hours.


                                                                              23
SQL Server
Reporting Services (SSRS)


                            24
Report with drop down parameters showing top regions and
             products for a given date range.


                               MDX Query used to generate this report


                                                                        25
Pie Chart Report of Dollar Sales Percentage by
         Region for a given Category


                                                 26
Performance Point Server 2007
           (PPS)


                                27
KPI Scorecard created in PPS showing KPI Status and
      Trending of Growth % and Returns %.


                                                      28
KPI Scorecard with Hot Link (clicking Sales Goal on left brings up
                    the graph on the right).


                                                                 29
Experience Summary
• 10 years experience in IT
• Report Development, Data Analysis, Requirements Gathering
• Database Development – Oracle & SQL Server
   • Queries, Stored Procedures, Index’s, Triggers, Optimization
• MS Business Intelligence
   • SQL Server 2005
   • Integration Services (SSIS)
   • Analysis Services (SSAS)
   • MDX Programming
   • Reporting Services (SSRS)
   • Excel & Excel Services
   • Performance Point Server 2007 (PPS)
                                                                   30

Sam Kamara Business Intelligence Portfolio

  • 1.
    Business Intelligence Portfolio Name: SamKamara Email: skamara1@yahoo.com Phone: 973-472-0003 917-318-7076 Business Intelligence 1
  • 2.
    Contents This portfolio contains examples of my development skills in the Business Intelligence arena. Subject Page • Data Modeling 3 • SQL Programming 5 • SQL Server Integration Services (SSIS) 9 • SQL Server Analysis Services (SSAS) 14 • MDX Programming 21 • SQL Server Reporting Services (SSRS) 24 • Performance Point Server (PPS) 27 • Experience Summary 30 2
  • 3.
  • 4.
    A data modelcreated for a book sales data warehouse 4
  • 5.
  • 6.
    This query returnsa list of books where there are less than ten copies and more than 50 reservations. SELECT ti.title_no, ti.title, rs.isbn, COUNT(*) as total_reservations FROM Title ti JOIN item itm ON ti.title_no = itm.title_no JOIN reservation rs ON rs.isbn = itm.isbn WHERE 11 > (SELECT count(cp.copy_no) FROM copy cp WHERE cp.isbn = itm.isbn) AND itm.isbn IN (SELECT DISTINCT rs1.isbn FROM reservation rs1 WHERE 50 < (SELECT COUNT(*) FROM Reservation rs2 WHERE rs1.isbn = s2.isbn)) GROUP BY ti.title_no, ti.title, rs.isbn ORDER BY ti.title_no 6
  • 7.
    Script to loadDate Dimension data into an Analysis Services staging database table. (Results on next page) declare @startDate DateTime, @EndDate datetime set @StartDate = '1-1-2006' set @EndDate = '12-31-2010' while @StartDate <= @EndDate begin insert into DimDates (ActualDate, WeekEndDate, MonthDescr, QuarterDescr, Year, MonthKey, QuarterKey, ShortWeekEnd, ShortActualDate ) values (@StartDate, @StartDate + (7 - datepart(dw,@StartDate)), -- assumes a Sunday to Saturday business week datename(m,@StartDate) + ' ' + cast(year(@StartDate) as varchar(4)) , -- "March 2006" 'Q' + cast(datepart(qq,@StartDate) as varchar(1)) + ' ' + cast(year(@StartDate) as varchar(4)) , -- "Q3 2006" Year(@StartDate) , -- “2006” cast(year(@StartDate) as varchar(4)) + '-' + case when datepart(m,@StartDate) < 10 then '0' else '' end + cast(datepart(m,@StartDate) as varchar(2)) , -- "2006-12“ or "2006-01" cast(year(@StartDate) as varchar(4)) + '-' + cast(datepart(qq,@StartDate) as varchar(1)), -- "2006-1" for key for Q1 2006 '','' ) set @StartDate = @StartDate + 1 end update DimDates set ShortWeekEnd = cast(WeekEndDate as varchar(11)) update DimDates set ShortActualDate = cast(ActualDate as varchar(11)) 7 GO
  • 8.
    Sampling of resultsof Date Dimension data load. 8
  • 9.
  • 10.
    ETL process whichimports multiple CSV files containing Job Time Sheets and loads them into a staging database. A status email is sent upon completion, indicating job statistics. 10
  • 11.
    Data flow taskfor the Job Time Sheets package processes through a single CSV file doing multiple lookups to ensure database integrity. It logs any rows that error out for review and correction. 11
  • 12.
    VB.Net script usedin previous package to keep a running total of the rows processed and the rows that contained errors. 12
  • 13.
    ETL Master Packagewhich runs all ETL packages and then runs database maintenance tasks. Email is sent out upon completion with job stats. 13
  • 14.
  • 15.
    Developed an SSASOLAP Cube for a fictitious national construction company, All Works Corp. 15
  • 16.
    Browse View ofthe All Works Cube data. 16
  • 17.
    Dimension Hierarchy structuresin the All Works Cube. 17
  • 18.
  • 19.
    Definition of KeyPerformance Indicator (KPI). 19
  • 20.
    KPI Exported toan Excel Pivot 20
  • 21.
  • 22.
    Query which returnsOverhead Totals by Category for 2 Quarters, and the percent change between the two. 22
  • 23.
    Query which returnsall Projects and the top three employees who worked the most hours. 23
  • 24.
  • 25.
    Report with dropdown parameters showing top regions and products for a given date range. MDX Query used to generate this report 25
  • 26.
    Pie Chart Reportof Dollar Sales Percentage by Region for a given Category 26
  • 27.
  • 28.
    KPI Scorecard createdin PPS showing KPI Status and Trending of Growth % and Returns %. 28
  • 29.
    KPI Scorecard withHot Link (clicking Sales Goal on left brings up the graph on the right). 29
  • 30.
    Experience Summary • 10years experience in IT • Report Development, Data Analysis, Requirements Gathering • Database Development – Oracle & SQL Server • Queries, Stored Procedures, Index’s, Triggers, Optimization • MS Business Intelligence • SQL Server 2005 • Integration Services (SSIS) • Analysis Services (SSAS) • MDX Programming • Reporting Services (SSRS) • Excel & Excel Services • Performance Point Server 2007 (PPS) 30