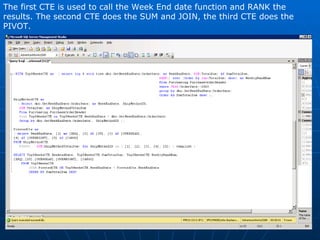
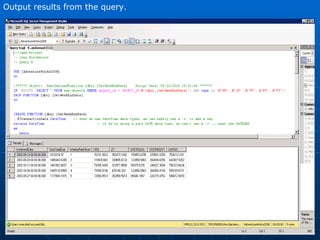
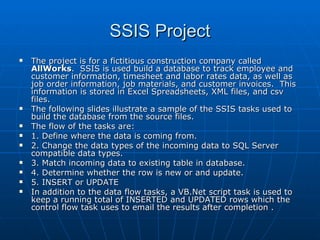
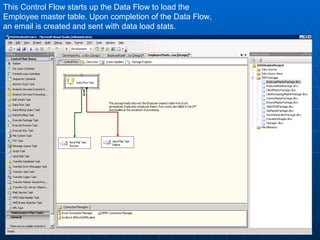
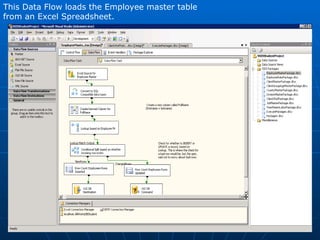
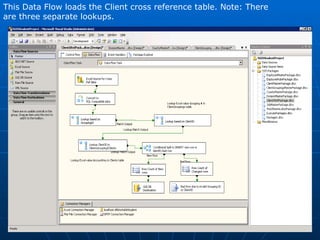
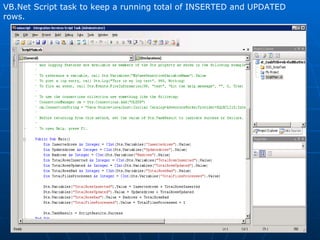
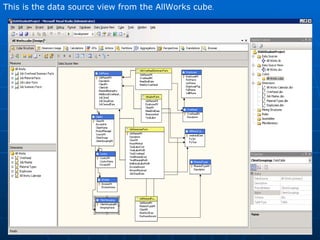
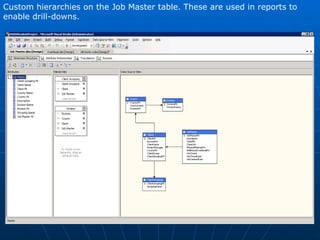
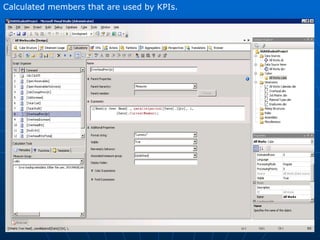
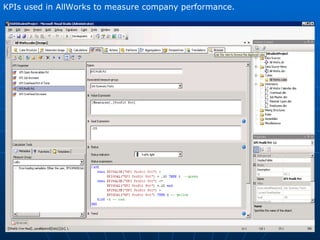
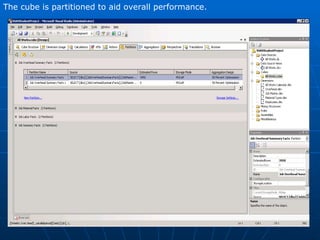
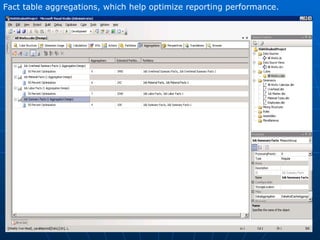
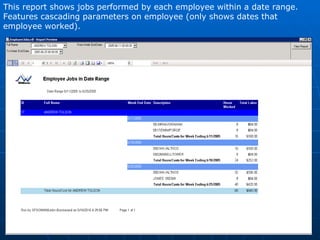
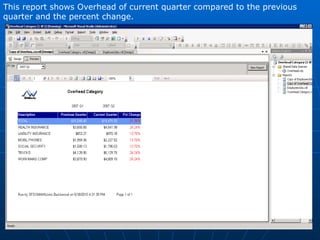
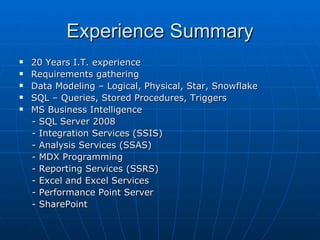
9. This Control Flow starts up the Data Flow to load the Employee master table. Upon completion of the Data Flow, an email is created and sent with data load stats.
10. This Data Flow loads the Employee master table from an Excel Spreadsheet.
11. This Data Flow loads the Client cross reference table. Note: There are three separate lookups.
12. VB.Net Script task to keep a running total of INSERTED and UPDATED rows.
13. This is the data source view from the AllWorks cube .
14. Custom hierarchies on the Job Master table. These are used in reports to enable drill-downs.
20. This report shows jobs performed by each employee within a date range. Features cascading parameters on employee (only shows dates that employee worked).
21. This report shows Overhead of current quarter compared to the previous quarter and the percent change.
22. This line chart tracks the training evaluation scores of the specific trainer for the current quarter compared to the overall current QTD training evaluation score.
23.
24. This scorecard shows KPIs for Overhead categories on the left and Open Receivables and Profit % on the right. All by quarter.
25. This chart shows employee’s labor dollars by quarter, along with the percentage of labor for the jobs the employee worked on.
26. This is the MDX code behind the previous slide.
27. Pivot table using Overhead amount, Quarter, and Year (filters on Year) from cube.
28. Excel pivot table using Profit dollars, Profit %, Quarter, and County (filter on multiple counties) from the cube. Profit % on a dual-Y axis.