Download as PDF, PPTX

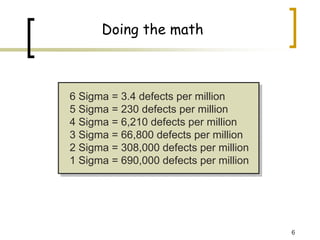
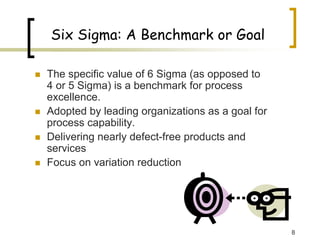
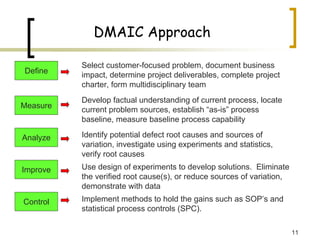
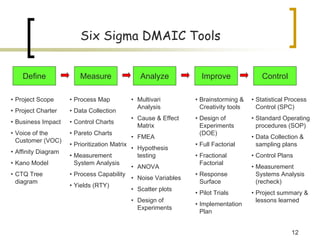
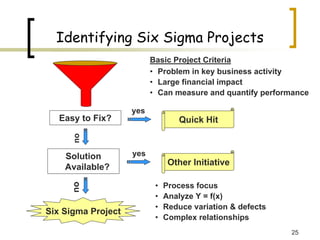
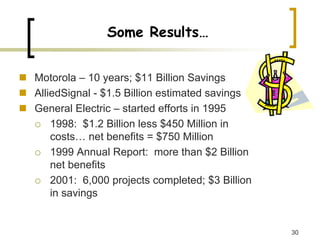

Six Sigma is a method for process improvement that aims to reduce defects. It uses statistical tools and a DMAIC framework of Define, Measure, Analyze, Improve, and Control. The goal is to drive processes to near perfection with as few as 3.4 defects per million opportunities. Adopting Six Sigma requires training staff at all levels and selecting projects that can generate significant savings. While implementation presents challenges, many companies have achieved billions in savings through Six Sigma's systematic approach to reducing variation and defects.


![Six Sigma[1]](https://cdn.slidesharecdn.com/ss_thumbnails/six-sigma14148-thumbnail.jpg?width=640&height=640&fit=bounds)


