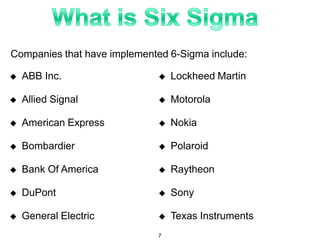
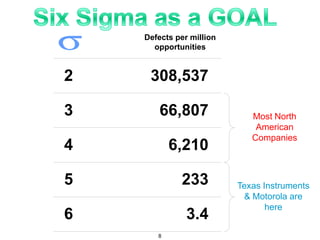
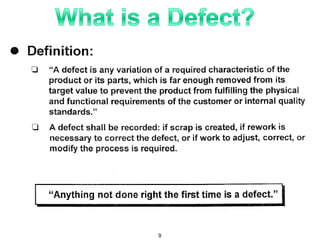
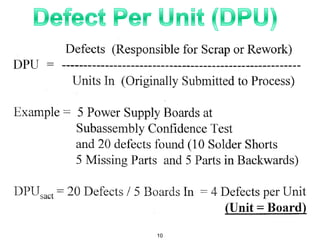
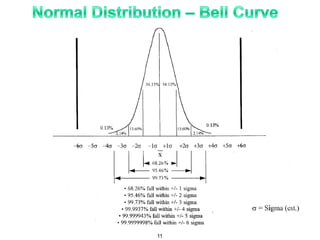
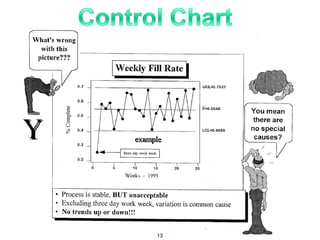
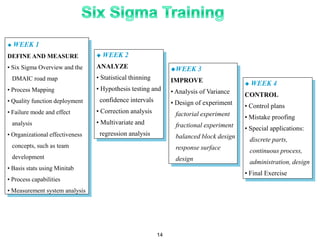
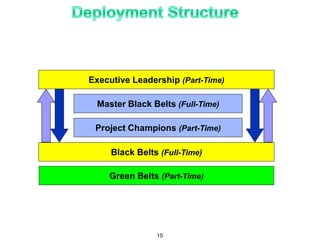
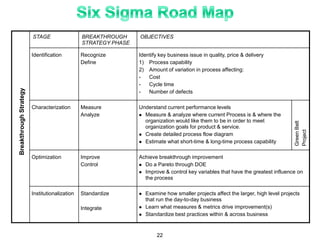
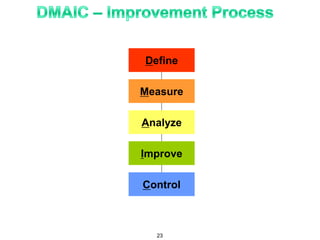
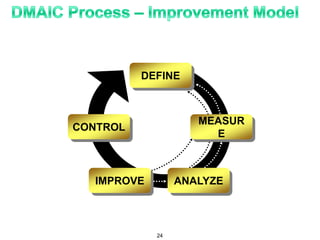
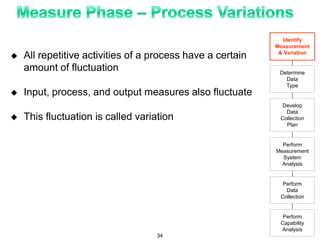
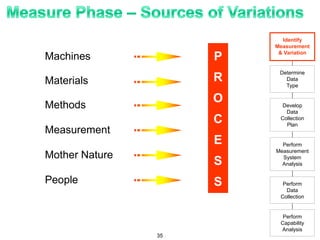
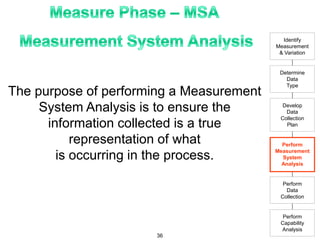
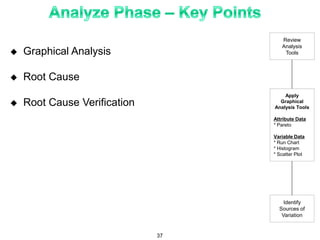
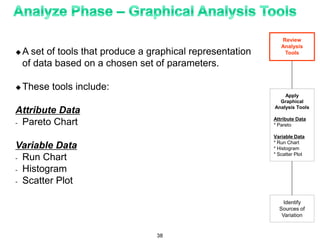
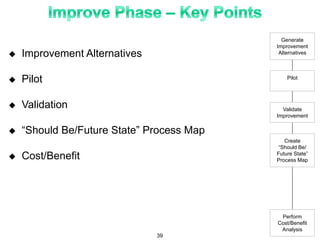
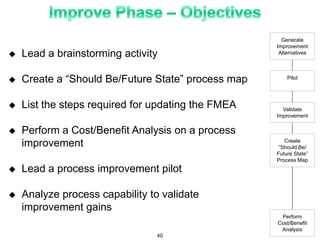
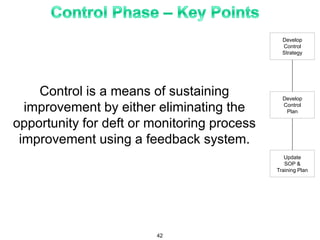
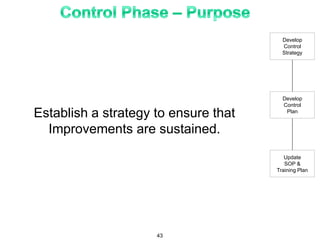
Edge Consultancy Inc
The Journey of SIX SIGMA
Introduction level for Green Belts
Six Sigma Overview – Presentation 2014Q1
Linked In - Ahmed El-Askalany, CSTE, CSQA, PMP, CQIA, ITIL | LinkedIn
https://www.facebook.com/EdgeConsultancyInc
E-mail: EdgeConsultancyInc@Gmail.com
2
Consumer Driven 6-Sigma is a tool that
significantly improves customer satisfaction
and shareholder value by reducing variability
in every aspect of our business.
“6-Sigma is not something else that
you do … it is what you do.”
3
• Consumer Driven 6-Sigma tools will be
used to attain World Class performance
in both short-term and long-term
customer satisfaction.
• Progress toward these performance
goals will be made as Green Belts and
Black Belts apply 6-Sigma tools to
correct issues that impact customer
satisfaction.
4
Motorola implemented a quality improvement program in 1982.
 Quality improvement efforts pointed to the need for improved
analytical tools.
 6-Sigma tools were developed.
 Motorola won the Malcolm Baldrige Award in 1988.
5
6
Companies that have implemented 6-Sigma include:
 ABB Inc.
 Allied Signal
 American Express
 Bombardier
 Bank Of America
 DuPont
 General Electric
 Lockheed Martin
 Motorola
 Nokia
 Polaroid
 Raytheon
 Sony
 Texas Instruments
7
Defects per million
opportunities
2 308,537
3 66,807
4 6,210
5 233
6 3.4
Most North
American
Companies
Texas Instruments
& Motorola are
here
8
9
10
11
13
 WEEK 1
DEFINE AND MEASURE
• Six Sigma Overview and the
DMAIC road map
• Process Mapping
• Quality function deployment
• Failure mode and effect
analysis
• Organizational effectiveness
concepts, such as team
development
• Basis stats using Minitab
• Process capabilities
• Measurement system analysis
 WEEK 2
ANALYZE
• Statistical thinning
• Hypothesis testing and
confidence intervals
• Correction analysis
• Multivariate and
regression analysis
WEEK 3
IMPROVE
• Analysis of Variance
• Design of experiment
factorial experiment
fractional experiment
balanced block design
response surface
design
 WEEK 4
CONTROL
• Control plans
• Mistake proofing
• Special applications:
discrete parts,
continuous process,
administration, design
• Final Exercise
14
Executive Leadership (Part-Time)
Master Black Belts (Full-Time)
Project Champions (Part-Time)
Black Belts (Full-Time)
Green Belts (Part-Time)
15
 Participate in larger Black Belt DMAIC projects
 Lead Green Belt level 6-Sigma Projects
 Apply 6-Sigma problem-solving tools and principles to daily
work
Specific details regarding the deployment and role of Green
Belts are determined by each organization.
16
 Roles
- Lead and teach the Consumer Driven 6-Sigma process
- Train Green Belts
 Requirements
- Complete 4-6 projects annually that:
 Address customer satisfaction – a 70% reduction in
Defects Per Million Opportunities (DPMO)
AND
 Produce a $250K cost savings/profit enhancement
average per project. This will include:
- Hard annual Profit Before Tax (PBT)
- Thing Gone Wrong (TGW) revenue impact
17
 Responsible for Black Belt, Master Black Belt and
Leadership training
 Assist Black Belt activities through coaching and counseling
techniques
 Responsible for leading large projects with multiple Black
Belts to completion
18
 Accountable for performance of Black Belts and results of
projects
 Responsible for selection, scoping, and successful
completion of Black Belt projects
 Remove roadblocks for Black Belts and ensure timely
completion of projects
19
Drives Consumer Driven 6-Sigma process
to meet key business goals and integrates
it into everyday management practice.
20
 Does the project have recurring events?
 Is the scope of the project narrow?
 Do metrics exist? Can measurements be established
in an appropriate amount of time?
 Do you have control of the process?
 Does the project improve Customer Satisfaction?
If “Yes” to all of the above, the project is an excellent
candidate for a Consumer Driven 6-Sigma Project.
21
STAGE BREAKTHROUGH
STRATEGY PHASE
OBJECTIVES
Identification Recognize
Define
Identify key business issue in quality, price & delivery
1) Process capability
2) Amount of variation in process affecting:
- Cost
- Cycle time
- Number of defects
Characterization Measure
Analyze
Understand current performance levels
 Measure & analyze where current Process is & where the
organization would like them to be in order to meet
organization goals for product & service.
 Create detailed process flow diagram
 Estimate what short-time & long-time process capability
Optimization Improve
Control
Achieve breakthrough improvement
 Do a Pareto through DOE
 Improve & control key variables that have the greatest influence on
the process
Institutionalization Standardize
Integrate
 Examine how smaller projects affect the larger, high level projects
that run the day-to-day business
 Learn what measures & metrics drive improvement(s)
 Standardize best practices within & across business
GreenBelt
Project
22
Define
Measure
Analyze
Improve
Control
23
DEFINE
MEASUR
E
ANALYZEIMPROVE
CONTROL
24
The selection of performance characteristics
critical in meeting the customer’s
expectations.
25
The creation and validation of a
measurement system.
26
The identification of sources of variation
from the performance objectives.
0
2
4
6
8
10
12
14
1 2 3 4 5 6 7
XXXX
0
5
10
15
1 2 3 4 5 6 7
0
5
10
15
1 2 3 4 5 6 7
0 5 10 15
1
4
7
0 5 10 15
1
4
7
1 2 3 4 5 6 7
S1
S2
0
2
4
6
8
10
27
The discovery of process relationships and
the establishment of new procedures.
28
The monitoring of implemented improvements
to maintain gains and ensure corrective
actions are taken when necessary.
29
 Define the problem with a High-Level Problem Statement
 Specifically identify the process of product customers
impacted by the problem.
 Define CTQ’s (Critical to Quality) characteristics from the
customer’s point of view
 Scope the project to a specific actionable level
 Develop a refined Problem Statement
 Document the Define Phase activities in a Project Charter
Define
Problem
Identify
Customer
Identify
CTQ’s
Map
Process
Refine
Subject
Scope
Update
Project
Charter
30
 Problem Statement
 CTQ
 Project Scope
 Process Mapping
 Project Charter
Define
Problem
Identify
Customer
Identify
CTQ’s
Map
Process
Refine
Subject
Scope
Update
Project
Charter
31
 Measurement
 Variation
 Data
 Data Collection Plan
 Measurement System Analysis
 Capability Analysis
Identify
Measurement
& Variation
Determine
Data
Type
Develop
Data
Collection
Plan
Perform
Measurement
System
Analysis
Perform
Data
Collection
Perform
Capability
Analysis
32
 Define process measures
 Identify the types, sources and causes of variation in
process
 Determine data requirement for a 6-Sigma project
 Develop a Data Collection Plan
 Perform Measurement System Analysis (MSA)
 Conduct Data Collection
 Determine the baseline capability of the project as a
Sigma value
Identify
Measurement
& Variation
Determine
Data
Type
Develop
Data
Collection
Plan
Perform
Measurement
System
Analysis
Perform
Data
Collection
Perform
Capability
Analysis
33
 All repetitive activities of a process have a certain
amount of fluctuation
 Input, process, and output measures also fluctuate
 This fluctuation is called variation
Identify
Measurement
& Variation
Determine
Data
Type
Develop
Data
Collection
Plan
Perform
Measurement
System
Analysis
Perform
Data
Collection
Perform
Capability
Analysis
34
Machines
Materials
Methods
Measurement
Mother Nature
People
P
R
O
C
E
S
S
Identify
Measurement
& Variation
Determine
Data
Type
Develop
Data
Collection
Plan
Perform
Measurement
System
Analysis
Perform
Data
Collection
Perform
Capability
Analysis
35
Identify
Measurement
& Variation
Determine
Data
Type
Develop
Data
Collection
Plan
Perform
Measurement
System
Analysis
Perform
Data
Collection
Perform
Capability
Analysis
The purpose of performing a Measurement
System Analysis is to ensure the
information collected is a true
representation of what
is occurring in the process.
36
 Graphical Analysis
 Root Cause
 Root Cause Verification
Review
Analysis
Tools
Apply
Graphical
Analysis Tools
Attribute Data
* Pareto
Variable Data
* Run Chart
* Histogram
* Scatter Plot
Identify
Sources of
Variation
37
 A set of tools that produce a graphical representation
of data based on a chosen set of parameters.
 These tools include:
Attribute Data
- Pareto Chart
Variable Data
- Run Chart
- Histogram
- Scatter Plot
Review
Analysis
Tools
Apply
Graphical
Analysis Tools
Attribute Data
* Pareto
Variable Data
* Run Chart
* Histogram
* Scatter Plot
Identify
Sources of
Variation
38
 Improvement Alternatives
 Pilot
 Validation
 “Should Be/Future State” Process Map
 Cost/Benefit
Generate
Improvement
Alternatives
Pilot
Validate
Improvement
Create
“Should Be/
Future State”
Process Map
Perform
Cost/Benefit
Analysis
39
Generate
Improvement
Alternatives
Pilot
Validate
Improvement
Create
“Should Be/
Future State”
Process Map
Perform
Cost/Benefit
Analysis
 Lead a brainstorming activity
 Create a “Should Be/Future State” process map
 List the steps required for updating the FMEA
 Perform a Cost/Benefit Analysis on a process
improvement
 Lead a process improvement pilot
 Analyze process capability to validate
improvement gains
40
 Prevention vs. Detection
 Visual Factory
 Long-Term MSA
 Control Plan
 Reaction Plan
Develop
Control
Strategy
Develop
Control
Plan
Update
SOP &
Training Plan
41
Develop
Control
Strategy
Develop
Control
Plan
Update
SOP &
Training Plan
Control is a means of sustaining
improvement by either eliminating the
opportunity for deft or monitoring process
improvement using a feedback system.
42
Develop
Control
Strategy
Develop
Control
Plan
Update
SOP &
Training Plan
Establish a strategy to ensure that
Improvements are sustained.
43

Six Sigma - The Journey of Quality and Management

  • 1.
    Edge Consultancy Inc TheJourney of SIX SIGMA Introduction level for Green Belts Six Sigma Overview – Presentation 2014Q1 Linked In - Ahmed El-Askalany, CSTE, CSQA, PMP, CQIA, ITIL | LinkedIn https://www.facebook.com/EdgeConsultancyInc E-mail: EdgeConsultancyInc@Gmail.com
  • 2.
  • 3.
    Consumer Driven 6-Sigmais a tool that significantly improves customer satisfaction and shareholder value by reducing variability in every aspect of our business. “6-Sigma is not something else that you do … it is what you do.” 3
  • 4.
    • Consumer Driven6-Sigma tools will be used to attain World Class performance in both short-term and long-term customer satisfaction. • Progress toward these performance goals will be made as Green Belts and Black Belts apply 6-Sigma tools to correct issues that impact customer satisfaction. 4
  • 5.
    Motorola implemented aquality improvement program in 1982.  Quality improvement efforts pointed to the need for improved analytical tools.  6-Sigma tools were developed.  Motorola won the Malcolm Baldrige Award in 1988. 5
  • 6.
  • 7.
    Companies that haveimplemented 6-Sigma include:  ABB Inc.  Allied Signal  American Express  Bombardier  Bank Of America  DuPont  General Electric  Lockheed Martin  Motorola  Nokia  Polaroid  Raytheon  Sony  Texas Instruments 7
  • 8.
    Defects per million opportunities 2308,537 3 66,807 4 6,210 5 233 6 3.4 Most North American Companies Texas Instruments & Motorola are here 8
  • 9.
  • 10.
  • 11.
  • 12.
  • 13.
     WEEK 1 DEFINEAND MEASURE • Six Sigma Overview and the DMAIC road map • Process Mapping • Quality function deployment • Failure mode and effect analysis • Organizational effectiveness concepts, such as team development • Basis stats using Minitab • Process capabilities • Measurement system analysis  WEEK 2 ANALYZE • Statistical thinning • Hypothesis testing and confidence intervals • Correction analysis • Multivariate and regression analysis WEEK 3 IMPROVE • Analysis of Variance • Design of experiment factorial experiment fractional experiment balanced block design response surface design  WEEK 4 CONTROL • Control plans • Mistake proofing • Special applications: discrete parts, continuous process, administration, design • Final Exercise 14
  • 14.
    Executive Leadership (Part-Time) MasterBlack Belts (Full-Time) Project Champions (Part-Time) Black Belts (Full-Time) Green Belts (Part-Time) 15
  • 15.
     Participate inlarger Black Belt DMAIC projects  Lead Green Belt level 6-Sigma Projects  Apply 6-Sigma problem-solving tools and principles to daily work Specific details regarding the deployment and role of Green Belts are determined by each organization. 16
  • 16.
     Roles - Leadand teach the Consumer Driven 6-Sigma process - Train Green Belts  Requirements - Complete 4-6 projects annually that:  Address customer satisfaction – a 70% reduction in Defects Per Million Opportunities (DPMO) AND  Produce a $250K cost savings/profit enhancement average per project. This will include: - Hard annual Profit Before Tax (PBT) - Thing Gone Wrong (TGW) revenue impact 17
  • 17.
     Responsible forBlack Belt, Master Black Belt and Leadership training  Assist Black Belt activities through coaching and counseling techniques  Responsible for leading large projects with multiple Black Belts to completion 18
  • 18.
     Accountable forperformance of Black Belts and results of projects  Responsible for selection, scoping, and successful completion of Black Belt projects  Remove roadblocks for Black Belts and ensure timely completion of projects 19
  • 19.
    Drives Consumer Driven6-Sigma process to meet key business goals and integrates it into everyday management practice. 20
  • 20.
     Does theproject have recurring events?  Is the scope of the project narrow?  Do metrics exist? Can measurements be established in an appropriate amount of time?  Do you have control of the process?  Does the project improve Customer Satisfaction? If “Yes” to all of the above, the project is an excellent candidate for a Consumer Driven 6-Sigma Project. 21
  • 21.
    STAGE BREAKTHROUGH STRATEGY PHASE OBJECTIVES IdentificationRecognize Define Identify key business issue in quality, price & delivery 1) Process capability 2) Amount of variation in process affecting: - Cost - Cycle time - Number of defects Characterization Measure Analyze Understand current performance levels  Measure & analyze where current Process is & where the organization would like them to be in order to meet organization goals for product & service.  Create detailed process flow diagram  Estimate what short-time & long-time process capability Optimization Improve Control Achieve breakthrough improvement  Do a Pareto through DOE  Improve & control key variables that have the greatest influence on the process Institutionalization Standardize Integrate  Examine how smaller projects affect the larger, high level projects that run the day-to-day business  Learn what measures & metrics drive improvement(s)  Standardize best practices within & across business GreenBelt Project 22
  • 22.
  • 23.
  • 24.
    The selection ofperformance characteristics critical in meeting the customer’s expectations. 25
  • 25.
    The creation andvalidation of a measurement system. 26
  • 26.
    The identification ofsources of variation from the performance objectives. 0 2 4 6 8 10 12 14 1 2 3 4 5 6 7 XXXX 0 5 10 15 1 2 3 4 5 6 7 0 5 10 15 1 2 3 4 5 6 7 0 5 10 15 1 4 7 0 5 10 15 1 4 7 1 2 3 4 5 6 7 S1 S2 0 2 4 6 8 10 27
  • 27.
    The discovery ofprocess relationships and the establishment of new procedures. 28
  • 28.
    The monitoring ofimplemented improvements to maintain gains and ensure corrective actions are taken when necessary. 29
  • 29.
     Define theproblem with a High-Level Problem Statement  Specifically identify the process of product customers impacted by the problem.  Define CTQ’s (Critical to Quality) characteristics from the customer’s point of view  Scope the project to a specific actionable level  Develop a refined Problem Statement  Document the Define Phase activities in a Project Charter Define Problem Identify Customer Identify CTQ’s Map Process Refine Subject Scope Update Project Charter 30
  • 30.
     Problem Statement CTQ  Project Scope  Process Mapping  Project Charter Define Problem Identify Customer Identify CTQ’s Map Process Refine Subject Scope Update Project Charter 31
  • 31.
     Measurement  Variation Data  Data Collection Plan  Measurement System Analysis  Capability Analysis Identify Measurement & Variation Determine Data Type Develop Data Collection Plan Perform Measurement System Analysis Perform Data Collection Perform Capability Analysis 32
  • 32.
     Define processmeasures  Identify the types, sources and causes of variation in process  Determine data requirement for a 6-Sigma project  Develop a Data Collection Plan  Perform Measurement System Analysis (MSA)  Conduct Data Collection  Determine the baseline capability of the project as a Sigma value Identify Measurement & Variation Determine Data Type Develop Data Collection Plan Perform Measurement System Analysis Perform Data Collection Perform Capability Analysis 33
  • 33.
     All repetitiveactivities of a process have a certain amount of fluctuation  Input, process, and output measures also fluctuate  This fluctuation is called variation Identify Measurement & Variation Determine Data Type Develop Data Collection Plan Perform Measurement System Analysis Perform Data Collection Perform Capability Analysis 34
  • 34.
  • 35.
    Identify Measurement & Variation Determine Data Type Develop Data Collection Plan Perform Measurement System Analysis Perform Data Collection Perform Capability Analysis The purposeof performing a Measurement System Analysis is to ensure the information collected is a true representation of what is occurring in the process. 36
  • 36.
     Graphical Analysis Root Cause  Root Cause Verification Review Analysis Tools Apply Graphical Analysis Tools Attribute Data * Pareto Variable Data * Run Chart * Histogram * Scatter Plot Identify Sources of Variation 37
  • 37.
     A setof tools that produce a graphical representation of data based on a chosen set of parameters.  These tools include: Attribute Data - Pareto Chart Variable Data - Run Chart - Histogram - Scatter Plot Review Analysis Tools Apply Graphical Analysis Tools Attribute Data * Pareto Variable Data * Run Chart * Histogram * Scatter Plot Identify Sources of Variation 38
  • 38.
     Improvement Alternatives Pilot  Validation  “Should Be/Future State” Process Map  Cost/Benefit Generate Improvement Alternatives Pilot Validate Improvement Create “Should Be/ Future State” Process Map Perform Cost/Benefit Analysis 39
  • 39.
    Generate Improvement Alternatives Pilot Validate Improvement Create “Should Be/ Future State” ProcessMap Perform Cost/Benefit Analysis  Lead a brainstorming activity  Create a “Should Be/Future State” process map  List the steps required for updating the FMEA  Perform a Cost/Benefit Analysis on a process improvement  Lead a process improvement pilot  Analyze process capability to validate improvement gains 40
  • 40.
     Prevention vs.Detection  Visual Factory  Long-Term MSA  Control Plan  Reaction Plan Develop Control Strategy Develop Control Plan Update SOP & Training Plan 41
  • 41.
    Develop Control Strategy Develop Control Plan Update SOP & Training Plan Controlis a means of sustaining improvement by either eliminating the opportunity for deft or monitoring process improvement using a feedback system. 42
  • 42.
    Develop Control Strategy Develop Control Plan Update SOP & Training Plan Establisha strategy to ensure that Improvements are sustained. 43