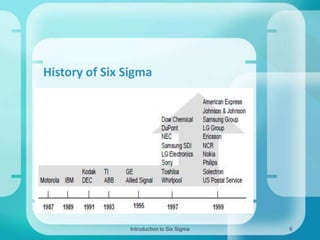
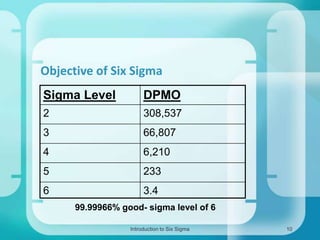
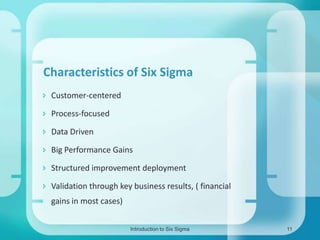
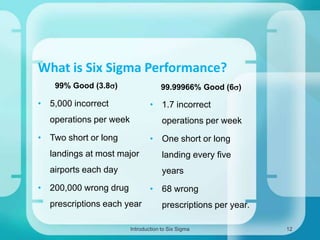
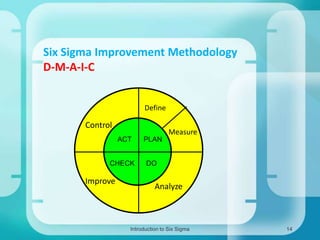
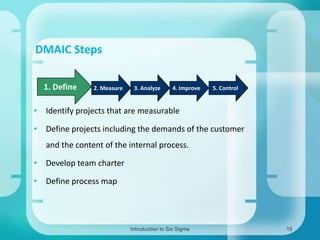
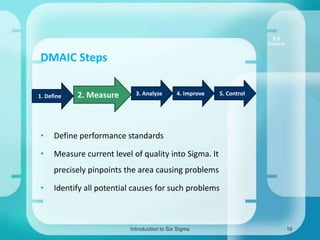
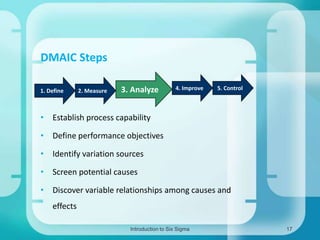
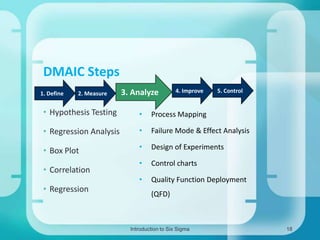
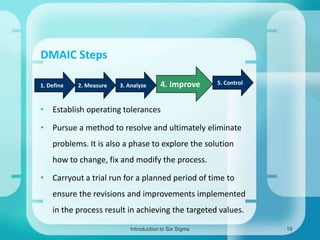
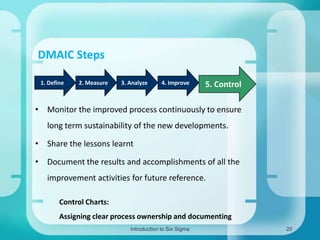
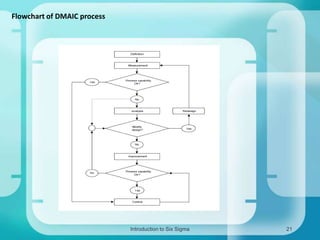
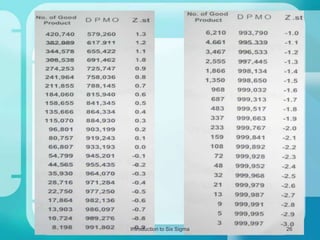
Introduction to

Presented by:
Ayush Shakya
Neeti Kumar
Rashmikat Jha
BFT- V (2011-15)
What is Six Sigma?
 3.4 defects per million opportunities
 Philosophy that changes the way of thinking within a

company
 Business strategy that brings a company to
competitive edge

 Business Improvement Methodology
Introduction to Six Sigma

2
What does Six Sigma mean
practically?
 Defect reduction
 Yield improvement
 Improved customer satisfaction
 Higher net income

 Continual improvement

Introduction to Six Sigma

3
Six Sigma Evolution
 Carl Frederick Gauss ( 1777-1855) introduced the concept of
the normal curve
 As a measurement standard in 1920’s, Walter Shewhart

showed three sigma is the point from the mean where a
process requires correction
 1970’s: Mikel Harry, a senior staff engineer at Motorola’s

Government Electronics Group began to formulate a method
for applying six sigma throughout Motorola
Introduction to Six Sigma

4
History of Six Sigma: Motorola
 In 1987 when Bob Galvin was the Chairman , Six Sigma was
started as a methodology in Motorola.
 Bill smith , an engineer, and Mikel Harry together devised a
6 step methodology with the focus on defect reduction and
improvement in yield through statistics
 The term “Six Sigma” was coined by Bill Smith, who is now
called Father of Six Sigma
 The company saved $ 16 billion in 10 years.
Introduction to Six Sigma

5
History of Six Sigma

Introduction to Six Sigma

6
Six Sigma
 Performing at sigma level of six means that difference
between mean and specific limit is six times the

standard deviation.

Introduction to Six Sigma

7
The Normal Distribution
 Generated as a result of a process experiencing random
variation
 Characterized by mean and standard deviation

Introduction to Six Sigma

8
Measuring variation using standard deviation

Introduction to Six Sigma

9
Objective of Six Sigma
Sigma Level

DPMO

2

308,537

3

66,807

4

6,210

5

233

6

3.4
99.99966% good- sigma level of 6
Introduction to Six Sigma

10
Characteristics of Six Sigma
 Customer-centered
 Process-focused
 Data Driven
 Big Performance Gains
 Structured improvement deployment
 Validation through key business results, ( financial
gains in most cases)
Introduction to Six Sigma

11
What is Six Sigma Performance?
99% Good (3.8s)

99.99966% Good (6s)

• 5,000 incorrect

• 1.7 incorrect

operations per week

operations per week

• Two short or long

• One short or long

landings at most major

landing every five

airports each day

years

• 200,000 wrong drug

• 68 wrong

prescriptions each year

prescriptions per year.

Introduction to Six Sigma

12
Six Sigma : The Projects
•

Projects are linked to the Strategic Plan

•

Projects prioritized based on value to the business, resources
required, and timing
– Yield improvement

– Waste reduction
– Capacity-productivity improvement
– Cycle time reduction

•

Projects are formally tracked

•

Team Leader and Management are held accountable
Introduction to Six Sigma

13
Six Sigma Improvement Methodology
D-M-A-I-C
Define

Control

Measure
ACT

CHECK

Improve

PLAN
DO

Analyze

Introduction to Six Sigma

14
DMAIC Steps
1. Define

2. Measure

3. Analyze

4. Improve

5. Control

• Identify projects that are measurable
• Define projects including the demands of the customer
and the content of the internal process.

• Develop team charter
• Define process map

Introduction to Six Sigma

15
5.0
Control

DMAIC Steps
1. Define

2. Measure

3. Analyze

4. Improve

•

Define performance standards

•

5. Control

Measure current level of quality into Sigma. It
precisely pinpoints the area causing problems

•

Identify all potential causes for such problems

Introduction to Six Sigma

16
DMAIC Steps
1. Define

2. Measure

3. Analyze

4. Improve

5. Control

• Establish process capability
• Define performance objectives
3.0
• Identify variation sources
Analyze

• Screen potential causes
• Discover variable relationships among causes and
effects
Introduction to Six Sigma

17
DMAIC Steps
1. Define

2. Measure

3. Analyze

4. Improve

5. Control

• Hypothesis Testing

•

Process Mapping

• Regression Analysis

•

Failure Mode & Effect Analysis

• Box Plot

•

Design of Experiments

•

Control charts

•

Quality Function Deployment

• Correlation
• Regression

(QFD)

Introduction to Six Sigma

18
DMAIC Steps
1. Define

2. Measure

3. Analyze

4. Improve

5. Control

• Establish operating tolerances
• Pursue a method to resolve and ultimately eliminate
problems. It is also a phase to explore the solution
how to change, fix and modify the process.
• Carryout a trial run for a planned period of time to

ensure the revisions and improvements implemented
in the process result in achieving the targeted values.
Introduction to Six Sigma

19
DMAIC Steps
1. Define

2. Measure

3. Analyze

4. Improve

5. Control

• Monitor the improved process continuously to ensure
long term sustainability of the new developments.

• Share the lessons learnt
• Document the results and accomplishments of all the
improvement activities for future reference.
Control Charts:
Assigning clear process ownership and documenting
Introduction to Six Sigma

20
Flowchart of DMAIC process

Introduction to Six Sigma

21
Key Terms
Y’s
• Key process output variable
• Thought of in terms of performance/defect measures
X’s
• Key process input variable
• Are a list of variables that influence the response(s)
or Y’s
• Y is a function of the X’s or
Y = f(X1, X2, …)
The goal of six sigma is to understand the X’s that control the Y’s.

Introduction to Six Sigma

22
Y = f(X1, X2, …)

Suppliers

Inputs

x

x

Outputs

Customers

x
Process

X’s, Inputs
•Process variables
•Inputs to the process
•Essential actions to
achieve strategic goals
•Key influences on
customer satisfaction

Y’s, Outputs
•Customer requirements
•Yield, Waste, Rate
•On Time Delivery
•Economic Profit
•Strategic goal
•Customer satisfaction

Introduction to Six Sigma

23
Sigma level calculation

DPMO = DPU * 1,000,000 / OFE
• DPMO – Defects per million opportunities
• DPU – defects per unit
= No. of defects / No. of pieces inspected

• OFE – Opportunities for error per unit
= No. of characteristics inspected per unit

Sigma level = Value of Zst from the Sigma level and
DPMO table

Introduction to Six Sigma

24
Introduction to Six Sigma

25
Introduction to Six Sigma

26
THANK YOU

Introduction to Six Sigma

27

Six sigma

  • 1.
    Introduction to Presented by: AyushShakya Neeti Kumar Rashmikat Jha BFT- V (2011-15)
  • 2.
    What is SixSigma?  3.4 defects per million opportunities  Philosophy that changes the way of thinking within a company  Business strategy that brings a company to competitive edge  Business Improvement Methodology Introduction to Six Sigma 2
  • 3.
    What does SixSigma mean practically?  Defect reduction  Yield improvement  Improved customer satisfaction  Higher net income  Continual improvement Introduction to Six Sigma 3
  • 4.
    Six Sigma Evolution Carl Frederick Gauss ( 1777-1855) introduced the concept of the normal curve  As a measurement standard in 1920’s, Walter Shewhart showed three sigma is the point from the mean where a process requires correction  1970’s: Mikel Harry, a senior staff engineer at Motorola’s Government Electronics Group began to formulate a method for applying six sigma throughout Motorola Introduction to Six Sigma 4
  • 5.
    History of SixSigma: Motorola  In 1987 when Bob Galvin was the Chairman , Six Sigma was started as a methodology in Motorola.  Bill smith , an engineer, and Mikel Harry together devised a 6 step methodology with the focus on defect reduction and improvement in yield through statistics  The term “Six Sigma” was coined by Bill Smith, who is now called Father of Six Sigma  The company saved $ 16 billion in 10 years. Introduction to Six Sigma 5
  • 6.
    History of SixSigma Introduction to Six Sigma 6
  • 7.
    Six Sigma  Performingat sigma level of six means that difference between mean and specific limit is six times the standard deviation. Introduction to Six Sigma 7
  • 8.
    The Normal Distribution Generated as a result of a process experiencing random variation  Characterized by mean and standard deviation Introduction to Six Sigma 8
  • 9.
    Measuring variation usingstandard deviation Introduction to Six Sigma 9
  • 10.
    Objective of SixSigma Sigma Level DPMO 2 308,537 3 66,807 4 6,210 5 233 6 3.4 99.99966% good- sigma level of 6 Introduction to Six Sigma 10
  • 11.
    Characteristics of SixSigma  Customer-centered  Process-focused  Data Driven  Big Performance Gains  Structured improvement deployment  Validation through key business results, ( financial gains in most cases) Introduction to Six Sigma 11
  • 12.
    What is SixSigma Performance? 99% Good (3.8s) 99.99966% Good (6s) • 5,000 incorrect • 1.7 incorrect operations per week operations per week • Two short or long • One short or long landings at most major landing every five airports each day years • 200,000 wrong drug • 68 wrong prescriptions each year prescriptions per year. Introduction to Six Sigma 12
  • 13.
    Six Sigma :The Projects • Projects are linked to the Strategic Plan • Projects prioritized based on value to the business, resources required, and timing – Yield improvement – Waste reduction – Capacity-productivity improvement – Cycle time reduction • Projects are formally tracked • Team Leader and Management are held accountable Introduction to Six Sigma 13
  • 14.
    Six Sigma ImprovementMethodology D-M-A-I-C Define Control Measure ACT CHECK Improve PLAN DO Analyze Introduction to Six Sigma 14
  • 15.
    DMAIC Steps 1. Define 2.Measure 3. Analyze 4. Improve 5. Control • Identify projects that are measurable • Define projects including the demands of the customer and the content of the internal process. • Develop team charter • Define process map Introduction to Six Sigma 15
  • 16.
    5.0 Control DMAIC Steps 1. Define 2.Measure 3. Analyze 4. Improve • Define performance standards • 5. Control Measure current level of quality into Sigma. It precisely pinpoints the area causing problems • Identify all potential causes for such problems Introduction to Six Sigma 16
  • 17.
    DMAIC Steps 1. Define 2.Measure 3. Analyze 4. Improve 5. Control • Establish process capability • Define performance objectives 3.0 • Identify variation sources Analyze • Screen potential causes • Discover variable relationships among causes and effects Introduction to Six Sigma 17
  • 18.
    DMAIC Steps 1. Define 2.Measure 3. Analyze 4. Improve 5. Control • Hypothesis Testing • Process Mapping • Regression Analysis • Failure Mode & Effect Analysis • Box Plot • Design of Experiments • Control charts • Quality Function Deployment • Correlation • Regression (QFD) Introduction to Six Sigma 18
  • 19.
    DMAIC Steps 1. Define 2.Measure 3. Analyze 4. Improve 5. Control • Establish operating tolerances • Pursue a method to resolve and ultimately eliminate problems. It is also a phase to explore the solution how to change, fix and modify the process. • Carryout a trial run for a planned period of time to ensure the revisions and improvements implemented in the process result in achieving the targeted values. Introduction to Six Sigma 19
  • 20.
    DMAIC Steps 1. Define 2.Measure 3. Analyze 4. Improve 5. Control • Monitor the improved process continuously to ensure long term sustainability of the new developments. • Share the lessons learnt • Document the results and accomplishments of all the improvement activities for future reference. Control Charts: Assigning clear process ownership and documenting Introduction to Six Sigma 20
  • 21.
    Flowchart of DMAICprocess Introduction to Six Sigma 21
  • 22.
    Key Terms Y’s • Keyprocess output variable • Thought of in terms of performance/defect measures X’s • Key process input variable • Are a list of variables that influence the response(s) or Y’s • Y is a function of the X’s or Y = f(X1, X2, …) The goal of six sigma is to understand the X’s that control the Y’s. Introduction to Six Sigma 22
  • 23.
    Y = f(X1,X2, …) Suppliers Inputs x x Outputs Customers x Process X’s, Inputs •Process variables •Inputs to the process •Essential actions to achieve strategic goals •Key influences on customer satisfaction Y’s, Outputs •Customer requirements •Yield, Waste, Rate •On Time Delivery •Economic Profit •Strategic goal •Customer satisfaction Introduction to Six Sigma 23
  • 24.
    Sigma level calculation DPMO= DPU * 1,000,000 / OFE • DPMO – Defects per million opportunities • DPU – defects per unit = No. of defects / No. of pieces inspected • OFE – Opportunities for error per unit = No. of characteristics inspected per unit Sigma level = Value of Zst from the Sigma level and DPMO table Introduction to Six Sigma 24
  • 25.
  • 26.
  • 27.