Downloaded 189 times


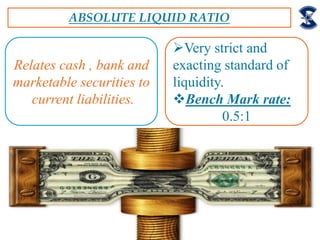
![ABSOLUTE LIQUID RATIO
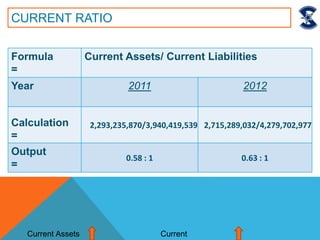
Formula
=
[Cash + Bank+ Marketable Securities]
Current Liabilities
Years 2011 2012
Calculation
=
140,776,990 79,861,668
4,27,97,02,977 3,94,04,19,539
Output
=
0.04:1 0.02:1](https://image.slidesharecdn.com/rvrwkufkssgnwejfvz10-140601055825-phpapp02/85/Sitara-chemical-industry-hj-22-320.jpg)

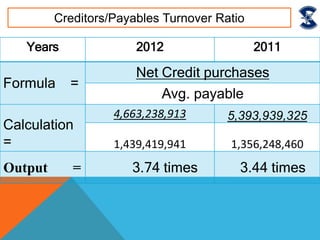
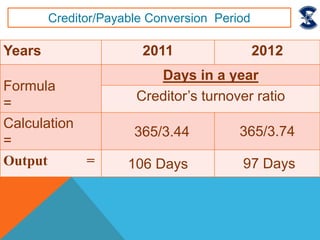
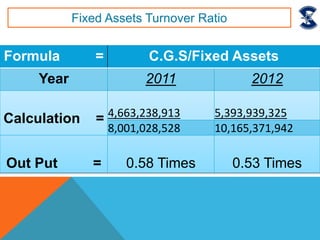
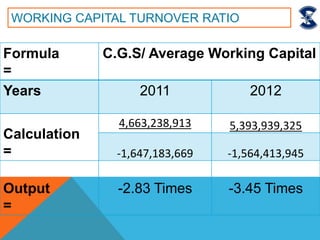

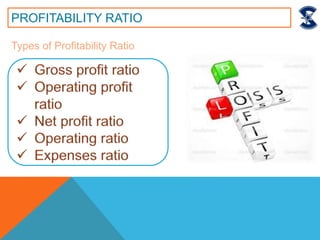
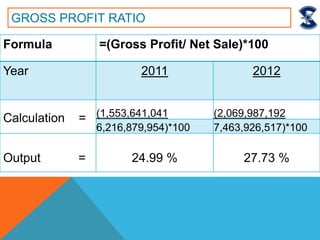

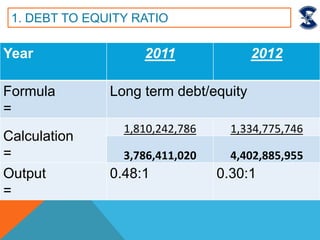
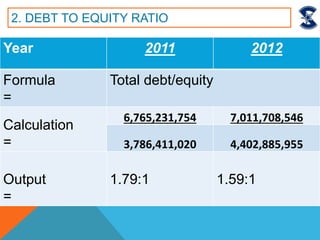
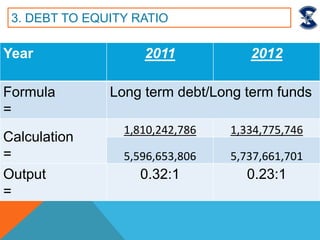
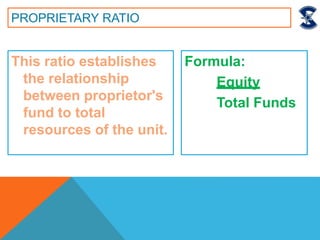
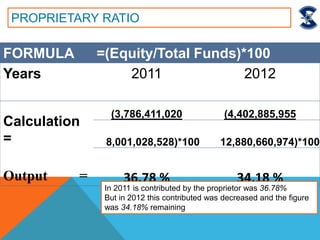


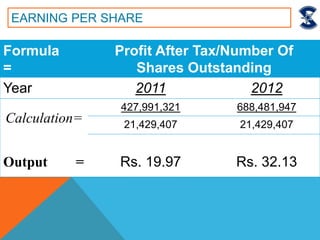

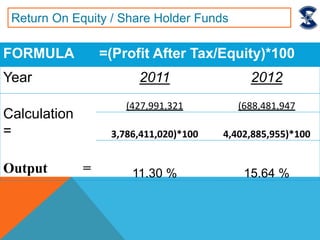


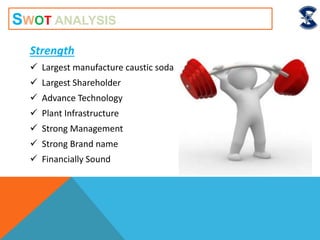
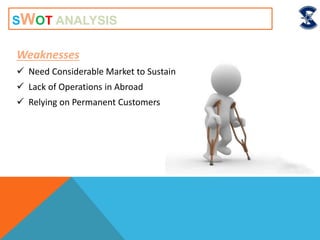
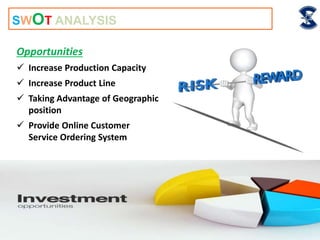


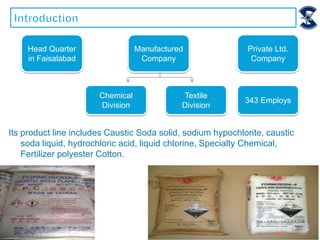
Sitara Chemical Industries Ltd is a Pakistani chemical manufacturer founded in 1981. It produces chemicals like caustic soda, chlorine, and fertilizers. The document discusses the company's vision, mission, businesses, objectives, financial ratios analyzing liquidity, activity, profitability, and solvency. It also presents a SWOT analysis and recommendations to increase production capacity, product lines, and provide online customer services. The ratio analysis shows some ratios decreased or increased compared to the previous year. Overall, the company has a strong market position but needs measures to maintain its profitability.


