Downloaded 205 times

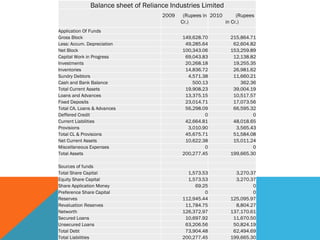
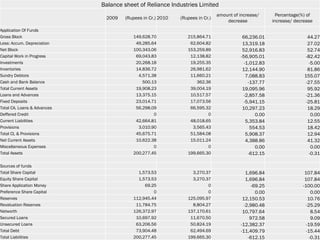
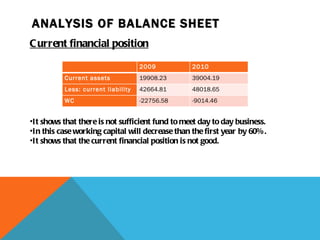


Reliance Industries Ltd is an Indian conglomerate founded as a textile company by Dhirubhai Ambani. The company has diversified into petrochemicals, oil and gas exploration, refining and other industries. The balance sheet comparison from 2009 to 2010 shows an increase in total assets but a decrease in total liabilities. Key increases include net block, inventories and debtors. However, capital work in progress and unsecured loans decreased significantly. The current financial position is assessed as weak due to negative working capital in both years.


