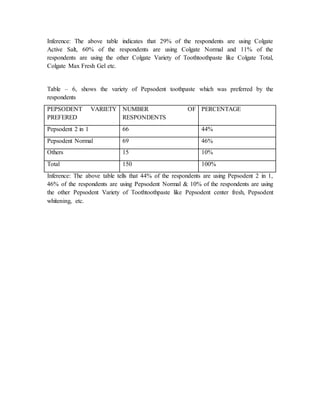
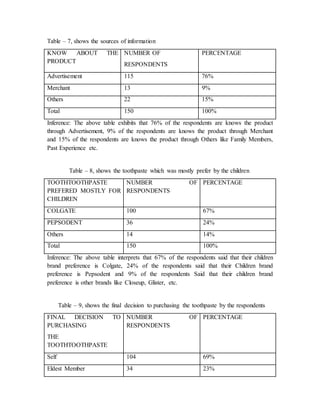
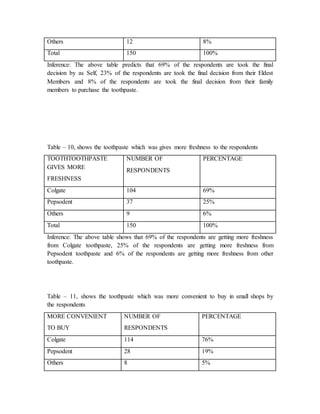
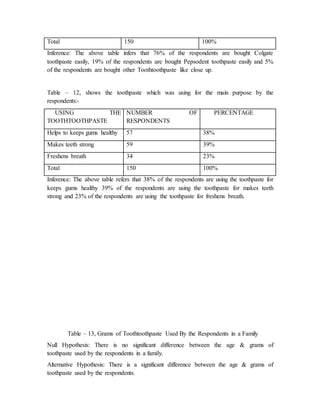
A COMPARATIVE STUDY ON CONSUMER BEHAVIOR ABOUT
COLGATE AND PEPSODENT TOOTHPASTEIN INDORE
INTRODUCTION
PROFILE OF COLGATE – PALMOLIVE COMPANY: LAUNCHED IN 1806: Colgate
– Palmolive Company, together with its subsidiaries, engages in the manufacture and
marketing of consumer products worldwide. It operates in two segments, oral, personal,
homecare and pet nutrition. The oral, personal & home care segment offers tooth
toothpaste, toothbrushes, mouth rinses, dental floss, and pharmaceutical products for
dentists & other oral health professionals; shower gels, shampoo, conditioners,
deodorants & antiperspirants; & liquid hand soaps; and dishwashing liquids, household
cleaners ,oil soaps & fabric conditions. The pet nutrition segment produces pet nutrition
products for dogs & cats. The company sell sits products to wholesale & retail
distributors, and to veterinarians and specialty pet retailers. Colgate – Palmolive was
founded in 1806 and is headquartered in New York, New York. Colgate introduced
Cashmere Bouquet, a perfumed soap. Colgate Dental Cream Colgate Total 12Colgate
Sensitive Colgate ,Max Fresh Colgate ,Kids Toothtoothpaste ,Colgate Fresh Energy ,Gel ,
Herbal Colgate ,Cibaca Family, Protection Colgate ,Advanced Whitening Colgate Active,
Salt Colgate Whitening.
PROFILE OF PEPSODENT – HINDUSTAN UNILEVER LIMITED: LAUNCHED IN
1993:
Pepsodent is a brand of toothpaste with a wintergreen flavor. It was formerly owned by
Unilever (but, since 2003, by Church and Dwight in USA,).Pepsodent was a very popular
brand before the mid '50s, but its makers were low to add fluoride to its formula to
counter the rise of other highly promoted brands such as Crest and Gleem toothpaste by
Procter & Gamble, and Colgate's eponymous product; sales of Pepsodent plummeted.
Today Pepsodent is a “value brand” marketed primarily in discount stores and retails for
roughly half the price of similarly-sized tubes of Crest or of Colgate. Complete + Gum
Care Complete 12 Pepsodent, Herbal Pepsodent, Pepsodent Milk Teeth Orange,
Pepsodent Milk Teeth, StrawberryPepsodent, Sensitive Pepsodent, Whitening Pepsodent
Cavity Prevention.
CONSUMER BEHAVIOUR: The field of consumer behavior is the study of individuals,
groups, or organizations and the process they use to select, secure, use, and dispose of
products, services, experiences, or ideas to satisfy needs and the impacts that these
processes have on the consumer and society. This view of consumer behavior is broader
than the traditional one, which focused much more on the buyer and the immediate
antecedents and consequences of the purchasing process. This view will lead us to
examine indirect influences on consumption decisions as well as consequences that
involve more than the purchaser and seller.
The opening examples summarize several attempts to apply an understanding of
consumer behavior in order to develop an effective marketing strategy, to regulate a
marketing practice, or to cause socially desirable behavior. The examples cited reveal
four main facts about the nature of our knowledge of consumer behavior. First, successful
marketing decisions by commercial firms, nonprofit organizations, and regulatory
agencies require extensive information on consumer behavior. It should be obvious from
these examples that organizations are applying theories and information about consumer
behavior on a daily basis. Knowledge of consumer behavior is critical for influencing not
only product purchase decisions but decisions about which college to attend, which
charities to support how much recycling to do, or whether to seek help for an addition or
Behavioral problem.
The examples also indicate the need to collect information about the specific consumers
involved in the marketing decision at hand. At its current state of development, consumer
behavior theory provides the manager with the proper questions to ask. However, given
the importance of the specific situation and product category in consumer behavior, it
will often be necessary to conduct research to answer these questions. One executive
explains the importance of consumer behaviorresearch this way:
Understanding and properly interpreting consumer wants is a whole lot easier said than
done. Every week our marketing researchers talk to more than 400 consumers to find out,
they think of our products and those of our competitors.
Today, as never before, we cannot take our business for granted. That’s why
understanding and therefore learning to anticipate - consumer behavior is our key to
planning and managing in this ever - changing environment.
The examples also indicate that consumer behavior is a complex, multidimensional
process. The center for Media
Education, the American Legacy Foundation, and P & G have invested millions of
dollars researching consumer behavior and much more trying to influence it, yet none of
them are completely successful. It is important to note that all marketing decisions and
regulations are based on assumptions about consumer behavior. It is impossible to think
of a marketing decision for which this is not the case. For example, regulations designed
to protect children from various marketing practices on the Web must be based on
assumptions about children’s ability to process information and make decisions in this
environment. Likewise, a decision to match a competitor’s price reduction must be based
on some assumption about how consumers evaluate prices and how they would respond
to a price differential between the two brands.
An advertisement targeted at the same consumers. But assumptions about consumer
behavior are differ from one advertisement to another advertisement.
The term consumer behavior refers to the behavior that consumer displays in searching
for purchasing using, evaluating, disposing of product and services that they expect will
satisfy their needs. The study of consumer behavior is the study of consumer how
individual make decision to spend the available resources (time, money, effort) on
consumption of items. It includes the study of what they buy, why they buy, when the
buy it, where the buy it, how often they buy it and use it.
The field of consumer behavior holds great interest for us as consumer, as marketers and
as scholars of human behavior. As consumption we benefit from in right into our
consumption related to the designers what we buy, why we buy, how we buy and
promotional influences that persuade us do buy. The study of consumer behavior enables
us to become better that is wiser consumers.
We purchase goods, due to certain motives. Motives may refer to thought, strong
feelings, urge, motion, drive etc. Which make a buyer to react in the form of a decision.
Any urge which makes a person to take purchase decision is called as buying motive.
Motive is an inner urge which moves one to action. It is not a mere desire to buy.
OBJECTIVE OF THE STUDY
REVIEW OF LITERATURE:
1. Consumer behavior:
Consumer behavior has been always of great interest to marketers. The knowledge of
consumer behavior helps the marketer to understand how consumers think, feel and select
from alternatives like products, brands and the like and how the consumers are influenced
by their environment, the reference groups, family, and salespersons and so on. A
consumer’s buying behavior is influenced by cultural, social, personal and psychological
factors. Most of these factors are uncontrollable and beyond the hands of marketers but
they have to be considered while trying to understand the complex behavior of the
consumers. In this study, the researcher emphasizes the importance of lifestyle and its
impact on the buyer behavior.
2. Consumer Personality Factors:
There are two factors mainly influencing the consumers for decision making: Risk
aversion and innovativeness. Risk aversion is a measure of how much consumers need to
be certain and sure of what they are purchasing (Donthu and Gilliland, 1996).Highly risk
adverse consumers need to be very certain about what they are buying. Whereas less risk
adverse consumers can tolerate some risk and uncertainty in their purchases. The second
variable, innovativeness, is a global measure which captures the degree to which
consumers are willing to take chances and experiment with new ways of doing things
(Donthu and Gilliand,1996).The shopping motivation literature is abound with various
measures of individual characteristics (e.g., innovative, venturesome, cosmopolitan,
variety seeking, therefore, innovativeness and risk aversion were included in this study to
capture several of these traits. Measures by Donthu and Gilliland (1996) were used to
measure innovativeness and risk a version.
3. Perception:
Perception is a mental process, whereby an individual selects data or information from
the environment, organizes it and then draws significance or meaning from it.
4. Perceived fit:
It is an attitudinal measure of how appropriate a certain channel of distribution is for a
specific product .Morrison and Roberts (1998) found that consumer’s perception of the fit
between a service/product and a channel is very influential in determining whether they
will consider using that channel for a specific service. In fact, perceived fit was found to
be more important than consumer’s preferences for the distribution method or service.
5. Product Class knowledge:
Product class knowledge is a measure of consumers perceptions of how much they
know about a specific class of products (example; cars) This type of measure is consistent
with what Brucks(1985) called subjective knowledge, that is, consumers self-perceptions
of knowledge levels. This is often contrasted with objective knowledge, which is what
consumers actually know. Park and Lessing (1981) proposed that subjective knowledge
provides a better understanding of consumers decision making processes because
consumers level of confidence in their search and decision making behavior, independent
of their objective knowledge.
6. Product type:
Past research indicates that consumer’s purchase and channel decisions might be
influenced by the type of product being investigated (Cox and Rich 1964: Lumpkin and
Hawes 1985;Morrison and Roberts
1998: Papadopoulos 1980:Prasad 1975: Sheth 1983: Thompson 1971).In particular, these
authors state 29that certain products might be more appropriate for one channel or
another, which ultimately influences consumers channel preference and choice.
7. Quality:
It is our aim to provide the best product for the consumer and we believethat if the
products have quality the consumer will pay the price, says Amal pramanic, regional
business director.
8. Packaging:
Packaging establishes a direct link with the consumers at the point of purchase as it can
very well change the perceptions they have for a particular brand. A product has to draw
the attention of the consumers through an outstanding packaging design. Earlier
packaging was considered only a container to put a product in, but today, researching to
the right packaging is beginning at the product development stage itself. Packaging
innovation has been at the heart of Dabur’s attempt to rap with the urban consumers. It
spends large sums annually on packaging research.
9. Promotion:
The greatest challenge faced by companies today is holding and increasing
Their market share and value .This is always a strenuous exercise and one of the tools for
the same is marketing. There is no specific game rule available for using these marketing
tools .The reason is: each promotional tool has its own characteristics.
10. Familiarity with a channel:
Consumer’s familiarity with a channel is a measure of the general experience they have
with purchasing products through specific channels (i.e. catalog, internet, and bricks and
mortar retailer). Through frequent use consumers should become accustomed to using the
channel, which reduces their apprehension and anxiety in purchasing products through
the channel.
11. Brand Awareness:
According to Rossiter and Prey (1987), brand awareness precedes all other steps in the
buying process. A brand attitude cannot be performed, unless a consumer is aware of the
brand. In memory theory, brand awareness is positioned as a vital first step in building
the bundle of associations which are attached to the brand in memory (Stokes, 1985).
12. Family influence:
A family exerts a complex influence on the behaviors of its members. Prior family
influence research has focused on intergenerational rather than intergenerational
influence in consumer renationalization. As has been compellingly demonstrated, parents
influence children (Moore, Willkie, and Lutz 2002; Moschis1987).Yet, consumption
domains clearly exist where sibling efforts may also be exerted.
13. Shopping motives:
Shopping motives are defined as consumer’s wants and needs as they relate to outlets at
which to shop. Two groups of motives, functional and nonfunctional, have been proposed
by Sheth (1983). Functional motives are associated with time, place, and possession
needs and refer to rational aspects of channel choice. Whereas nonfunctional motives
relate to social and emotional reasons for patronage .The functional motives included:
convenience, price comparison, and merchandise assortment.
RESEARCH METHODOLOGY
Research Design
The researcher has applied the concept of descriptive research design in this study. This
study tries to describe the prospects perception & attitude towards the toothpaste with
reference to Colgate and Pepsodent. Primary and secondary data was collected for the
study. Sampling
In this study the researcher used convenience sampling. The sample was selected
according to the convenience of the researcher. Sample Size: In this study the
researcher’s sample size is 50.
Tools of analysis
In this study, the researcher used three types of tools they are, Simple Percentage, Chi-
square Technique, and ANOVA Technique. The results of the analysis made in this study
in fully dependent on the correctness of the introduction given by the respondents.
Table – 1, shows the grams of toothpaste used by the respondents in a family
TOOTHTOOTHPASTE
USED (IN GRAMS)
NUMBER OF
RESPONDENTS
PERCENTAGE
50 GRAMS 13 9%
150 GRAMS 108 72%
ABOVE 150 GRAMS 29 19%
TOTAL 150 100%
Inference: The above table predicts that 9% of the respondents are using 50 grams, 72%
of the respondents are using 150 grams and 19% of the respondents are using Above 150
grams of toothpaste.
Table – 2, shows the brand, which was mostly preferred by the respondents
BRAND
(TOOTHTOOTHPASTE)
MOSTLY
PREFER
NUMBER OF
RESPONDENTS
PERCENTAGE
Colgate 105 70%
Pepsodent 33 22%
Others 12 8%
Total 150 100%
Inference: The above table shows that 70% of the respondents are preferred Colgate, 22%
of the respondents are preferred Pepsodent, and 8% of the respondents were got other
toothpaste brands like Glister, Close up, etc.
Table – 3, shows the particular reason for choosing the toothpaste by the respondents
REASON FOR CHOOSE
THE
TOOTHTOOTHPASTE
NUMBER OF
RESPONDENTS
PERCENTAGE
Brand Name 20 13%
QUALITY 126 84%
PRICE 4 3%
TOTAL 150 100%
Inference: The above table infers that 13% of the respondent’s selection was based on
Brand Name, 84% of the respondent’s selection was based on Quality and 3% of the
respondent’s selection was based on Price.
Table – 4, shows the toothpaste which is more affordable to purchase by the
respondents:-
MORE AFFORDABLE TO
PURCHASE
NUMBER OF
RESPONDENTS
PERCENTAGE
Colgate 107 71%
Pepsodent 33 22%
Others 10 7%
Total 150 100%
Inference:The above table refers that 71% of the respondents are more affordable to
purchase the Colgate Toothtoothpaste, 22% of the respondents are more affordable to
purchase the Pepsodent toothpaste& 7% of the respondents are more affordable to
purchase the other brand of toothpaste.
Table – 5, shows the variety of Colgate toothpaste which was preferred by the
respondents:-
COLGATE VARIETY
PREFERED
NUMBER OF
RESPONDENTS
PERCENTAGE
Colgate Active Salt 43 29%
Colgate Normal 90 60%
Others 17 11%
Total 150 100%
Inference: The above table indicates that 29% of the respondents are using Colgate
Active Salt, 60% of the respondents are using Colgate Normal and 11% of the
respondents are using the other Colgate Variety of Toothtoothpaste like Colgate Total,
Colgate Max Fresh Gel etc.
Table – 6, shows the variety of Pepsodent toothpaste which was preferred by the
respondents
PEPSODENT VARIETY
PREFERED
NUMBER OF
RESPONDENTS
PERCENTAGE
Pepsodent 2 in 1 66 44%
Pepsodent Normal 69 46%
Others 15 10%
Total 150 100%
Inference: The above table tells that 44% of the respondents are using Pepsodent 2 in 1,
46% of the respondents are using Pepsodent Normal & 10% of the respondents are using
the other Pepsodent Variety of Toothtoothpaste like Pepsodent center fresh, Pepsodent
whitening, etc.
Table – 7, shows the sources of information
KNOW ABOUT THE
PRODUCT
NUMBER OF
RESPONDENTS
PERCENTAGE
Advertisement 115 76%
Merchant 13 9%
Others 22 15%
Total 150 100%
Inference: The above table exhibits that 76% of the respondents are knows the product
through Advertisement, 9% of the respondents are knows the product through Merchant
and 15% of the respondents are knows the product through Others like Family Members,
Past Experience etc.
Table – 8, shows the toothpaste which was mostly prefer by the children
TOOTHTOOTHPASTE
PREFERED MOSTLY FOR
CHILDREN
NUMBER OF
RESPONDENTS
PERCENTAGE
COLGATE 100 67%
PEPSODENT 36 24%
Others 14 14%
Total 150 100%
Inference: The above table interprets that 67% of the respondents said that their children
brand preference is Colgate, 24% of the respondents said that their Children brand
preference is Pepsodent and 9% of the respondents Said that their children brand
preference is other brands like Closeup, Glister, etc.
Table – 9, shows the final decision to purchasing the toothpaste by the respondents
FINAL DECISION TO
PURCHASING
THE
TOOTHTOOTHPASTE
NUMBER OF
RESPONDENTS
PERCENTAGE
Self 104 69%
Eldest Member 34 23%
Others 12 8%
Total 150 100%
Inference: The above table predicts that 69% of the respondents are took the final
decision by as Self, 23% of the respondents are took the final decision from their Eldest
Members and 8% of the respondents are took the final decision from their family
members to purchase the toothpaste.
Table – 10, shows the toothpaste which was gives more freshness to the respondents
TOOTHTOOTHPASTE
GIVES MORE
FRESHNESS
NUMBER OF
RESPONDENTS
PERCENTAGE
Colgate 104 69%
Pepsodent 37 25%
Others 9 6%
Total 150 100%
Inference: The above table shows that 69% of the respondents are getting more freshness
from Colgate toothpaste, 25% of the respondents are getting more freshness from
Pepsodent toothpaste and 6% of the respondents are getting more freshness from other
toothpaste.
Table – 11, shows the toothpaste which was more convenient to buy in small shops by
the respondents
MORE CONVENIENT
TO BUY
NUMBER OF
RESPONDENTS
PERCENTAGE
Colgate 114 76%
Pepsodent 28 19%
Others 8 5%
Total 150 100%
Inference: The above table infers that 76% of the respondents are bought Colgate
toothpaste easily, 19% of the respondents are bought Pepsodent toothpaste easily and 5%
of the respondents are bought other Toothtoothpaste like close up.
Table – 12, shows the toothpaste which was using for the main purpose by the
respondents:-
USING THE
TOOTHTOOTHPASTE
NUMBER OF
RESPONDENTS
PERCENTAGE
Helps to keeps gums healthy 57 38%
Makes teeth strong 59 39%
Freshens breath 34 23%
Total 150 100%
Inference: The above table refers that 38% of the respondents are using the toothpaste for
keeps gums healthy 39% of the respondents are using the toothpaste for makes teeth
strong and 23% of the respondents are using the toothpaste for freshens breath.
Table – 13, Grams of Toothtoothpaste Used By the Respondents in a Family
Null Hypothesis: There is no significant difference between the age & grams of
toothpaste used by the respondents in a family.
Alternative Hypothesis: There is a significant difference between the age & grams of
toothpaste used by the respondents.
AGE (years) 50 Grams 150 Grams Above 150
grams
Total
Below 35 10 50 16 76
35-50 1 45 7 53
Above 50 2 14 5 21
Total 13 109 28 150
𝜒2 =
𝛴( 𝑂𝑖𝑗 − 𝐸𝑖𝑗)2
𝐸𝑖𝑗
= 14.63
Calculated value = 7.65
5% level of significance = 9.48
Degrees of freedom =4
Interpretation: According to chi-square technique, the calculated value obtained is greater
than the table value. So, the null hypothesis is accepted.
Therefore, it is conclude that, there is no significant difference between the age and brand
preferred by the respondents in a family.
Table – 15. Particular Reason for Purchasing the Toothtoothpaste
Null Hypothesis: There is no significant difference between the age & particular reason
for purchase the toothpaste.
Alternative Hypothesis: There is a significant difference between the age & particular
reason for purchase the toothpaste.
AGE (years) BRAND
NAME
QUALITY PRICE TOTAL
Below 35 13 62 1 76
35-50 7 42 4 53
Above 50 - 21 - 21
Total 106 125 5 150
𝜒2 =
Σ( 𝑂𝑖𝑗−𝐸𝑖𝑗)2
𝐸𝑖𝑗
= 15.82
Calculated value = 15.82
5% level of significance = 9.48
Degrees of freedom = 4
Interpretation: According to chi-square technique, the calculated value obtained is greater
than the table value. So, the null hypothesis is accepted.
Therefore, it is conclude that, there is no significant difference between the age and
particular reason for purchasing the toothpaste.
Table – 16, More Affordable to Purchase the toothpaste
Null Hypothesis: There is no significant difference between the age & affordable to
purchase the toothpaste.
Alternative Hypothesis: There is a significant difference between the age & affordable to
purchase the toothpaste.
AGE(years) Colgate Pepsodent Others Total
Below 35 53 17 6 76
35-50 40 11 2 53
Above 50 14 5 2 21
Total 107 33 10 150
𝜒2 =
( 𝑂𝑖𝑗 − 𝐸𝑖𝑗)2
𝐸𝑖𝑗
= 6.07
Calculated value = 6.07
5% level of significance = 9.48
Degrees of freedom = 4
Interpretation: According to chi-square technique, the calculated value obtained is less
than the table value. So, the null hypothesis is rejected.
Therefore, it is conclude that, there is a significant difference between the age and
affordable to purchase the toothtoothpaste.
Table – 17, Colgate Variety of Toothpaste Preferred by the Respondents
Null Hypothesis: There is no significant difference between the age & Colgate variety of
the toothpaste preferred by the respondents.
Alternative Hypothesis: There is a significant difference between the age & Colgate
variety of the toothpaste preferred by the respondents.
AGE(years) Colgate active
salt
Colgate Normal Others Total
Below 35 23 47 6 76
35-50 16 29 8 53
Above 50 3 15 3 21
Total 42 91 17 150
𝜒2 =
( 𝑂𝑖𝑗 − 𝐸𝑖𝑗)2
𝐸𝑖𝑗
= 4.42
Calculated value = 4.42
5% level of significance = 9.48
Degrees of freedom =4
Interpretation:-According to chi-square technique, the calculated value obtained is less
than the table value. So, the null hypothesis is rejected.
Therefore, it is conclude that, there is a significant difference between the age and
Colgate variety of the toothpaste preferred by the respondents.
Table – 18. Pepsodent Variety of Toothpaste preferred by the Respondents
Null Hypothesis: There is no significant difference between the Age & Pepsodent variety
of toothpaste preferred by the respondents.
Alternative Hypothesis: There is a significant difference between the Age & Pepsodent
variety of toothpaste preferred by the respondents.
AGE(years) Pepsodent Pepsodent 2 in Others Total
normal 1
Below 35 36 35 5 76
35-50 23 22 8 53
Above 50 9 10 2 21
Total 68 67 15 150
𝜒2 =
( 𝑂𝑖𝑗 − 𝐸𝑖𝑗)2
𝐸𝑖𝑗
= 7.42
Calculated value = 7.42
5% level of significance = 9.48
Degrees of freedom = 4
Interpretation: According to chi-square technique, the calculated value obtained is less
than the table value. So, the null hypothesis is rejected.
Therefore, it is conclude that, there is a significant difference between the age and
Pepsodent variety of the toothpaste preferred by the respondents.
Table – 19, Know About the Product by Way of
Null Hypothesis: There is no significant difference between the age & ways to know
about the product by the respondents.
Alternative Hypothesis: There is a significant difference between the age & ways to
know about the product by the respondents.
AGE(years) Advertisement Merchant Others Total
Below 35 66 3 7 76
35-50 37 8 8 53
Above 50 12 2 7 21
Total 115 13 22 150
𝜒2 =
( 𝑂𝑖𝑗 − 𝐸𝑖𝑗)2
𝐸𝑖𝑗
= 20.24
Calculated value = 20.24
5% level of significance = 9.48
Degrees of freedom = 4
Interpretation: According to chi-square technique, the calculated value obtained is greater
than the table value. So, the null hypothesis is accepted.
Therefore, it is conclude that, there is no significant difference between the age and ways
to know product by the respondents.
Table – 20, Toothtoothpaste which is preferred by the Children Mostly
Null Hypothesis: There is no significant difference between the age &toothpaste which is
preferred by the children mostly.
Alternative Hypothesis: There is a significant difference between the age &toothpaste
which is preferred by the children mostly.
AGE(years) Colgate Pepsodent Others Total
Below 35 51 17 8 76
35-50 34 14 5 53
Above 50 15 5 1 21
Total 100 36 14 150
𝜒2 =
( 𝑂𝑖𝑗 − 𝐸𝑖𝑗)2
𝐸𝑖𝑗
= 11.29
Calculated value = 11.29
5% level of significance = 9.48
Degrees of freedom = 4
Interpretation: According to chi-square technique, the calculated value obtained is greater
than the table value. So, the null hypothesis is accepted.
Therefore, it is conclude that, there is no significant difference between the age and
toothpaste which is mostly preferred by the children.
Table – 21, Final Decisions Took By the Respondents While Purchasing the
Toothpaste
Null Hypothesis: There is no significant difference between the age & final decision took
by the respondents while purchasing the toothpaste.
Alternative Hypothesis: There is a significant difference between the age & final decision
took by the respondents while purchasing the toothpaste.
AGE(years) Self Eldest Others Total
Below 35 48 20 8 76
35-5- 44 9 - 53
Above 50 12 5 4 21
Total 104 34 12 150
𝜒2 =
( 𝑂𝑖𝑗 − 𝐸𝑖𝑗)2
𝐸𝑖𝑗
= 11.56
Calculated value = 11.56
5% level of significance = 9.48
Degrees of freedom =4
Interpretation: According to chi-square technique, the calculated value obtained is greater
than the table value. So, the null hypothesis is accepted.
Therefore, it is conclude that, there is no significant difference between the age and final
decision took by the respondents while purchasing the toothpaste.
Table – 22, Toothpaste Which Gives More Freshness to the Respondents
Null Hypothesis: There is no significant difference between the age &toothpaste which
gives more freshness to the respondents.
Alternative Hypothesis: There is a significant difference between the age &toothpaste
which gives more freshness to the respondents.
AGE(years) Colgate Pepsodent Others Total
Below 35 58 14 4 76
35-50 38 12 3 53
Above 50 15 5 1 21
Total 111 31 8 150
𝜒2 =
( 𝑂𝑖𝑗 − 𝐸𝑖𝑗)2
𝐸𝑖𝑗
= 6.7
Calculated value = 6.7
5% level of significance = 9.48
Degrees of freedom =4
Interpretation: According to chi-square technique, the calculated value obtained is less
than the table value. So, the null hypothesis is rejected.
Therefore, it is conclude that, there is a significant difference between the age and
toothpaste which gives more freshness to the respondents.
Table – 23, Toothpaste Which Was More Convenient to Buy In Small Shops
Null Hypothesis: There is no significant difference between the age &toothpaste which is
more convenient to buy in small shops by the respondents.
Alternative Hypothesis: There is a significant difference between the age &toothpaste
which is more convenient to buy in small shops by the respondents.
AGE(Years) Colgate Pepsodent Others Total
Below 35 62 10 4 76
35-50 41 10 2 53
Above 50 15 5 1 21
Total 118 25 7 150
𝜒2 =
( 𝑂𝑖𝑗 − 𝐸𝑖𝑗)2
𝐸𝑖𝑗
= 5.82
Calculated value = 5.82
5% level of significance = 9.48
Degrees of freedom =4
Interpretation: According to chi-square technique, the calculated value obtained is less
than the table value. So, the null hypothesis is rejected.
Therefore, it is conclude that, there is a significant difference between the age and
toothpaste which is more convenient to buy in small shops by the respondents.
Table – 24, Using the Toothpaste by the Respondents
Null Hypothesis: There is no significant difference between the age & using the
toothpaste by the respondents.
Alternative Hypothesis: There is a significant difference between the age & using the
toothpaste by the respondents.
AGE(Years) Healthy gums Strong Teeth Freshen Breath Total
Below 35 34 25 17 76
35-50 19 17 17 53
Above 50 10 11 - 21
Total 63 53 34 150
𝜒2 =
( 𝑂𝑖𝑗 − 𝐸𝑖𝑗)2
𝐸𝑖𝑗
= 12.7
Calculated value = 12.7
5% level of significance = 9.48
Degrees of freedom =4
Interpretation: According to chi-square technique, the calculated value obtained is greater
than the table value. So, the null hypothesis is accepted.
Therefore, it is conclude that, there is no significant difference between the age and using
the toothpaste of the respondents.
Table – 25, Satisfaction towards the Current Pricing of the Toothpaste
Null Hypothesis: There is no significant difference between the age & satisfaction
towards the current pricing of the toothpaste by the respondents.
Alternative Hypothesis: There is a significant difference between the age & satisfaction
towards the current pricing of the toothpaste by the respondents.
AGE(years) Highly
Satisfied
Satisfied Not Satisfied Total
Below 35 2 62 12 76
35-50 5 48 - 53
Above 50 1 16 4 21
Total 8 126 16 150
𝜒2 =
( 𝑂𝑖𝑗 − 𝐸𝑖𝑗)2
𝐸𝑖𝑗
= 12.08
Calculated value = 12.08
5% level of significance = 9.48
Degrees of freedom = 4
Interpretation: According to chi-square technique, the calculated value obtained is greater
than the table value. So, the null hypothesis is accepted.
Therefore, it is conclude that, there is no significant difference between the age and
satisfaction towards the current pricing of the toothpaste.
Table – 26, Satisfaction towards the Toothpaste
Null Hypothesis: There is no significant difference between the age & satisfaction
towards the toothpaste.
Alternative Hypothesis: There is a significant difference between the age & satisfaction
towards the toothpaste.
AGE(years) Highly satisfied Satisfied Not satisfied Total
Below 35 3 72 1 76
35-50 8 45 - 53
Above 50 3 18 - 21
Total 14 135 1 150
𝜒2 =
( 𝑂𝑖𝑗 − 𝐸𝑖𝑗)2
𝐸𝑖𝑗
= 6.13
Calculated value = 6.13
5% level of significance = 9.48
Degrees of freedom = 4
Interpretation: According to chi-square technique, the calculated value obtained is less
than the table value. So, the null hypothesis is rejected.
Therefore, it is conclude that, there is a significant difference between the age and
satisfaction towards the toothpaste.
Table – 27, Times of Using the Toothpaste per Day
Null Hypothesis: There is no significant difference between the age & times of using the
toothpaste per day by the respondents.
Alternative Hypothesis: There is a significant difference between the age & times of
using the toothpaste per day by the respondents.
AGE(years) Once twice Above Twice Total
Below 35 38 38 - 76
35-50 16 35 2 53
Above 50 6 15 - 21
Total 60 88 2 150
𝜒2 =
( 𝑂𝑖𝑗 − 𝐸𝑖𝑗)2
𝐸𝑖𝑗
= 9.54
Calculated value = 9.54
5% level of significance = 9.48
Degrees of freedom = 4
Interpretation: According to chi-square technique, the calculated value obtained is greater
than the table value. So, the null hypothesis is accepted. Therefore, it is conclude that,
there is no significant difference between the age and times of using the toothpaste per
day by the respondents.
Table – 28, Years to Purchase the Particular Toothpaste
Null Hypothesis:There is no significant difference between the age & years to purchase
the toothpaste.
Alternative Hypothesis: There is a significant difference between the age& years to
purchase the toothpaste.
AGE(years) For 1 year For 2 Years For past 2 years Total
Below 35 9 9 58 76
35-50 5 5 43 53
Above 50 2 2 17 21
Total 16 16 118 150
𝜒2 =
( 𝑂𝑖𝑗 − 𝐸𝑖𝑗)2
𝐸𝑖𝑗
= 0.5
Interpretation: According to chi-square technique, the calculated value obtained is less
than the table value. So, the null hypothesis is rejected.
Therefore, it is conclude that, there is a significant difference between the age and years
to purchase the toothpaste.
Table – 29, More Satisfaction towards the Product by the Respondents
Null Hypothesis: There is no significant difference between the age & more satisfaction
towards the product by the respondents.
Alternative Hypothesis: There is a significant difference between the age & more
satisfaction towards the product by the respondents.
AGE(years) Colgate Pepsodent Others Total
Below 35 57 17 2 76
35-50 40 10 3 53
Above 50 15 5 1 21
Total 112 32 6 150
𝜒2 =
( 𝑂𝑖𝑗 − 𝐸𝑖𝑗)2
𝐸𝑖𝑗
= 6.81
Calculated value = 6.81
5% level of significance = 9.48
Degrees of freedom =4
Interpretation: According to chi-square technique, the calculated value obtained is less
than the table value. So, the null hypothesis is rejected. Therefore, it is conclude that,
there is a significant difference between the age and more satisfaction towards the
product by the respondents.
Table – 30, Particular Reason for Switch Over to other Toothpaste in Recent Days by the
Respondents
Null Hypothesis: There is no significant difference between the age & particular reason
for switch over to other toothpaste in recent days.
Alternative Hypothesis: There is a significant difference between the age & particular
reason for switch over to other toothpaste in recent days.
AGE(years) Changed Not changed Total
Below 35 - 76 76
35-50 - 53 53
Above 50 - 21 21
Total - 150 150
Table – 31, the table shows the benefits of using the toothpaste by the respondent.
Benefits of
Consuming The
Toothpaste
Number Of Respondents Rank Percentage
1 2 3 4 5 6 1 2 3 4 5 6
Brand Name 29 55 15 35 10 6 19 37 10 23 7 4
Quality 105 22 11 10 - 2 70 15 7 6 - 2
Price 4 22 54 33 24 13 3 15 36 22 11 10
Quantity 2 39 37 40 17 15 2 25 25 27 11 10
Prestige 8 5 16 19 45 57 5 3 11 13 30 38
Package 2 7 17 13 54 57 1 5 11 9 36 38
Total 150 150 150 150 150 150 100 100 100 100 100 100
Inference
Brand Name: The above table infers exhibits that the 1st rank preferred by 19% of the
respondents 2nd rank preferred by
37% of the respondents, 3rd rank preferred by 10% of the respondents, 4th rank for
preferred by 23% of the respondents, 5th rank preferred by 7% of the respondents & 6th
rank is preferred by 4% of the respondents.
Quality: The above table refers that the 1st rank preferred by 70% of the respondents, 2nd
rank preferred by 15% of the respondents 3rd rank preferred by 7% of the respondents,
4th rank preferred by 6% of the respondents,5th rank preferred by
None of the respondents and 6th rank is preferred by 2% of the respondents.
Price: The above table indicates that the 1st rank preferred by 3% of the respondents, 2nd
rank preferred by 15% of the respondents, 3rd rank is preferred by 36% of the
respondents, 4th rank is preferred by 22% of the respondents, 5th rank is preferred by
16% of the respondents and 6th rank is preferred by 8% of the respondents.
Quantity: The above table tells that the 1st rank preferred by 2% of the respondents, 2nd
rank preferred by 25% of the respondents, 3rd rank is preferred by 25% of the
respondents, 4th rank is preferred by 27% of the respondents, 5th rank is preferred by
11% of the respondents and 6th rank is preferred by 10% of the respondents.
Prestige: The above table exhibits that the 1st rank preferred by 5% of the respondents,
2nd rank preferred by 3% of the respondents, 3rd rank is preferred by 11% of the
respondents, 4th rank is preferred by 13% of the respondents, 5th rank is preferred by
30% of the respondents and 6th rank is preferred by 38% of the respondents.
Package: The above table interprets that the 1st rank preferred by 1% of the respondent,
2nd rank preferred by 5% of the respondents, 3rd rank preferred by 11% of the
respondents, 4th rank preferred by 9% of the respondents, 5th rank preferred by 36% of
the respondents and 6th rank is preferred by 38% of the respondents.
Findings
Demographic factor
Based on this study demographic factor like age, gender, education, status, and income
influence people indirectly for decision making. This is supported by following evidence.
Demographic factors play a major role in children’s power to influence their parents. For
example, Foxman et al. (1989) argue that age is a relevant variable as older children are
presumed to be more knowledgeable about products and family needs. This is mainly due
to their increase in cognitive development (Piaget, 1972). However, findings on whether
product knowledge has a positive impact on teenagers’ influence differ (Beatty and
Talpade, 1994). Adolescents were found to have greater influence in concept-oriented
families, and if they had better grades (Foxman et al., 1989). Also, parental employment
status (single versus dual income) appears to affect teens’ influences for some product
categories (stereo phones) but not for others (TVs, VCRs, furniture) (Beatty and Talpade,
1994). For instance, adolescents from traditional homes, whose mothers have a career,
are more influential in family decision making, possibly due to guilt on the mothers’ part
(Lee and Beatty, 2002).When trying to influence their parents, children use different
types of influence, e.g. bargaining, persuasion, emotional, and request strategy.
According to importance and time frame of the presumed purchase, six kinds of response
strategies are normally used by parents (bargaining, persuasion, emotional, expert,
legitimate, and directive strategy) (Palan and Wilkes, 1997).
Usage
Based on this study 80% of the consumers using toothpaste in Indore city.50% of the
respondents are brushing twice in a day than once and thrice. When compare to other
products like toothpowder and mouth wash, the availability of toothpaste is more in the
market and also the package size is convenient for the consumer. So the usage rate is high
for toothpaste. This also supported by following review. Assunçao and Meyer (1993)
showed that consumption increases with inventory, not only because of the stock pressure
from inventory holding costs, but also because higher inventories give consumers greater
flexibility in consuming the product without having to worry about replacing it at high
prices. Chiang (1995) found no category expansion effect in the detergent category.
Wansink and Deshpandé (1994) showed in a lab study that promotional activity might
cause consumers to consume a stockpiled product more quickly. The research performed
by Wansink (1996) demonstrated that larger package sizes influence the usage volume of
usage variant products, partially because larger packages are perceived to be less
expensive to use (lower perceived unit costs).
Awareness
Based on this study the awareness level of toothpaste brand was less in Indore city
People knows only the popular brands like Colgate, Pepsodent and Close-up. So they
purchase only known brand. In Indore city most of the respondents aware of Colgate then
Closeup and Pepsodent then regional players like Dabur, Anchor, and Ajanta. This is
supported by the following review. Most of the respondents used 3 brands, two brands,
and three. Due to Indian family set up most of the consumers using only one common
toothpaste for the entire family. Oral care awareness and brand awareness is less in
Indore city. Product awareness is an important factor for buying a product. The oral care
awareness level is less in India, when compare to other counters like Europe and
Thailand. Per capita consumption of toothpaste is only 70gm in India. In oral care
toothpowder, toothpaste and toothbrush dominating the Indian market but in other
countries mouth spray, mouth wash products also dominate in the market. Still in India
rural area people are using neem and tobacco for brushing. So the manufacturing
companies and government both are responsible for creating awareness through
advertising campaign.
Brand awareness can also effect decisions about brands within the consideration set
(Hoyer and Brown, 1990; and Keller, 1993). Consumers may employ heuristic (decision
rule to buy only familiar well, established brands (Riselaus, 1971; and Jacoby et al; 1977,
both sited in Keller, 1993). Consumers do not always spend a great deal of time making
purchase decisions in a study of pre purchase search for laundry, Hoyer (1984) found that
the median number of packages- store was around 1:2 before a selection was made.
Dickson and Sawyer (1986) found that purchases such as coffee toothpaste and
margarine, the consumer took an average 12 seconds from the time of first looking at the
shelf’s to the time they placed in their trolley. Hoyer and Brown (1990) designed a
controlled experiment probe the role of brand awareness in the process of consumer
choice for the purchase of peanut, butter, whose results revealed that brand awareness
was a dominant factor in both initial (trial) and repeat purchase decisions even when the
quality of the selected brand was inferior to that of the other brands.
Frequency of purchase
Based on this study frequency of purchasing is based on the brushing habit and members
in the family. Most of the respondents, buying once in a month, twice and thrice. So
frequency of purchasing is mainly based on usage rate and promotional effect. This is
supported by following review. The study of Fader and Lodish (1990) implied a positive
relationship between high frequency of purchase and promotional elasticity. Based on
Bawa and Shoemaker (1987), Narasimhan et al. (1996) hypothesized that shorter
consumer inter purchase time’s result in more brand switching because the consumer
must live with the consequences of buying a less preferred brand for a shorter period. In
addition Narasimhan et al. conjectured that interpurchase times are related to purchase
acceleration. Long inter purchase times discourage acceleration because the stockpiled
product must be stored for a longer period of time. This was supported by empirical
findings. Bell et al. (1999) found less stockpiling for often purchased products.
5.5 Dentist’s advice based on this survey most of the respondents accepted the advice of
dentist to avoid dental problem, some respondents changed their brand due to taste
problem, few respondents ignored the dentist advice because they felt that this is a sales
promotion technique backed by company, some are not interested in oral care. The
dentist to population ratio is a critically low 1:35000 in the country. This results in low
oral hygiene consciousness and widespread dental diseases. So the Government and
company is responsible for creating awareness through dental campaign to avoid dental
problem and increase the consumption of toothpaste in India
Price
Based on this survey, most of the respondents are influenced by price then availability,
and then packaging .For increasing the price of a product the company should consider
the views of consumer otherwise the consumer switch over to competitor product. This is
supported by the following review. Vani, Ganesh, and Panchanatham (2009) discussed
the price of toothpaste in their research work (Oral care segmentation) - Price wise
toothpaste can be segmented as economy, regular and value added segment. The price
range varies from Rs. 15-20 for a 100gm pack in the economy segment. Rs30-35 for a
100gm pack in the regular segment and Rs 50 for 100gm pack in the value added
segment. So analyzing economic factor is an important task for the company to fix the
price
Product attributes
Based on this study product attributes also influencing the consumers for decision
making. Most of the respondents gave importance to healthy tooth and gums, prevention
of tooth decay, herbal attribute, whiteness, long lasting freshness, and good foam. So
people consider the benefit of the product for buying toothpaste. This supported by the
following review. Vani, Ganesh and Panchanatham (2011) discussed the benefit of
toothpaste in toothpaste buying model. In this article they discussed about decay
prevention and brighter teeth.-Large number of families with children seriously
concerned about the possibilities of cavities and shows a definite preference for fluoride
toothpaste. Large group of young married people smoke more than average. They are
giving importance to brighter teeth. So analyzing the requirement of people is important
factor for selling the product successfully in the market
Brand image
Based on this study the preference for selecting toothpaste is mainly based on brand, n
quality, and flavor. Brand image influencing the consumer mind and consumer feel the
quality of the product. This is supported by the following review. Zeithaml, Parasuraman,
and Berry (1985) suggested that the brand image was an extrinsic attribute of the product.
He believed that the brand image has less impact compared to intrinsic attributes. Jacoby
(1978) suggested that the brand image served as a channel for providing certain
information to the customer. Rose lily (1971) noted that the brand image was considered
to be a consistently favorable factor as a risk reliever. Zin khan & Martin (1978) found
that the consumer has a more positive attitude toward the product with a brand image
than toward the product with no brand image.
Reference group
Based on this study parents are influencing more for buying toothpaste then friends,
spouse, kids and self-decision. So reference group also influencing the consumer in
decision making. This is supported by the following review. Lamb, Hair & McDaniel
(1998) suggested that the reference group provided three types of influences.
Informational influence, normative influence, and identification influence. Informational
influence means that an individual uses the behavior and options of group member to
gather useful information. Normative influence refers to an individual’s achieving group
expectations and gaining the respect of and sense of belonging to the group. Identification
influence occurs when an individual internalizes the values and norms of the group.
Advertising
Based on this study majority of the respondents influenced by advertisement for buying
toothpaste. In recent circumstances technology plays an important role in decision
making; especially in advertising field the technology role is very high. Television
advertisement inducing the consumer mind for decision making, especially kid’s
advertisement for toothpaste influencing the kids to influence the parents to buy a
particular brand. Other kind of advertisement in magazine, newspaper also influencing
the people. Advertising is a strong base for consumer to select toothpaste. Celebrity
endorsement also influencing the consumer for decision making; attractive banner in road
side attracts the consumer to select a particular brand. This is supported by the following
review. A successful nation economy depends on advertising promoting sales so that
factory production is maintained, people are employed and have spending power, and the
money goes round and round. Advertising, it has been conjectured in prior literature,
shapes consumer preferences in multiple ways. The first, most obvious effect is that
advertising informs the consumer of product attributes and hence raises awareness and
knowledge of the true quality of the brand. This has been called the informative effect of
advertising (Bucklin 1965, Lavidge and Steiner 1961).Second, advertising may directly
influence a consumers brand evaluation through such cues as celebrity endorsements and
music, even without providing any explicit information. This has been referred to as the
persuasive or prestige effect of ads (Aaker & Stayman, 1990, Batra & Ray, 1986).Third,
advertising can influence how consumers experience and evaluate the quality of the
product from subsequent consumption. This effect has been evocatively referred to as the
transformative effect of advertising (Deighton, 1984, 1988).
Sales promotion
Based on this study most of the respondents influenced by free gift, extra quantity and
discount. So free gift influencing the customer for decision making. This is supported by
the following review. Daly, Ellen in advertising impact using the power of promotional
gifts. The power of promotional product rests with reciprocation. If the right gift is
presented properly the recipient will want to give something back. So the free gift is an
essential tool in promoting the product. Normally human being is attracted by any kind of
free gift.
Brand switching
Based on this study switching of one brand to other brand is mainly based on
advertisement impact and offers provided by the companies. Sudden increase in price
also affected the respondents to switch .Some respondent’s switch to other brand for
trying new option. In some cases friends, kids, parents relatives influencing the people to
switch. So promotion played an important role in switching. This is supported by the
following review. Gupta (1988) concluded that more than 84% of the sales increase due
to promotions is accounted for by brand switching (a very small part of which may be
switching between different sizes of brands). . Bell et al. (1999) offer an empirical
generalization on promotional response. They concluded that brand switching varies
systematically across product categories.
SUGGESTIONS
 It is suggested that, the Pepsodent brand must take necessary steps to improve the
availability of product in small shops.
 In general, introducing the small size packages, the company will meet barriers
like, less profit, sales and quantity because of high price and cost of production.
 The new customers percentage is low in compared to existing customers. The
company must capture the new customers/consumers to improve the sales and
maximizing the existing profit.
 It is fact that, in general most of the consumers are unaware of the toothpaste.
Because the consumers are dissatisfied towards to purchase the toothpaste, it will
leads to decreasing the reputation of the company. So, the company increasing to
giving the offers, gifts and price cut to improve the reachability of the product in
to the customers.
 From consumer observation, most of the consumers are not satisfied with Colgate
brand especially the packaging style of the brand. It is a notification to Research
& Development Department to change the entire package of the brand.
 It is interprets that, the Pepsodent company must take better steps to improve the
innovative technology to introducing the freshness of the brand in the existing
manufacturing style to reduce the competition and to make their brand as a
monopoly on the market.
 In general, the Pepsodent Company must follow some pricing strategy to cut the
entire cost of the production to enhance the market share of the company.
CONCLUSION
Through the study made at Indore, it is clear that Colgate & Pepsodent toothpaste have
high awareness. Colgate & Pepsodent toothpaste have a wide market in and around
Indore. The users of the Colgate toothpaste purchase the product due to its quality and
brand loyalty. So compared to Pepsodent toothpaste, Colgate have more advantages and
varieties. So I conclude that, Colgate toothpaste is best. Colgate is best and Colgate
toothpaste is suits and attracts for all persons because of its availability, varieties and
packages.
LIMITATIONS
My study suffers from some limitation, which could be avenues for further research. This
study failed to talk about the psychographics of the consumer. Understanding
psychographics of the consumer is an important tool to understand the inner feelings, and
attitude of the consumer. The changing demographic profile of the population in terms of
education, income, size of family and so on, are important by what will be more
substantive in days to come will be the Psychographics of customers that is how they
feel, think or behave. Marketers will have to constantly monitor and understand the
underlying Psychographics to map their respective industries are moving and decide what
needs to be done, by way of adding value that motivates customers to buy the company’s
products and influence the future industry structure. One more problem in this study was
questionnaire. Most of the questions are closed ended it limits the respondents answer.
References
Assunçao, J.L., and Meyer, J.R., (1993): The Rational Effect of Price Promotions on
sales and Consumption, Management Science, 39(5): 517-535.
Bawa, K., and Shoemaker. (1987): The Coupon-Prone Consumer: Some Findings Based
on Purchase Behavior across Product Classes, Journal of Marketing, 51(4), 99-110.
Bell, D.R., Chiang, J., and Padmanabhan, D. (1999): The Decomposition of Promotional
Response, Marketing Science, 18 (4): 504-526.
Daly, and Ellen. (1993): Advertising impact: Using the power of promotional gifts, The
American Salesman, 38 (10):16. Del Hawkins, I., Roger Best, J. & Kenneth Coney, A.
(2002): Consumer behaviour: Tata McGraw Hill Publishing Co Ltd: New Delhi
Everything you wanted to know about toothpaste. Retrieved from
www.saveyoursmile.com/toothtoothpaste/toothtoothpaste-a.html
Fader, P.S., and Lodish, L.M. (1990): A Cross-Category Analysis of Category Structure
and Promotional Activity for Grocery Products. Journal of Marketing, 54 (4): 52-65.
Gupta, Sunil. (1988): Impact of sales promotions on when, what and how much to buy.
Journal of Marketing Research, 25 (4): 342-355.
Harish, K. S. (2009): Consumer Motivation Perception. Marketing Mastermind, 9(12):
47-48. Jacoby, J,. And Chestnut. (1978): Brand Loyalty, Measurement and Management.
New York: John Wiley & Sons.
Narasimhan, C. (1984): A price discrimination theory of coupons. Marketing Science,
3(2):128-147 Nitin Mehta, Xinlei(Jack) Chen,Om Narasimhan (2008): Informing,
Transforming, and Persuading: Disentangling the Multiple Effects of Advertising on
brand choice decision, Marketing Science 27(3):334 Rajendra, N. (2006): Market
Research, New Delhi, ND: Tata McGraw Hills. Stephanie N., M. (2001): Consumers
channel preferences: An integrated model. Unpublished Doctoral dissertation, Isenberg
school of management),Retrieved from Proquest database
Suja N., R. (2007): Consumer behavior in Indian perspective, Mumbai: Himalaya
publishing House Sumathi, S., & Saranavel, P. (2003): Marketing Research &Consumer
Behavior, Vikas publishing house: New Delhi The history of teeth cleaning, Retrieved
from http://www.bbc.co.uk/dna/h2g2/A2818686 Tooth care products. Retrieved from
http://www.bupa.co.uk/individuals/health-information
Vani, G., Ganesh, B., M., & Panchanatham, N. (2009): Segmentation in Indian Oral care
industry: An overview, SRM management digest
Vani, G., Ganesh B, M., & Panchanatham, N. (2010): Oral care industry: Colgate’s
smiley promos, Advertising Express
Wansink, B., and Desphande, R. (1994: .Out of Sight, Out of Mind: Pantry Stockpiling
and Brand-Usage Frequency, Marketing Letters, 5(1): 91-100.
Zeithaml, V.A. (1988): Consumer Perceptions of Price, Quality, and Value: A Means-
End Model and Synthesis of Evidence, Journal of Marketing, 52 (3): 2-22.

A comparative study on consumer behaviour about colgate and pepsodent toothpaste in indore

  • 1.
    A COMPARATIVE STUDYON CONSUMER BEHAVIOR ABOUT COLGATE AND PEPSODENT TOOTHPASTEIN INDORE INTRODUCTION PROFILE OF COLGATE – PALMOLIVE COMPANY: LAUNCHED IN 1806: Colgate – Palmolive Company, together with its subsidiaries, engages in the manufacture and marketing of consumer products worldwide. It operates in two segments, oral, personal, homecare and pet nutrition. The oral, personal & home care segment offers tooth toothpaste, toothbrushes, mouth rinses, dental floss, and pharmaceutical products for dentists & other oral health professionals; shower gels, shampoo, conditioners, deodorants & antiperspirants; & liquid hand soaps; and dishwashing liquids, household cleaners ,oil soaps & fabric conditions. The pet nutrition segment produces pet nutrition products for dogs & cats. The company sell sits products to wholesale & retail distributors, and to veterinarians and specialty pet retailers. Colgate – Palmolive was founded in 1806 and is headquartered in New York, New York. Colgate introduced Cashmere Bouquet, a perfumed soap. Colgate Dental Cream Colgate Total 12Colgate Sensitive Colgate ,Max Fresh Colgate ,Kids Toothtoothpaste ,Colgate Fresh Energy ,Gel , Herbal Colgate ,Cibaca Family, Protection Colgate ,Advanced Whitening Colgate Active, Salt Colgate Whitening. PROFILE OF PEPSODENT – HINDUSTAN UNILEVER LIMITED: LAUNCHED IN 1993: Pepsodent is a brand of toothpaste with a wintergreen flavor. It was formerly owned by Unilever (but, since 2003, by Church and Dwight in USA,).Pepsodent was a very popular brand before the mid '50s, but its makers were low to add fluoride to its formula to counter the rise of other highly promoted brands such as Crest and Gleem toothpaste by Procter & Gamble, and Colgate's eponymous product; sales of Pepsodent plummeted. Today Pepsodent is a “value brand” marketed primarily in discount stores and retails for roughly half the price of similarly-sized tubes of Crest or of Colgate. Complete + Gum Care Complete 12 Pepsodent, Herbal Pepsodent, Pepsodent Milk Teeth Orange, Pepsodent Milk Teeth, StrawberryPepsodent, Sensitive Pepsodent, Whitening Pepsodent Cavity Prevention. CONSUMER BEHAVIOUR: The field of consumer behavior is the study of individuals, groups, or organizations and the process they use to select, secure, use, and dispose of products, services, experiences, or ideas to satisfy needs and the impacts that these processes have on the consumer and society. This view of consumer behavior is broader than the traditional one, which focused much more on the buyer and the immediate
  • 2.
    antecedents and consequencesof the purchasing process. This view will lead us to examine indirect influences on consumption decisions as well as consequences that involve more than the purchaser and seller. The opening examples summarize several attempts to apply an understanding of consumer behavior in order to develop an effective marketing strategy, to regulate a marketing practice, or to cause socially desirable behavior. The examples cited reveal four main facts about the nature of our knowledge of consumer behavior. First, successful marketing decisions by commercial firms, nonprofit organizations, and regulatory agencies require extensive information on consumer behavior. It should be obvious from these examples that organizations are applying theories and information about consumer behavior on a daily basis. Knowledge of consumer behavior is critical for influencing not only product purchase decisions but decisions about which college to attend, which charities to support how much recycling to do, or whether to seek help for an addition or Behavioral problem. The examples also indicate the need to collect information about the specific consumers involved in the marketing decision at hand. At its current state of development, consumer behavior theory provides the manager with the proper questions to ask. However, given the importance of the specific situation and product category in consumer behavior, it will often be necessary to conduct research to answer these questions. One executive explains the importance of consumer behaviorresearch this way: Understanding and properly interpreting consumer wants is a whole lot easier said than done. Every week our marketing researchers talk to more than 400 consumers to find out, they think of our products and those of our competitors. Today, as never before, we cannot take our business for granted. That’s why understanding and therefore learning to anticipate - consumer behavior is our key to planning and managing in this ever - changing environment. The examples also indicate that consumer behavior is a complex, multidimensional process. The center for Media Education, the American Legacy Foundation, and P & G have invested millions of dollars researching consumer behavior and much more trying to influence it, yet none of them are completely successful. It is important to note that all marketing decisions and regulations are based on assumptions about consumer behavior. It is impossible to think of a marketing decision for which this is not the case. For example, regulations designed to protect children from various marketing practices on the Web must be based on
  • 3.
    assumptions about children’sability to process information and make decisions in this environment. Likewise, a decision to match a competitor’s price reduction must be based on some assumption about how consumers evaluate prices and how they would respond to a price differential between the two brands. An advertisement targeted at the same consumers. But assumptions about consumer behavior are differ from one advertisement to another advertisement. The term consumer behavior refers to the behavior that consumer displays in searching for purchasing using, evaluating, disposing of product and services that they expect will satisfy their needs. The study of consumer behavior is the study of consumer how individual make decision to spend the available resources (time, money, effort) on consumption of items. It includes the study of what they buy, why they buy, when the buy it, where the buy it, how often they buy it and use it. The field of consumer behavior holds great interest for us as consumer, as marketers and as scholars of human behavior. As consumption we benefit from in right into our consumption related to the designers what we buy, why we buy, how we buy and promotional influences that persuade us do buy. The study of consumer behavior enables us to become better that is wiser consumers. We purchase goods, due to certain motives. Motives may refer to thought, strong feelings, urge, motion, drive etc. Which make a buyer to react in the form of a decision. Any urge which makes a person to take purchase decision is called as buying motive. Motive is an inner urge which moves one to action. It is not a mere desire to buy. OBJECTIVE OF THE STUDY REVIEW OF LITERATURE: 1. Consumer behavior: Consumer behavior has been always of great interest to marketers. The knowledge of consumer behavior helps the marketer to understand how consumers think, feel and select from alternatives like products, brands and the like and how the consumers are influenced by their environment, the reference groups, family, and salespersons and so on. A consumer’s buying behavior is influenced by cultural, social, personal and psychological factors. Most of these factors are uncontrollable and beyond the hands of marketers but
  • 4.
    they have tobe considered while trying to understand the complex behavior of the consumers. In this study, the researcher emphasizes the importance of lifestyle and its impact on the buyer behavior. 2. Consumer Personality Factors: There are two factors mainly influencing the consumers for decision making: Risk aversion and innovativeness. Risk aversion is a measure of how much consumers need to be certain and sure of what they are purchasing (Donthu and Gilliland, 1996).Highly risk adverse consumers need to be very certain about what they are buying. Whereas less risk adverse consumers can tolerate some risk and uncertainty in their purchases. The second variable, innovativeness, is a global measure which captures the degree to which consumers are willing to take chances and experiment with new ways of doing things (Donthu and Gilliand,1996).The shopping motivation literature is abound with various measures of individual characteristics (e.g., innovative, venturesome, cosmopolitan, variety seeking, therefore, innovativeness and risk aversion were included in this study to capture several of these traits. Measures by Donthu and Gilliland (1996) were used to measure innovativeness and risk a version. 3. Perception: Perception is a mental process, whereby an individual selects data or information from the environment, organizes it and then draws significance or meaning from it. 4. Perceived fit: It is an attitudinal measure of how appropriate a certain channel of distribution is for a specific product .Morrison and Roberts (1998) found that consumer’s perception of the fit between a service/product and a channel is very influential in determining whether they will consider using that channel for a specific service. In fact, perceived fit was found to be more important than consumer’s preferences for the distribution method or service. 5. Product Class knowledge: Product class knowledge is a measure of consumers perceptions of how much they know about a specific class of products (example; cars) This type of measure is consistent with what Brucks(1985) called subjective knowledge, that is, consumers self-perceptions of knowledge levels. This is often contrasted with objective knowledge, which is what consumers actually know. Park and Lessing (1981) proposed that subjective knowledge provides a better understanding of consumers decision making processes because
  • 5.
    consumers level ofconfidence in their search and decision making behavior, independent of their objective knowledge. 6. Product type: Past research indicates that consumer’s purchase and channel decisions might be influenced by the type of product being investigated (Cox and Rich 1964: Lumpkin and Hawes 1985;Morrison and Roberts 1998: Papadopoulos 1980:Prasad 1975: Sheth 1983: Thompson 1971).In particular, these authors state 29that certain products might be more appropriate for one channel or another, which ultimately influences consumers channel preference and choice. 7. Quality: It is our aim to provide the best product for the consumer and we believethat if the products have quality the consumer will pay the price, says Amal pramanic, regional business director. 8. Packaging: Packaging establishes a direct link with the consumers at the point of purchase as it can very well change the perceptions they have for a particular brand. A product has to draw the attention of the consumers through an outstanding packaging design. Earlier packaging was considered only a container to put a product in, but today, researching to the right packaging is beginning at the product development stage itself. Packaging innovation has been at the heart of Dabur’s attempt to rap with the urban consumers. It spends large sums annually on packaging research. 9. Promotion: The greatest challenge faced by companies today is holding and increasing Their market share and value .This is always a strenuous exercise and one of the tools for the same is marketing. There is no specific game rule available for using these marketing tools .The reason is: each promotional tool has its own characteristics. 10. Familiarity with a channel: Consumer’s familiarity with a channel is a measure of the general experience they have with purchasing products through specific channels (i.e. catalog, internet, and bricks and
  • 6.
    mortar retailer). Throughfrequent use consumers should become accustomed to using the channel, which reduces their apprehension and anxiety in purchasing products through the channel. 11. Brand Awareness: According to Rossiter and Prey (1987), brand awareness precedes all other steps in the buying process. A brand attitude cannot be performed, unless a consumer is aware of the brand. In memory theory, brand awareness is positioned as a vital first step in building the bundle of associations which are attached to the brand in memory (Stokes, 1985). 12. Family influence: A family exerts a complex influence on the behaviors of its members. Prior family influence research has focused on intergenerational rather than intergenerational influence in consumer renationalization. As has been compellingly demonstrated, parents influence children (Moore, Willkie, and Lutz 2002; Moschis1987).Yet, consumption domains clearly exist where sibling efforts may also be exerted. 13. Shopping motives: Shopping motives are defined as consumer’s wants and needs as they relate to outlets at which to shop. Two groups of motives, functional and nonfunctional, have been proposed by Sheth (1983). Functional motives are associated with time, place, and possession needs and refer to rational aspects of channel choice. Whereas nonfunctional motives relate to social and emotional reasons for patronage .The functional motives included: convenience, price comparison, and merchandise assortment. RESEARCH METHODOLOGY Research Design The researcher has applied the concept of descriptive research design in this study. This study tries to describe the prospects perception & attitude towards the toothpaste with reference to Colgate and Pepsodent. Primary and secondary data was collected for the study. Sampling In this study the researcher used convenience sampling. The sample was selected according to the convenience of the researcher. Sample Size: In this study the researcher’s sample size is 50.
  • 7.
    Tools of analysis Inthis study, the researcher used three types of tools they are, Simple Percentage, Chi- square Technique, and ANOVA Technique. The results of the analysis made in this study in fully dependent on the correctness of the introduction given by the respondents. Table – 1, shows the grams of toothpaste used by the respondents in a family TOOTHTOOTHPASTE USED (IN GRAMS) NUMBER OF RESPONDENTS PERCENTAGE 50 GRAMS 13 9% 150 GRAMS 108 72% ABOVE 150 GRAMS 29 19% TOTAL 150 100% Inference: The above table predicts that 9% of the respondents are using 50 grams, 72% of the respondents are using 150 grams and 19% of the respondents are using Above 150 grams of toothpaste. Table – 2, shows the brand, which was mostly preferred by the respondents BRAND (TOOTHTOOTHPASTE) MOSTLY PREFER NUMBER OF RESPONDENTS PERCENTAGE Colgate 105 70% Pepsodent 33 22% Others 12 8% Total 150 100% Inference: The above table shows that 70% of the respondents are preferred Colgate, 22% of the respondents are preferred Pepsodent, and 8% of the respondents were got other toothpaste brands like Glister, Close up, etc.
  • 8.
    Table – 3,shows the particular reason for choosing the toothpaste by the respondents REASON FOR CHOOSE THE TOOTHTOOTHPASTE NUMBER OF RESPONDENTS PERCENTAGE Brand Name 20 13% QUALITY 126 84% PRICE 4 3% TOTAL 150 100% Inference: The above table infers that 13% of the respondent’s selection was based on Brand Name, 84% of the respondent’s selection was based on Quality and 3% of the respondent’s selection was based on Price. Table – 4, shows the toothpaste which is more affordable to purchase by the respondents:- MORE AFFORDABLE TO PURCHASE NUMBER OF RESPONDENTS PERCENTAGE Colgate 107 71% Pepsodent 33 22% Others 10 7% Total 150 100% Inference:The above table refers that 71% of the respondents are more affordable to purchase the Colgate Toothtoothpaste, 22% of the respondents are more affordable to purchase the Pepsodent toothpaste& 7% of the respondents are more affordable to purchase the other brand of toothpaste. Table – 5, shows the variety of Colgate toothpaste which was preferred by the respondents:- COLGATE VARIETY PREFERED NUMBER OF RESPONDENTS PERCENTAGE Colgate Active Salt 43 29% Colgate Normal 90 60% Others 17 11% Total 150 100%
  • 9.
    Inference: The abovetable indicates that 29% of the respondents are using Colgate Active Salt, 60% of the respondents are using Colgate Normal and 11% of the respondents are using the other Colgate Variety of Toothtoothpaste like Colgate Total, Colgate Max Fresh Gel etc. Table – 6, shows the variety of Pepsodent toothpaste which was preferred by the respondents PEPSODENT VARIETY PREFERED NUMBER OF RESPONDENTS PERCENTAGE Pepsodent 2 in 1 66 44% Pepsodent Normal 69 46% Others 15 10% Total 150 100% Inference: The above table tells that 44% of the respondents are using Pepsodent 2 in 1, 46% of the respondents are using Pepsodent Normal & 10% of the respondents are using the other Pepsodent Variety of Toothtoothpaste like Pepsodent center fresh, Pepsodent whitening, etc.
  • 10.
    Table – 7,shows the sources of information KNOW ABOUT THE PRODUCT NUMBER OF RESPONDENTS PERCENTAGE Advertisement 115 76% Merchant 13 9% Others 22 15% Total 150 100% Inference: The above table exhibits that 76% of the respondents are knows the product through Advertisement, 9% of the respondents are knows the product through Merchant and 15% of the respondents are knows the product through Others like Family Members, Past Experience etc. Table – 8, shows the toothpaste which was mostly prefer by the children TOOTHTOOTHPASTE PREFERED MOSTLY FOR CHILDREN NUMBER OF RESPONDENTS PERCENTAGE COLGATE 100 67% PEPSODENT 36 24% Others 14 14% Total 150 100% Inference: The above table interprets that 67% of the respondents said that their children brand preference is Colgate, 24% of the respondents said that their Children brand preference is Pepsodent and 9% of the respondents Said that their children brand preference is other brands like Closeup, Glister, etc. Table – 9, shows the final decision to purchasing the toothpaste by the respondents FINAL DECISION TO PURCHASING THE TOOTHTOOTHPASTE NUMBER OF RESPONDENTS PERCENTAGE Self 104 69% Eldest Member 34 23%
  • 11.
    Others 12 8% Total150 100% Inference: The above table predicts that 69% of the respondents are took the final decision by as Self, 23% of the respondents are took the final decision from their Eldest Members and 8% of the respondents are took the final decision from their family members to purchase the toothpaste. Table – 10, shows the toothpaste which was gives more freshness to the respondents TOOTHTOOTHPASTE GIVES MORE FRESHNESS NUMBER OF RESPONDENTS PERCENTAGE Colgate 104 69% Pepsodent 37 25% Others 9 6% Total 150 100% Inference: The above table shows that 69% of the respondents are getting more freshness from Colgate toothpaste, 25% of the respondents are getting more freshness from Pepsodent toothpaste and 6% of the respondents are getting more freshness from other toothpaste. Table – 11, shows the toothpaste which was more convenient to buy in small shops by the respondents MORE CONVENIENT TO BUY NUMBER OF RESPONDENTS PERCENTAGE Colgate 114 76% Pepsodent 28 19% Others 8 5%
  • 12.
    Total 150 100% Inference:The above table infers that 76% of the respondents are bought Colgate toothpaste easily, 19% of the respondents are bought Pepsodent toothpaste easily and 5% of the respondents are bought other Toothtoothpaste like close up. Table – 12, shows the toothpaste which was using for the main purpose by the respondents:- USING THE TOOTHTOOTHPASTE NUMBER OF RESPONDENTS PERCENTAGE Helps to keeps gums healthy 57 38% Makes teeth strong 59 39% Freshens breath 34 23% Total 150 100% Inference: The above table refers that 38% of the respondents are using the toothpaste for keeps gums healthy 39% of the respondents are using the toothpaste for makes teeth strong and 23% of the respondents are using the toothpaste for freshens breath. Table – 13, Grams of Toothtoothpaste Used By the Respondents in a Family Null Hypothesis: There is no significant difference between the age & grams of toothpaste used by the respondents in a family. Alternative Hypothesis: There is a significant difference between the age & grams of toothpaste used by the respondents.
  • 13.
    AGE (years) 50Grams 150 Grams Above 150 grams Total Below 35 10 50 16 76 35-50 1 45 7 53 Above 50 2 14 5 21 Total 13 109 28 150
  • 14.
    𝜒2 = 𝛴( 𝑂𝑖𝑗− 𝐸𝑖𝑗)2 𝐸𝑖𝑗 = 14.63 Calculated value = 7.65 5% level of significance = 9.48 Degrees of freedom =4 Interpretation: According to chi-square technique, the calculated value obtained is greater than the table value. So, the null hypothesis is accepted. Therefore, it is conclude that, there is no significant difference between the age and brand preferred by the respondents in a family. Table – 15. Particular Reason for Purchasing the Toothtoothpaste Null Hypothesis: There is no significant difference between the age & particular reason for purchase the toothpaste. Alternative Hypothesis: There is a significant difference between the age & particular reason for purchase the toothpaste. AGE (years) BRAND NAME QUALITY PRICE TOTAL Below 35 13 62 1 76 35-50 7 42 4 53 Above 50 - 21 - 21 Total 106 125 5 150 𝜒2 = Σ( 𝑂𝑖𝑗−𝐸𝑖𝑗)2 𝐸𝑖𝑗 = 15.82 Calculated value = 15.82 5% level of significance = 9.48 Degrees of freedom = 4 Interpretation: According to chi-square technique, the calculated value obtained is greater than the table value. So, the null hypothesis is accepted.
  • 15.
    Therefore, it isconclude that, there is no significant difference between the age and particular reason for purchasing the toothpaste. Table – 16, More Affordable to Purchase the toothpaste Null Hypothesis: There is no significant difference between the age & affordable to purchase the toothpaste. Alternative Hypothesis: There is a significant difference between the age & affordable to purchase the toothpaste. AGE(years) Colgate Pepsodent Others Total Below 35 53 17 6 76 35-50 40 11 2 53 Above 50 14 5 2 21 Total 107 33 10 150 𝜒2 = ( 𝑂𝑖𝑗 − 𝐸𝑖𝑗)2 𝐸𝑖𝑗 = 6.07 Calculated value = 6.07 5% level of significance = 9.48 Degrees of freedom = 4 Interpretation: According to chi-square technique, the calculated value obtained is less than the table value. So, the null hypothesis is rejected. Therefore, it is conclude that, there is a significant difference between the age and affordable to purchase the toothtoothpaste.
  • 16.
    Table – 17,Colgate Variety of Toothpaste Preferred by the Respondents Null Hypothesis: There is no significant difference between the age & Colgate variety of the toothpaste preferred by the respondents. Alternative Hypothesis: There is a significant difference between the age & Colgate variety of the toothpaste preferred by the respondents. AGE(years) Colgate active salt Colgate Normal Others Total Below 35 23 47 6 76 35-50 16 29 8 53 Above 50 3 15 3 21 Total 42 91 17 150 𝜒2 = ( 𝑂𝑖𝑗 − 𝐸𝑖𝑗)2 𝐸𝑖𝑗 = 4.42 Calculated value = 4.42 5% level of significance = 9.48 Degrees of freedom =4 Interpretation:-According to chi-square technique, the calculated value obtained is less than the table value. So, the null hypothesis is rejected. Therefore, it is conclude that, there is a significant difference between the age and Colgate variety of the toothpaste preferred by the respondents. Table – 18. Pepsodent Variety of Toothpaste preferred by the Respondents Null Hypothesis: There is no significant difference between the Age & Pepsodent variety of toothpaste preferred by the respondents. Alternative Hypothesis: There is a significant difference between the Age & Pepsodent variety of toothpaste preferred by the respondents. AGE(years) Pepsodent Pepsodent 2 in Others Total
  • 17.
    normal 1 Below 3536 35 5 76 35-50 23 22 8 53 Above 50 9 10 2 21 Total 68 67 15 150 𝜒2 = ( 𝑂𝑖𝑗 − 𝐸𝑖𝑗)2 𝐸𝑖𝑗 = 7.42 Calculated value = 7.42 5% level of significance = 9.48 Degrees of freedom = 4 Interpretation: According to chi-square technique, the calculated value obtained is less than the table value. So, the null hypothesis is rejected. Therefore, it is conclude that, there is a significant difference between the age and Pepsodent variety of the toothpaste preferred by the respondents. Table – 19, Know About the Product by Way of Null Hypothesis: There is no significant difference between the age & ways to know about the product by the respondents. Alternative Hypothesis: There is a significant difference between the age & ways to know about the product by the respondents. AGE(years) Advertisement Merchant Others Total Below 35 66 3 7 76 35-50 37 8 8 53 Above 50 12 2 7 21 Total 115 13 22 150 𝜒2 = ( 𝑂𝑖𝑗 − 𝐸𝑖𝑗)2 𝐸𝑖𝑗 = 20.24 Calculated value = 20.24
  • 18.
    5% level ofsignificance = 9.48 Degrees of freedom = 4 Interpretation: According to chi-square technique, the calculated value obtained is greater than the table value. So, the null hypothesis is accepted. Therefore, it is conclude that, there is no significant difference between the age and ways to know product by the respondents. Table – 20, Toothtoothpaste which is preferred by the Children Mostly Null Hypothesis: There is no significant difference between the age &toothpaste which is preferred by the children mostly. Alternative Hypothesis: There is a significant difference between the age &toothpaste which is preferred by the children mostly. AGE(years) Colgate Pepsodent Others Total Below 35 51 17 8 76 35-50 34 14 5 53 Above 50 15 5 1 21 Total 100 36 14 150 𝜒2 = ( 𝑂𝑖𝑗 − 𝐸𝑖𝑗)2 𝐸𝑖𝑗 = 11.29 Calculated value = 11.29 5% level of significance = 9.48 Degrees of freedom = 4 Interpretation: According to chi-square technique, the calculated value obtained is greater than the table value. So, the null hypothesis is accepted. Therefore, it is conclude that, there is no significant difference between the age and toothpaste which is mostly preferred by the children. Table – 21, Final Decisions Took By the Respondents While Purchasing the Toothpaste Null Hypothesis: There is no significant difference between the age & final decision took by the respondents while purchasing the toothpaste.
  • 19.
    Alternative Hypothesis: Thereis a significant difference between the age & final decision took by the respondents while purchasing the toothpaste. AGE(years) Self Eldest Others Total Below 35 48 20 8 76 35-5- 44 9 - 53 Above 50 12 5 4 21 Total 104 34 12 150 𝜒2 = ( 𝑂𝑖𝑗 − 𝐸𝑖𝑗)2 𝐸𝑖𝑗 = 11.56 Calculated value = 11.56 5% level of significance = 9.48 Degrees of freedom =4 Interpretation: According to chi-square technique, the calculated value obtained is greater than the table value. So, the null hypothesis is accepted. Therefore, it is conclude that, there is no significant difference between the age and final decision took by the respondents while purchasing the toothpaste. Table – 22, Toothpaste Which Gives More Freshness to the Respondents Null Hypothesis: There is no significant difference between the age &toothpaste which gives more freshness to the respondents. Alternative Hypothesis: There is a significant difference between the age &toothpaste which gives more freshness to the respondents. AGE(years) Colgate Pepsodent Others Total Below 35 58 14 4 76 35-50 38 12 3 53 Above 50 15 5 1 21 Total 111 31 8 150
  • 20.
    𝜒2 = ( 𝑂𝑖𝑗− 𝐸𝑖𝑗)2 𝐸𝑖𝑗 = 6.7 Calculated value = 6.7 5% level of significance = 9.48 Degrees of freedom =4 Interpretation: According to chi-square technique, the calculated value obtained is less than the table value. So, the null hypothesis is rejected. Therefore, it is conclude that, there is a significant difference between the age and toothpaste which gives more freshness to the respondents. Table – 23, Toothpaste Which Was More Convenient to Buy In Small Shops Null Hypothesis: There is no significant difference between the age &toothpaste which is more convenient to buy in small shops by the respondents. Alternative Hypothesis: There is a significant difference between the age &toothpaste which is more convenient to buy in small shops by the respondents. AGE(Years) Colgate Pepsodent Others Total Below 35 62 10 4 76 35-50 41 10 2 53 Above 50 15 5 1 21 Total 118 25 7 150 𝜒2 = ( 𝑂𝑖𝑗 − 𝐸𝑖𝑗)2 𝐸𝑖𝑗 = 5.82 Calculated value = 5.82 5% level of significance = 9.48 Degrees of freedom =4 Interpretation: According to chi-square technique, the calculated value obtained is less than the table value. So, the null hypothesis is rejected. Therefore, it is conclude that, there is a significant difference between the age and toothpaste which is more convenient to buy in small shops by the respondents.
  • 21.
    Table – 24,Using the Toothpaste by the Respondents Null Hypothesis: There is no significant difference between the age & using the toothpaste by the respondents. Alternative Hypothesis: There is a significant difference between the age & using the toothpaste by the respondents. AGE(Years) Healthy gums Strong Teeth Freshen Breath Total Below 35 34 25 17 76 35-50 19 17 17 53 Above 50 10 11 - 21 Total 63 53 34 150 𝜒2 = ( 𝑂𝑖𝑗 − 𝐸𝑖𝑗)2 𝐸𝑖𝑗 = 12.7 Calculated value = 12.7 5% level of significance = 9.48 Degrees of freedom =4 Interpretation: According to chi-square technique, the calculated value obtained is greater than the table value. So, the null hypothesis is accepted. Therefore, it is conclude that, there is no significant difference between the age and using the toothpaste of the respondents. Table – 25, Satisfaction towards the Current Pricing of the Toothpaste Null Hypothesis: There is no significant difference between the age & satisfaction towards the current pricing of the toothpaste by the respondents. Alternative Hypothesis: There is a significant difference between the age & satisfaction towards the current pricing of the toothpaste by the respondents. AGE(years) Highly Satisfied Satisfied Not Satisfied Total Below 35 2 62 12 76 35-50 5 48 - 53
  • 22.
    Above 50 116 4 21 Total 8 126 16 150 𝜒2 = ( 𝑂𝑖𝑗 − 𝐸𝑖𝑗)2 𝐸𝑖𝑗 = 12.08 Calculated value = 12.08 5% level of significance = 9.48 Degrees of freedom = 4 Interpretation: According to chi-square technique, the calculated value obtained is greater than the table value. So, the null hypothesis is accepted. Therefore, it is conclude that, there is no significant difference between the age and satisfaction towards the current pricing of the toothpaste. Table – 26, Satisfaction towards the Toothpaste Null Hypothesis: There is no significant difference between the age & satisfaction towards the toothpaste. Alternative Hypothesis: There is a significant difference between the age & satisfaction towards the toothpaste. AGE(years) Highly satisfied Satisfied Not satisfied Total Below 35 3 72 1 76 35-50 8 45 - 53 Above 50 3 18 - 21 Total 14 135 1 150 𝜒2 = ( 𝑂𝑖𝑗 − 𝐸𝑖𝑗)2 𝐸𝑖𝑗 = 6.13 Calculated value = 6.13 5% level of significance = 9.48 Degrees of freedom = 4 Interpretation: According to chi-square technique, the calculated value obtained is less than the table value. So, the null hypothesis is rejected. Therefore, it is conclude that, there is a significant difference between the age and satisfaction towards the toothpaste.
  • 23.
    Table – 27,Times of Using the Toothpaste per Day Null Hypothesis: There is no significant difference between the age & times of using the toothpaste per day by the respondents. Alternative Hypothesis: There is a significant difference between the age & times of using the toothpaste per day by the respondents. AGE(years) Once twice Above Twice Total Below 35 38 38 - 76 35-50 16 35 2 53 Above 50 6 15 - 21 Total 60 88 2 150 𝜒2 = ( 𝑂𝑖𝑗 − 𝐸𝑖𝑗)2 𝐸𝑖𝑗 = 9.54 Calculated value = 9.54 5% level of significance = 9.48 Degrees of freedom = 4 Interpretation: According to chi-square technique, the calculated value obtained is greater than the table value. So, the null hypothesis is accepted. Therefore, it is conclude that, there is no significant difference between the age and times of using the toothpaste per day by the respondents. Table – 28, Years to Purchase the Particular Toothpaste Null Hypothesis:There is no significant difference between the age & years to purchase the toothpaste. Alternative Hypothesis: There is a significant difference between the age& years to purchase the toothpaste. AGE(years) For 1 year For 2 Years For past 2 years Total Below 35 9 9 58 76 35-50 5 5 43 53 Above 50 2 2 17 21
  • 24.
    Total 16 16118 150 𝜒2 = ( 𝑂𝑖𝑗 − 𝐸𝑖𝑗)2 𝐸𝑖𝑗 = 0.5 Interpretation: According to chi-square technique, the calculated value obtained is less than the table value. So, the null hypothesis is rejected. Therefore, it is conclude that, there is a significant difference between the age and years to purchase the toothpaste. Table – 29, More Satisfaction towards the Product by the Respondents Null Hypothesis: There is no significant difference between the age & more satisfaction towards the product by the respondents. Alternative Hypothesis: There is a significant difference between the age & more satisfaction towards the product by the respondents. AGE(years) Colgate Pepsodent Others Total Below 35 57 17 2 76 35-50 40 10 3 53 Above 50 15 5 1 21 Total 112 32 6 150 𝜒2 = ( 𝑂𝑖𝑗 − 𝐸𝑖𝑗)2 𝐸𝑖𝑗 = 6.81 Calculated value = 6.81 5% level of significance = 9.48 Degrees of freedom =4 Interpretation: According to chi-square technique, the calculated value obtained is less than the table value. So, the null hypothesis is rejected. Therefore, it is conclude that, there is a significant difference between the age and more satisfaction towards the product by the respondents. Table – 30, Particular Reason for Switch Over to other Toothpaste in Recent Days by the Respondents
  • 25.
    Null Hypothesis: Thereis no significant difference between the age & particular reason for switch over to other toothpaste in recent days. Alternative Hypothesis: There is a significant difference between the age & particular reason for switch over to other toothpaste in recent days. AGE(years) Changed Not changed Total Below 35 - 76 76 35-50 - 53 53 Above 50 - 21 21 Total - 150 150 Table – 31, the table shows the benefits of using the toothpaste by the respondent. Benefits of Consuming The Toothpaste Number Of Respondents Rank Percentage 1 2 3 4 5 6 1 2 3 4 5 6 Brand Name 29 55 15 35 10 6 19 37 10 23 7 4 Quality 105 22 11 10 - 2 70 15 7 6 - 2 Price 4 22 54 33 24 13 3 15 36 22 11 10 Quantity 2 39 37 40 17 15 2 25 25 27 11 10 Prestige 8 5 16 19 45 57 5 3 11 13 30 38 Package 2 7 17 13 54 57 1 5 11 9 36 38 Total 150 150 150 150 150 150 100 100 100 100 100 100 Inference Brand Name: The above table infers exhibits that the 1st rank preferred by 19% of the respondents 2nd rank preferred by 37% of the respondents, 3rd rank preferred by 10% of the respondents, 4th rank for preferred by 23% of the respondents, 5th rank preferred by 7% of the respondents & 6th rank is preferred by 4% of the respondents. Quality: The above table refers that the 1st rank preferred by 70% of the respondents, 2nd rank preferred by 15% of the respondents 3rd rank preferred by 7% of the respondents, 4th rank preferred by 6% of the respondents,5th rank preferred by
  • 26.
    None of therespondents and 6th rank is preferred by 2% of the respondents. Price: The above table indicates that the 1st rank preferred by 3% of the respondents, 2nd rank preferred by 15% of the respondents, 3rd rank is preferred by 36% of the respondents, 4th rank is preferred by 22% of the respondents, 5th rank is preferred by 16% of the respondents and 6th rank is preferred by 8% of the respondents. Quantity: The above table tells that the 1st rank preferred by 2% of the respondents, 2nd rank preferred by 25% of the respondents, 3rd rank is preferred by 25% of the respondents, 4th rank is preferred by 27% of the respondents, 5th rank is preferred by 11% of the respondents and 6th rank is preferred by 10% of the respondents. Prestige: The above table exhibits that the 1st rank preferred by 5% of the respondents, 2nd rank preferred by 3% of the respondents, 3rd rank is preferred by 11% of the respondents, 4th rank is preferred by 13% of the respondents, 5th rank is preferred by 30% of the respondents and 6th rank is preferred by 38% of the respondents. Package: The above table interprets that the 1st rank preferred by 1% of the respondent, 2nd rank preferred by 5% of the respondents, 3rd rank preferred by 11% of the respondents, 4th rank preferred by 9% of the respondents, 5th rank preferred by 36% of the respondents and 6th rank is preferred by 38% of the respondents. Findings Demographic factor Based on this study demographic factor like age, gender, education, status, and income influence people indirectly for decision making. This is supported by following evidence. Demographic factors play a major role in children’s power to influence their parents. For example, Foxman et al. (1989) argue that age is a relevant variable as older children are presumed to be more knowledgeable about products and family needs. This is mainly due to their increase in cognitive development (Piaget, 1972). However, findings on whether product knowledge has a positive impact on teenagers’ influence differ (Beatty and Talpade, 1994). Adolescents were found to have greater influence in concept-oriented families, and if they had better grades (Foxman et al., 1989). Also, parental employment status (single versus dual income) appears to affect teens’ influences for some product categories (stereo phones) but not for others (TVs, VCRs, furniture) (Beatty and Talpade, 1994). For instance, adolescents from traditional homes, whose mothers have a career, are more influential in family decision making, possibly due to guilt on the mothers’ part (Lee and Beatty, 2002).When trying to influence their parents, children use different types of influence, e.g. bargaining, persuasion, emotional, and request strategy.
  • 27.
    According to importanceand time frame of the presumed purchase, six kinds of response strategies are normally used by parents (bargaining, persuasion, emotional, expert, legitimate, and directive strategy) (Palan and Wilkes, 1997). Usage Based on this study 80% of the consumers using toothpaste in Indore city.50% of the respondents are brushing twice in a day than once and thrice. When compare to other products like toothpowder and mouth wash, the availability of toothpaste is more in the market and also the package size is convenient for the consumer. So the usage rate is high for toothpaste. This also supported by following review. Assunçao and Meyer (1993) showed that consumption increases with inventory, not only because of the stock pressure from inventory holding costs, but also because higher inventories give consumers greater flexibility in consuming the product without having to worry about replacing it at high prices. Chiang (1995) found no category expansion effect in the detergent category. Wansink and Deshpandé (1994) showed in a lab study that promotional activity might cause consumers to consume a stockpiled product more quickly. The research performed by Wansink (1996) demonstrated that larger package sizes influence the usage volume of usage variant products, partially because larger packages are perceived to be less expensive to use (lower perceived unit costs). Awareness Based on this study the awareness level of toothpaste brand was less in Indore city People knows only the popular brands like Colgate, Pepsodent and Close-up. So they purchase only known brand. In Indore city most of the respondents aware of Colgate then Closeup and Pepsodent then regional players like Dabur, Anchor, and Ajanta. This is supported by the following review. Most of the respondents used 3 brands, two brands, and three. Due to Indian family set up most of the consumers using only one common toothpaste for the entire family. Oral care awareness and brand awareness is less in Indore city. Product awareness is an important factor for buying a product. The oral care awareness level is less in India, when compare to other counters like Europe and Thailand. Per capita consumption of toothpaste is only 70gm in India. In oral care toothpowder, toothpaste and toothbrush dominating the Indian market but in other countries mouth spray, mouth wash products also dominate in the market. Still in India rural area people are using neem and tobacco for brushing. So the manufacturing companies and government both are responsible for creating awareness through advertising campaign. Brand awareness can also effect decisions about brands within the consideration set (Hoyer and Brown, 1990; and Keller, 1993). Consumers may employ heuristic (decision
  • 28.
    rule to buyonly familiar well, established brands (Riselaus, 1971; and Jacoby et al; 1977, both sited in Keller, 1993). Consumers do not always spend a great deal of time making purchase decisions in a study of pre purchase search for laundry, Hoyer (1984) found that the median number of packages- store was around 1:2 before a selection was made. Dickson and Sawyer (1986) found that purchases such as coffee toothpaste and margarine, the consumer took an average 12 seconds from the time of first looking at the shelf’s to the time they placed in their trolley. Hoyer and Brown (1990) designed a controlled experiment probe the role of brand awareness in the process of consumer choice for the purchase of peanut, butter, whose results revealed that brand awareness was a dominant factor in both initial (trial) and repeat purchase decisions even when the quality of the selected brand was inferior to that of the other brands. Frequency of purchase Based on this study frequency of purchasing is based on the brushing habit and members in the family. Most of the respondents, buying once in a month, twice and thrice. So frequency of purchasing is mainly based on usage rate and promotional effect. This is supported by following review. The study of Fader and Lodish (1990) implied a positive relationship between high frequency of purchase and promotional elasticity. Based on Bawa and Shoemaker (1987), Narasimhan et al. (1996) hypothesized that shorter consumer inter purchase time’s result in more brand switching because the consumer must live with the consequences of buying a less preferred brand for a shorter period. In addition Narasimhan et al. conjectured that interpurchase times are related to purchase acceleration. Long inter purchase times discourage acceleration because the stockpiled product must be stored for a longer period of time. This was supported by empirical findings. Bell et al. (1999) found less stockpiling for often purchased products. 5.5 Dentist’s advice based on this survey most of the respondents accepted the advice of dentist to avoid dental problem, some respondents changed their brand due to taste problem, few respondents ignored the dentist advice because they felt that this is a sales promotion technique backed by company, some are not interested in oral care. The dentist to population ratio is a critically low 1:35000 in the country. This results in low oral hygiene consciousness and widespread dental diseases. So the Government and company is responsible for creating awareness through dental campaign to avoid dental problem and increase the consumption of toothpaste in India Price Based on this survey, most of the respondents are influenced by price then availability, and then packaging .For increasing the price of a product the company should consider the views of consumer otherwise the consumer switch over to competitor product. This is
  • 29.
    supported by thefollowing review. Vani, Ganesh, and Panchanatham (2009) discussed the price of toothpaste in their research work (Oral care segmentation) - Price wise toothpaste can be segmented as economy, regular and value added segment. The price range varies from Rs. 15-20 for a 100gm pack in the economy segment. Rs30-35 for a 100gm pack in the regular segment and Rs 50 for 100gm pack in the value added segment. So analyzing economic factor is an important task for the company to fix the price Product attributes Based on this study product attributes also influencing the consumers for decision making. Most of the respondents gave importance to healthy tooth and gums, prevention of tooth decay, herbal attribute, whiteness, long lasting freshness, and good foam. So people consider the benefit of the product for buying toothpaste. This supported by the following review. Vani, Ganesh and Panchanatham (2011) discussed the benefit of toothpaste in toothpaste buying model. In this article they discussed about decay prevention and brighter teeth.-Large number of families with children seriously concerned about the possibilities of cavities and shows a definite preference for fluoride toothpaste. Large group of young married people smoke more than average. They are giving importance to brighter teeth. So analyzing the requirement of people is important factor for selling the product successfully in the market Brand image Based on this study the preference for selecting toothpaste is mainly based on brand, n quality, and flavor. Brand image influencing the consumer mind and consumer feel the quality of the product. This is supported by the following review. Zeithaml, Parasuraman, and Berry (1985) suggested that the brand image was an extrinsic attribute of the product. He believed that the brand image has less impact compared to intrinsic attributes. Jacoby (1978) suggested that the brand image served as a channel for providing certain information to the customer. Rose lily (1971) noted that the brand image was considered to be a consistently favorable factor as a risk reliever. Zin khan & Martin (1978) found that the consumer has a more positive attitude toward the product with a brand image than toward the product with no brand image. Reference group Based on this study parents are influencing more for buying toothpaste then friends, spouse, kids and self-decision. So reference group also influencing the consumer in decision making. This is supported by the following review. Lamb, Hair & McDaniel
  • 30.
    (1998) suggested thatthe reference group provided three types of influences. Informational influence, normative influence, and identification influence. Informational influence means that an individual uses the behavior and options of group member to gather useful information. Normative influence refers to an individual’s achieving group expectations and gaining the respect of and sense of belonging to the group. Identification influence occurs when an individual internalizes the values and norms of the group. Advertising Based on this study majority of the respondents influenced by advertisement for buying toothpaste. In recent circumstances technology plays an important role in decision making; especially in advertising field the technology role is very high. Television advertisement inducing the consumer mind for decision making, especially kid’s advertisement for toothpaste influencing the kids to influence the parents to buy a particular brand. Other kind of advertisement in magazine, newspaper also influencing the people. Advertising is a strong base for consumer to select toothpaste. Celebrity endorsement also influencing the consumer for decision making; attractive banner in road side attracts the consumer to select a particular brand. This is supported by the following review. A successful nation economy depends on advertising promoting sales so that factory production is maintained, people are employed and have spending power, and the money goes round and round. Advertising, it has been conjectured in prior literature, shapes consumer preferences in multiple ways. The first, most obvious effect is that advertising informs the consumer of product attributes and hence raises awareness and knowledge of the true quality of the brand. This has been called the informative effect of advertising (Bucklin 1965, Lavidge and Steiner 1961).Second, advertising may directly influence a consumers brand evaluation through such cues as celebrity endorsements and music, even without providing any explicit information. This has been referred to as the persuasive or prestige effect of ads (Aaker & Stayman, 1990, Batra & Ray, 1986).Third, advertising can influence how consumers experience and evaluate the quality of the product from subsequent consumption. This effect has been evocatively referred to as the transformative effect of advertising (Deighton, 1984, 1988). Sales promotion Based on this study most of the respondents influenced by free gift, extra quantity and discount. So free gift influencing the customer for decision making. This is supported by the following review. Daly, Ellen in advertising impact using the power of promotional gifts. The power of promotional product rests with reciprocation. If the right gift is presented properly the recipient will want to give something back. So the free gift is an
  • 31.
    essential tool inpromoting the product. Normally human being is attracted by any kind of free gift. Brand switching Based on this study switching of one brand to other brand is mainly based on advertisement impact and offers provided by the companies. Sudden increase in price also affected the respondents to switch .Some respondent’s switch to other brand for trying new option. In some cases friends, kids, parents relatives influencing the people to switch. So promotion played an important role in switching. This is supported by the following review. Gupta (1988) concluded that more than 84% of the sales increase due to promotions is accounted for by brand switching (a very small part of which may be switching between different sizes of brands). . Bell et al. (1999) offer an empirical generalization on promotional response. They concluded that brand switching varies systematically across product categories. SUGGESTIONS  It is suggested that, the Pepsodent brand must take necessary steps to improve the availability of product in small shops.  In general, introducing the small size packages, the company will meet barriers like, less profit, sales and quantity because of high price and cost of production.  The new customers percentage is low in compared to existing customers. The company must capture the new customers/consumers to improve the sales and maximizing the existing profit.  It is fact that, in general most of the consumers are unaware of the toothpaste. Because the consumers are dissatisfied towards to purchase the toothpaste, it will leads to decreasing the reputation of the company. So, the company increasing to giving the offers, gifts and price cut to improve the reachability of the product in to the customers.  From consumer observation, most of the consumers are not satisfied with Colgate brand especially the packaging style of the brand. It is a notification to Research & Development Department to change the entire package of the brand.  It is interprets that, the Pepsodent company must take better steps to improve the innovative technology to introducing the freshness of the brand in the existing manufacturing style to reduce the competition and to make their brand as a monopoly on the market.  In general, the Pepsodent Company must follow some pricing strategy to cut the entire cost of the production to enhance the market share of the company.
  • 32.
    CONCLUSION Through the studymade at Indore, it is clear that Colgate & Pepsodent toothpaste have high awareness. Colgate & Pepsodent toothpaste have a wide market in and around Indore. The users of the Colgate toothpaste purchase the product due to its quality and brand loyalty. So compared to Pepsodent toothpaste, Colgate have more advantages and varieties. So I conclude that, Colgate toothpaste is best. Colgate is best and Colgate toothpaste is suits and attracts for all persons because of its availability, varieties and packages. LIMITATIONS My study suffers from some limitation, which could be avenues for further research. This study failed to talk about the psychographics of the consumer. Understanding psychographics of the consumer is an important tool to understand the inner feelings, and attitude of the consumer. The changing demographic profile of the population in terms of education, income, size of family and so on, are important by what will be more substantive in days to come will be the Psychographics of customers that is how they feel, think or behave. Marketers will have to constantly monitor and understand the underlying Psychographics to map their respective industries are moving and decide what needs to be done, by way of adding value that motivates customers to buy the company’s products and influence the future industry structure. One more problem in this study was questionnaire. Most of the questions are closed ended it limits the respondents answer. References Assunçao, J.L., and Meyer, J.R., (1993): The Rational Effect of Price Promotions on sales and Consumption, Management Science, 39(5): 517-535. Bawa, K., and Shoemaker. (1987): The Coupon-Prone Consumer: Some Findings Based on Purchase Behavior across Product Classes, Journal of Marketing, 51(4), 99-110. Bell, D.R., Chiang, J., and Padmanabhan, D. (1999): The Decomposition of Promotional Response, Marketing Science, 18 (4): 504-526. Daly, and Ellen. (1993): Advertising impact: Using the power of promotional gifts, The American Salesman, 38 (10):16. Del Hawkins, I., Roger Best, J. & Kenneth Coney, A. (2002): Consumer behaviour: Tata McGraw Hill Publishing Co Ltd: New Delhi Everything you wanted to know about toothpaste. Retrieved from www.saveyoursmile.com/toothtoothpaste/toothtoothpaste-a.html Fader, P.S., and Lodish, L.M. (1990): A Cross-Category Analysis of Category Structure and Promotional Activity for Grocery Products. Journal of Marketing, 54 (4): 52-65.
  • 33.
    Gupta, Sunil. (1988):Impact of sales promotions on when, what and how much to buy. Journal of Marketing Research, 25 (4): 342-355. Harish, K. S. (2009): Consumer Motivation Perception. Marketing Mastermind, 9(12): 47-48. Jacoby, J,. And Chestnut. (1978): Brand Loyalty, Measurement and Management. New York: John Wiley & Sons. Narasimhan, C. (1984): A price discrimination theory of coupons. Marketing Science, 3(2):128-147 Nitin Mehta, Xinlei(Jack) Chen,Om Narasimhan (2008): Informing, Transforming, and Persuading: Disentangling the Multiple Effects of Advertising on brand choice decision, Marketing Science 27(3):334 Rajendra, N. (2006): Market Research, New Delhi, ND: Tata McGraw Hills. Stephanie N., M. (2001): Consumers channel preferences: An integrated model. Unpublished Doctoral dissertation, Isenberg school of management),Retrieved from Proquest database Suja N., R. (2007): Consumer behavior in Indian perspective, Mumbai: Himalaya publishing House Sumathi, S., & Saranavel, P. (2003): Marketing Research &Consumer Behavior, Vikas publishing house: New Delhi The history of teeth cleaning, Retrieved from http://www.bbc.co.uk/dna/h2g2/A2818686 Tooth care products. Retrieved from http://www.bupa.co.uk/individuals/health-information Vani, G., Ganesh, B., M., & Panchanatham, N. (2009): Segmentation in Indian Oral care industry: An overview, SRM management digest Vani, G., Ganesh B, M., & Panchanatham, N. (2010): Oral care industry: Colgate’s smiley promos, Advertising Express Wansink, B., and Desphande, R. (1994: .Out of Sight, Out of Mind: Pantry Stockpiling and Brand-Usage Frequency, Marketing Letters, 5(1): 91-100. Zeithaml, V.A. (1988): Consumer Perceptions of Price, Quality, and Value: A Means- End Model and Synthesis of Evidence, Journal of Marketing, 52 (3): 2-22.