SlideShare a Scribd company logo
## Simple Linear Regression With R ##
#One should have the basic concept in statistics to understand this and the different terms associated with this work
sheet.
# Here we will use an inbuilt data from R called mtcars, you can use external data also
?mtcars # First we understand what the data set is.
data(mtcars) # to import the data set mtcars into R
names(mtcars) #See the names of the variables in the data set mtcars
attach(mtcars) #attach the data set mtcars to current workspace
plot(cyl, hp,main = "Scatterplot of Number of cylinders & Gross horsepower") #scatterplot of the data
cor(cyl, hp) #to find the correlation between two variables
fix(mtcars) #to change the data set if there is any mistake
?lm # Function for fiting linear model
reg1<-lm(hp ~ cyl) # to get the regression equation of a bivariate data i.e. hp and cyl, where we are predicting the
horse power using the variable cylinders, hp=y and cyl=x
reg1 # to see the object reg1
summary(reg1) # gives the whole summary for the regression equation
#We get the summary for residuals or errors i.e the minimum, Q1, Q2 or median, Q3 and Q4 or maximum
#Estimate gives the regression model or equation which is y = -51.054 + 31.958x
#Standard Error of the intercept and slope(the independent variable x1)
#T value is given for hypothesis test that the intercept and slope is zero = 0, test that intercept is 0 is often not
of interest.
#Pr - Probability is given for the intercept and slope is zero = 0, the value for cyl is 3.48e-09, the standard cut
off is .05 which means that Cyl is a good predictor for hp
#Residual standard error - measure of variation of individual observations around the regression line, this is the
same as the square root of the mean squared error or it is e = y - yhat
#R-square is 0.693 which means 69% of the variation in dependent variable (y) is explained or predicted by the
independent variable (x).
#Adjusted R-Square
#F-statistics is the F ratio for hypothesis test that all the coefficents in the model are 0. This test is used to
see if Xi(all the independent variables or variable) is a significant explanatory variable of dependent variable (y).
attributes(reg1) #we can see the list of attributes associated with the object reg1
reg1$rank # we can see each attributes of the object
reg1$coefficients # We ask for the coefficient of the model reg1
abline(reg1, lwd = 3, col = 2) # ploting the regression line on graph
confint(reg1) # to see the confidence interval
confint(reg1, level = 0.99) # to see the confidence interval at 99% significance
predict(reg1) # Prediction of Hp based on no. of cyl
predict(reg1, interval = "prediction") # Confidence interval for predicted values
anova(reg1) #ANOVA table for the regression model
sqrt(1491) # find the square root of Mean square of residuals = residual standard error
rm(list = ls()) # clear all the data set imported in to R
## By Jerome Gomes ##

More Related Content

What's hot

Piecewise and Step Functions
Piecewise and Step FunctionsPiecewise and Step Functions
Piecewise and Step Functions
ktini
 
Gaussseidel
GaussseidelGaussseidel
Gaussseidel
uis
 

What's hot (13)

Piecewise and Step Functions
Piecewise and Step FunctionsPiecewise and Step Functions
Piecewise and Step Functions
 
Introduction To Stack
Introduction To StackIntroduction To Stack
Introduction To Stack
 
Exponents Rules
Exponents RulesExponents Rules
Exponents Rules
 
Nonlinear Fitting Lecture
Nonlinear Fitting LectureNonlinear Fitting Lecture
Nonlinear Fitting Lecture
 
STACK ( LIFO STRUCTURE) - Data Structure
STACK ( LIFO STRUCTURE) - Data StructureSTACK ( LIFO STRUCTURE) - Data Structure
STACK ( LIFO STRUCTURE) - Data Structure
 
M correlation 1
M correlation 1M correlation 1
M correlation 1
 
Engineering Mechanics categories of equilibrium in three dimensions
Engineering Mechanics categories of equilibrium in three dimensionsEngineering Mechanics categories of equilibrium in three dimensions
Engineering Mechanics categories of equilibrium in three dimensions
 
Engineering Mechanics categories of equilibrium in two dimensions
Engineering Mechanics categories of equilibrium in two dimensionsEngineering Mechanics categories of equilibrium in two dimensions
Engineering Mechanics categories of equilibrium in two dimensions
 
Assessment 1
Assessment 1Assessment 1
Assessment 1
 
Stack project
Stack projectStack project
Stack project
 
Wk 6 part 2 non linearites and non linearization april 05
Wk 6 part 2 non linearites and non linearization april 05Wk 6 part 2 non linearites and non linearization april 05
Wk 6 part 2 non linearites and non linearization april 05
 
Stacks
StacksStacks
Stacks
 
Gaussseidel
GaussseidelGaussseidel
Gaussseidel
 

Viewers also liked

Meet Mercy
Meet MercyMeet Mercy
Meet Mercy
franzena
 
Sinaunang bagay,upload
Sinaunang bagay,uploadSinaunang bagay,upload
Sinaunang bagay,upload
Aliyah Fajardo
 

Viewers also liked (16)

Meet Mercy
Meet MercyMeet Mercy
Meet Mercy
 
Innovation og disruption i 2016
Innovation og disruption i 2016Innovation og disruption i 2016
Innovation og disruption i 2016
 
Company overview 2016 february
Company overview 2016 februaryCompany overview 2016 february
Company overview 2016 february
 
Sinaunang bagay,upload
Sinaunang bagay,uploadSinaunang bagay,upload
Sinaunang bagay,upload
 
ParadigmNEXT Capabilities Deck
ParadigmNEXT Capabilities DeckParadigmNEXT Capabilities Deck
ParadigmNEXT Capabilities Deck
 
презентация к викторине
презентация к викторинепрезентация к викторине
презентация к викторине
 
описательный лист
описательный листописательный лист
описательный лист
 
презентация Microsoft power point
презентация Microsoft power pointпрезентация Microsoft power point
презентация Microsoft power point
 
Tuberkuloza-Tuberculosis
Tuberkuloza-TuberculosisTuberkuloza-Tuberculosis
Tuberkuloza-Tuberculosis
 
Tobacco use and dependence
Tobacco use and dependenceTobacco use and dependence
Tobacco use and dependence
 
Une communication créative? Découvrez comment vous creuser la tête. Conférenc...
Une communication créative? Découvrez comment vous creuser la tête. Conférenc...Une communication créative? Découvrez comment vous creuser la tête. Conférenc...
Une communication créative? Découvrez comment vous creuser la tête. Conférenc...
 
2nd qtr 15 writing a two point outline
2nd qtr 15 writing a two point outline2nd qtr 15 writing a two point outline
2nd qtr 15 writing a two point outline
 
How To Make An Outline
How To Make An OutlineHow To Make An Outline
How To Make An Outline
 
A.MARWA REVOLT QNET: اسرار النجاح
A.MARWA REVOLT QNET: اسرار النجاح   A.MARWA REVOLT QNET: اسرار النجاح
A.MARWA REVOLT QNET: اسرار النجاح
 
Outlining
OutliningOutlining
Outlining
 
Averting a biodiversity crisis: AmphibiaWeb addresses the new Bsal threat
Averting a biodiversity crisis: AmphibiaWeb addresses the new Bsal threatAverting a biodiversity crisis: AmphibiaWeb addresses the new Bsal threat
Averting a biodiversity crisis: AmphibiaWeb addresses the new Bsal threat
 

Similar to Simple Linear Regression with R

14. Query Optimization in DBMS
14. Query Optimization in DBMS14. Query Optimization in DBMS
14. Query Optimization in DBMS
koolkampus
 
Predicting US house prices using Multiple Linear Regression in R
Predicting US house prices using Multiple Linear Regression in RPredicting US house prices using Multiple Linear Regression in R
Predicting US house prices using Multiple Linear Regression in R
Sotiris Baratsas
 
Relational operation final
Relational operation finalRelational operation final
Relational operation final
Student
 

Similar to Simple Linear Regression with R (20)

Regression diagnostics - Checking if linear regression assumptions are violat...
Regression diagnostics - Checking if linear regression assumptions are violat...Regression diagnostics - Checking if linear regression assumptions are violat...
Regression diagnostics - Checking if linear regression assumptions are violat...
 
Regression kriging
Regression krigingRegression kriging
Regression kriging
 
1. linear model, inference, prediction
1. linear model, inference, prediction1. linear model, inference, prediction
1. linear model, inference, prediction
 
4.3 Fitting Linear Models to Data
4.3 Fitting Linear Models to Data4.3 Fitting Linear Models to Data
4.3 Fitting Linear Models to Data
 
working with python
working with pythonworking with python
working with python
 
NCCU: Statistics in the Criminal Justice System, R basics and Simulation - Pr...
NCCU: Statistics in the Criminal Justice System, R basics and Simulation - Pr...NCCU: Statistics in the Criminal Justice System, R basics and Simulation - Pr...
NCCU: Statistics in the Criminal Justice System, R basics and Simulation - Pr...
 
14. Query Optimization in DBMS
14. Query Optimization in DBMS14. Query Optimization in DBMS
14. Query Optimization in DBMS
 
R9
R9R9
R9
 
Predicting US house prices using Multiple Linear Regression in R
Predicting US house prices using Multiple Linear Regression in RPredicting US house prices using Multiple Linear Regression in R
Predicting US house prices using Multiple Linear Regression in R
 
Linear Regression.pptx
Linear Regression.pptxLinear Regression.pptx
Linear Regression.pptx
 
354 ch6
354 ch6354 ch6
354 ch6
 
Relational operation final
Relational operation finalRelational operation final
Relational operation final
 
Assignment in regression1
Assignment in regression1Assignment in regression1
Assignment in regression1
 
2 data structure in R
2 data structure in R2 data structure in R
2 data structure in R
 
Relational Algebra Ch6 (Navathe 4th edition)/ Ch7 (Navathe 3rd edition)
Relational Algebra Ch6 (Navathe 4th edition)/ Ch7 (Navathe 3rd edition)Relational Algebra Ch6 (Navathe 4th edition)/ Ch7 (Navathe 3rd edition)
Relational Algebra Ch6 (Navathe 4th edition)/ Ch7 (Navathe 3rd edition)
 
Prediction of house price using multiple regression
Prediction of house price using multiple regressionPrediction of house price using multiple regression
Prediction of house price using multiple regression
 
Curvefitting
CurvefittingCurvefitting
Curvefitting
 
Linear Regression
Linear Regression Linear Regression
Linear Regression
 
Module 2-2.ppt
Module 2-2.pptModule 2-2.ppt
Module 2-2.ppt
 
Linear Regression
Linear RegressionLinear Regression
Linear Regression
 

Recently uploaded

一比一原版(UVic毕业证)维多利亚大学毕业证成绩单
一比一原版(UVic毕业证)维多利亚大学毕业证成绩单一比一原版(UVic毕业证)维多利亚大学毕业证成绩单
一比一原版(UVic毕业证)维多利亚大学毕业证成绩单
ukgaet
 
一比一原版(TWU毕业证)西三一大学毕业证成绩单
一比一原版(TWU毕业证)西三一大学毕业证成绩单一比一原版(TWU毕业证)西三一大学毕业证成绩单
一比一原版(TWU毕业证)西三一大学毕业证成绩单
ocavb
 
做(mqu毕业证书)麦考瑞大学毕业证硕士文凭证书学费发票原版一模一样
做(mqu毕业证书)麦考瑞大学毕业证硕士文凭证书学费发票原版一模一样做(mqu毕业证书)麦考瑞大学毕业证硕士文凭证书学费发票原版一模一样
做(mqu毕业证书)麦考瑞大学毕业证硕士文凭证书学费发票原版一模一样
axoqas
 
一比一原版(IIT毕业证)伊利诺伊理工大学毕业证成绩单
一比一原版(IIT毕业证)伊利诺伊理工大学毕业证成绩单一比一原版(IIT毕业证)伊利诺伊理工大学毕业证成绩单
一比一原版(IIT毕业证)伊利诺伊理工大学毕业证成绩单
ewymefz
 
一比一原版(ArtEZ毕业证)ArtEZ艺术学院毕业证成绩单
一比一原版(ArtEZ毕业证)ArtEZ艺术学院毕业证成绩单一比一原版(ArtEZ毕业证)ArtEZ艺术学院毕业证成绩单
一比一原版(ArtEZ毕业证)ArtEZ艺术学院毕业证成绩单
vcaxypu
 
一比一原版(UMich毕业证)密歇根大学|安娜堡分校毕业证成绩单
一比一原版(UMich毕业证)密歇根大学|安娜堡分校毕业证成绩单一比一原版(UMich毕业证)密歇根大学|安娜堡分校毕业证成绩单
一比一原版(UMich毕业证)密歇根大学|安娜堡分校毕业证成绩单
ewymefz
 
一比一原版(BU毕业证)波士顿大学毕业证成绩单
一比一原版(BU毕业证)波士顿大学毕业证成绩单一比一原版(BU毕业证)波士顿大学毕业证成绩单
一比一原版(BU毕业证)波士顿大学毕业证成绩单
ewymefz
 
Empowering Data Analytics Ecosystem.pptx
Empowering Data Analytics Ecosystem.pptxEmpowering Data Analytics Ecosystem.pptx
Empowering Data Analytics Ecosystem.pptx
benishzehra469
 
Investigate & Recover / StarCompliance.io / Crypto_Crimes
Investigate & Recover / StarCompliance.io / Crypto_CrimesInvestigate & Recover / StarCompliance.io / Crypto_Crimes
Investigate & Recover / StarCompliance.io / Crypto_Crimes
StarCompliance.io
 
一比一原版(UPenn毕业证)宾夕法尼亚大学毕业证成绩单
一比一原版(UPenn毕业证)宾夕法尼亚大学毕业证成绩单一比一原版(UPenn毕业证)宾夕法尼亚大学毕业证成绩单
一比一原版(UPenn毕业证)宾夕法尼亚大学毕业证成绩单
ewymefz
 
Professional Data Engineer Certification Exam Guide  _  Learn  _  Google Clou...
Professional Data Engineer Certification Exam Guide  _  Learn  _  Google Clou...Professional Data Engineer Certification Exam Guide  _  Learn  _  Google Clou...
Professional Data Engineer Certification Exam Guide  _  Learn  _  Google Clou...
Domenico Conte
 

Recently uploaded (20)

一比一原版(UVic毕业证)维多利亚大学毕业证成绩单
一比一原版(UVic毕业证)维多利亚大学毕业证成绩单一比一原版(UVic毕业证)维多利亚大学毕业证成绩单
一比一原版(UVic毕业证)维多利亚大学毕业证成绩单
 
2024-05-14 - Tableau User Group - TC24 Hot Topics - Tableau Pulse and Einstei...
2024-05-14 - Tableau User Group - TC24 Hot Topics - Tableau Pulse and Einstei...2024-05-14 - Tableau User Group - TC24 Hot Topics - Tableau Pulse and Einstei...
2024-05-14 - Tableau User Group - TC24 Hot Topics - Tableau Pulse and Einstei...
 
一比一原版(TWU毕业证)西三一大学毕业证成绩单
一比一原版(TWU毕业证)西三一大学毕业证成绩单一比一原版(TWU毕业证)西三一大学毕业证成绩单
一比一原版(TWU毕业证)西三一大学毕业证成绩单
 
做(mqu毕业证书)麦考瑞大学毕业证硕士文凭证书学费发票原版一模一样
做(mqu毕业证书)麦考瑞大学毕业证硕士文凭证书学费发票原版一模一样做(mqu毕业证书)麦考瑞大学毕业证硕士文凭证书学费发票原版一模一样
做(mqu毕业证书)麦考瑞大学毕业证硕士文凭证书学费发票原版一模一样
 
一比一原版(IIT毕业证)伊利诺伊理工大学毕业证成绩单
一比一原版(IIT毕业证)伊利诺伊理工大学毕业证成绩单一比一原版(IIT毕业证)伊利诺伊理工大学毕业证成绩单
一比一原版(IIT毕业证)伊利诺伊理工大学毕业证成绩单
 
Predicting Product Ad Campaign Performance: A Data Analysis Project Presentation
Predicting Product Ad Campaign Performance: A Data Analysis Project PresentationPredicting Product Ad Campaign Performance: A Data Analysis Project Presentation
Predicting Product Ad Campaign Performance: A Data Analysis Project Presentation
 
一比一原版(ArtEZ毕业证)ArtEZ艺术学院毕业证成绩单
一比一原版(ArtEZ毕业证)ArtEZ艺术学院毕业证成绩单一比一原版(ArtEZ毕业证)ArtEZ艺术学院毕业证成绩单
一比一原版(ArtEZ毕业证)ArtEZ艺术学院毕业证成绩单
 
一比一原版(UMich毕业证)密歇根大学|安娜堡分校毕业证成绩单
一比一原版(UMich毕业证)密歇根大学|安娜堡分校毕业证成绩单一比一原版(UMich毕业证)密歇根大学|安娜堡分校毕业证成绩单
一比一原版(UMich毕业证)密歇根大学|安娜堡分校毕业证成绩单
 
Business update Q1 2024 Lar España Real Estate SOCIMI
Business update Q1 2024 Lar España Real Estate SOCIMIBusiness update Q1 2024 Lar España Real Estate SOCIMI
Business update Q1 2024 Lar España Real Estate SOCIMI
 
一比一原版(BU毕业证)波士顿大学毕业证成绩单
一比一原版(BU毕业证)波士顿大学毕业证成绩单一比一原版(BU毕业证)波士顿大学毕业证成绩单
一比一原版(BU毕业证)波士顿大学毕业证成绩单
 
Criminal IP - Threat Hunting Webinar.pdf
Criminal IP - Threat Hunting Webinar.pdfCriminal IP - Threat Hunting Webinar.pdf
Criminal IP - Threat Hunting Webinar.pdf
 
Innovative Methods in Media and Communication Research by Sebastian Kubitschk...
Innovative Methods in Media and Communication Research by Sebastian Kubitschk...Innovative Methods in Media and Communication Research by Sebastian Kubitschk...
Innovative Methods in Media and Communication Research by Sebastian Kubitschk...
 
Empowering Data Analytics Ecosystem.pptx
Empowering Data Analytics Ecosystem.pptxEmpowering Data Analytics Ecosystem.pptx
Empowering Data Analytics Ecosystem.pptx
 
Investigate & Recover / StarCompliance.io / Crypto_Crimes
Investigate & Recover / StarCompliance.io / Crypto_CrimesInvestigate & Recover / StarCompliance.io / Crypto_Crimes
Investigate & Recover / StarCompliance.io / Crypto_Crimes
 
一比一原版(UPenn毕业证)宾夕法尼亚大学毕业证成绩单
一比一原版(UPenn毕业证)宾夕法尼亚大学毕业证成绩单一比一原版(UPenn毕业证)宾夕法尼亚大学毕业证成绩单
一比一原版(UPenn毕业证)宾夕法尼亚大学毕业证成绩单
 
Jpolillo Amazon PPC - Bid Optimization Sample
Jpolillo Amazon PPC - Bid Optimization SampleJpolillo Amazon PPC - Bid Optimization Sample
Jpolillo Amazon PPC - Bid Optimization Sample
 
Q1’2024 Update: MYCI’s Leap Year Rebound
Q1’2024 Update: MYCI’s Leap Year ReboundQ1’2024 Update: MYCI’s Leap Year Rebound
Q1’2024 Update: MYCI’s Leap Year Rebound
 
tapal brand analysis PPT slide for comptetive data
tapal brand analysis PPT slide for comptetive datatapal brand analysis PPT slide for comptetive data
tapal brand analysis PPT slide for comptetive data
 
Professional Data Engineer Certification Exam Guide  _  Learn  _  Google Clou...
Professional Data Engineer Certification Exam Guide  _  Learn  _  Google Clou...Professional Data Engineer Certification Exam Guide  _  Learn  _  Google Clou...
Professional Data Engineer Certification Exam Guide  _  Learn  _  Google Clou...
 
Chatty Kathy - UNC Bootcamp Final Project Presentation - Final Version - 5.23...
Chatty Kathy - UNC Bootcamp Final Project Presentation - Final Version - 5.23...Chatty Kathy - UNC Bootcamp Final Project Presentation - Final Version - 5.23...
Chatty Kathy - UNC Bootcamp Final Project Presentation - Final Version - 5.23...
 

Simple Linear Regression with R

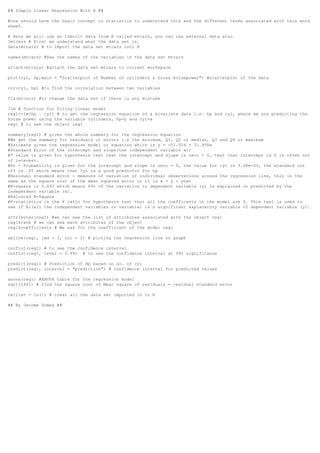
  • 1. ## Simple Linear Regression With R ## #One should have the basic concept in statistics to understand this and the different terms associated with this work sheet. # Here we will use an inbuilt data from R called mtcars, you can use external data also ?mtcars # First we understand what the data set is. data(mtcars) # to import the data set mtcars into R names(mtcars) #See the names of the variables in the data set mtcars attach(mtcars) #attach the data set mtcars to current workspace plot(cyl, hp,main = "Scatterplot of Number of cylinders & Gross horsepower") #scatterplot of the data cor(cyl, hp) #to find the correlation between two variables fix(mtcars) #to change the data set if there is any mistake ?lm # Function for fiting linear model reg1<-lm(hp ~ cyl) # to get the regression equation of a bivariate data i.e. hp and cyl, where we are predicting the horse power using the variable cylinders, hp=y and cyl=x reg1 # to see the object reg1 summary(reg1) # gives the whole summary for the regression equation #We get the summary for residuals or errors i.e the minimum, Q1, Q2 or median, Q3 and Q4 or maximum #Estimate gives the regression model or equation which is y = -51.054 + 31.958x #Standard Error of the intercept and slope(the independent variable x1) #T value is given for hypothesis test that the intercept and slope is zero = 0, test that intercept is 0 is often not of interest. #Pr - Probability is given for the intercept and slope is zero = 0, the value for cyl is 3.48e-09, the standard cut off is .05 which means that Cyl is a good predictor for hp #Residual standard error - measure of variation of individual observations around the regression line, this is the same as the square root of the mean squared error or it is e = y - yhat #R-square is 0.693 which means 69% of the variation in dependent variable (y) is explained or predicted by the independent variable (x). #Adjusted R-Square #F-statistics is the F ratio for hypothesis test that all the coefficents in the model are 0. This test is used to see if Xi(all the independent variables or variable) is a significant explanatory variable of dependent variable (y). attributes(reg1) #we can see the list of attributes associated with the object reg1 reg1$rank # we can see each attributes of the object reg1$coefficients # We ask for the coefficient of the model reg1 abline(reg1, lwd = 3, col = 2) # ploting the regression line on graph confint(reg1) # to see the confidence interval confint(reg1, level = 0.99) # to see the confidence interval at 99% significance predict(reg1) # Prediction of Hp based on no. of cyl predict(reg1, interval = "prediction") # Confidence interval for predicted values anova(reg1) #ANOVA table for the regression model sqrt(1491) # find the square root of Mean square of residuals = residual standard error rm(list = ls()) # clear all the data set imported in to R ## By Jerome Gomes ##