Deposits and loans in Qatar's banking sector grew in June 2013. Deposits increased 4.8% month-over-month (MoM) and 16.8% year-to-date (YTD), while loans ticked up 1.0% MoM and 6.6% YTD. As a result, the loan-to-deposit ratio declined to 102% in June from 105% in May. Public sector deposits surged 12.7% MoM, driven by growth in government institutions, while private sector deposits were flat. Loan growth was supported by a 1.9% MoM rise in private sector loans. The document provides statistics on deposits, loans, and loan-to-
What are the different types of hybrid funds and do they stay true to label, or are they biased towards equities? Through this presentation, find details about a mutual fund that diversifies across asset classes of equity, debt and gold and manages market ups & downs.
www.Quantumamc.com
What are the fundamentals underlying the bull run in the equity markets and how do investors position their portfolio to reap returns and minimize downside risks? Find answers to what do investors expect from the future of the equity markets?
www.Quantumamc.com
How do investors pick the winning asset class? What is the importance of asset allocation and how do you build an effective asset allocation strategy? Through this deck, find answers to the benefits of equity, debt and gold assets and how does one select mutual funds to fulfill long term goals.
www.Quantumamc.com
Case study-Kuwaiti banks performance
رويال كلاس للبحوث الأكاديمية والدراسات العليا بالكويت
Contact Us at:
info@royalclassacd.com
http://www.royalclassacd.com
QNBFS Daily Market Report December 24, 2023QNB Group
The QE Index rose 0.8% to close at 10,285.3. Gains were led by the Transportation and Banks & Financial Services indices, gaining 1.4% and 1.2%, respectively.
QNBFS Daily Market Report October 04, 2023QNB Group
The QE Index rose 0.2% to close at 10,273.3. Gains were led by the Transportation and Consumer Goods & Services indices, gaining 1.7% and 0.1%, respectively.
QNBFS Daily Technical Trader Qatar - October 04, 2023 التحليل الفني اليومي لب...QNB Group
The General Index failed to sustain its breakout above the double-bottom formation’s neckline and continued with its decline into the formation’s territory.
QNBFS Daily Technical Trader Qatar - September 28, 2023 التحليل الفني اليومي ...QNB Group
The General Index failed to sustain its breakout above the double-bottom formation’s neckline and continued with its decline into the formation’s territory.
QNBFS Daily Market Report September 24, 2023QNB Group
The QE Index rose 0.3% to close at 10,323.0. Gains were led by the Transportation and Industrials indices, gaining 0.8% each. Top gainers were Qatar Navigation and Al Khaleej Takaful Insurance Co., rising 3.3% and 2.0%, respectively.
QNBFS Daily Technical Trader Qatar - September 24, 2023 التحليل الفني اليومي ...QNB Group
The General Index failed to sustain its breakout above the double-bottom formation’s neckline and continued with its decline into the formation’s territory.
QNBFS Daily Technical Trader Qatar - September 19, 2023 التحليل الفني اليومي ...QNB Group
The General Index failed to sustain its breakout above the double-bottom formation’s neckline and continued with its decline into the formation’s territory.
QNBFS Daily Market Report September 17, 2023QNB Group
The QE Index declined 0.5% to close at 10,319.3. Losses were led by the Industrials and Consumer Goods & Services indices, falling 1.4% and 1.1%, respectively.
QNBFS Daily Technical Trader Qatar - September 07, 2023 التحليل الفني اليومي ...QNB Group
The General Index failed to
sustain its breakout above the
double-bottom formation’s
neckline and continued with
its decline into the
formation’s territory.
what is the best method to sell pi coins in 2024DOT TECH
The best way to sell your pi coins safely is trading with an exchange..but since pi is not launched in any exchange, and second option is through a VERIFIED pi merchant.
Who is a pi merchant?
A pi merchant is someone who buys pi coins from miners and pioneers and resell them to Investors looking forward to hold massive amounts before mainnet launch in 2026.
I will leave the telegram contact of my personal pi merchant to trade pi coins with.
@Pi_vendor_247
how can i use my minded pi coins I need some funds.DOT TECH
If you are interested in selling your pi coins, i have a verified pi merchant, who buys pi coins and resell them to exchanges looking forward to hold till mainnet launch.
Because the core team has announced that pi network will not be doing any pre-sale. The only way exchanges like huobi, bitmart and hotbit can get pi is by buying from miners.
Now a merchant stands in between these exchanges and the miners. As a link to make transactions smooth. Because right now in the enclosed mainnet you can't sell pi coins your self. You need the help of a merchant,
i will leave the telegram contact of my personal pi merchant below. 👇 I and my friends has traded more than 3000pi coins with him successfully.
@Pi_vendor_247
USDA Loans in California: A Comprehensive Overview.pptxmarketing367770
USDA Loans in California: A Comprehensive Overview
If you're dreaming of owning a home in California's rural or suburban areas, a USDA loan might be the perfect solution. The U.S. Department of Agriculture (USDA) offers these loans to help low-to-moderate-income individuals and families achieve homeownership.
Key Features of USDA Loans:
Zero Down Payment: USDA loans require no down payment, making homeownership more accessible.
Competitive Interest Rates: These loans often come with lower interest rates compared to conventional loans.
Flexible Credit Requirements: USDA loans have more lenient credit score requirements, helping those with less-than-perfect credit.
Guaranteed Loan Program: The USDA guarantees a portion of the loan, reducing risk for lenders and expanding borrowing options.
Eligibility Criteria:
Location: The property must be located in a USDA-designated rural or suburban area. Many areas in California qualify.
Income Limits: Applicants must meet income guidelines, which vary by region and household size.
Primary Residence: The home must be used as the borrower's primary residence.
Application Process:
Find a USDA-Approved Lender: Not all lenders offer USDA loans, so it's essential to choose one approved by the USDA.
Pre-Qualification: Determine your eligibility and the amount you can borrow.
Property Search: Look for properties in eligible rural or suburban areas.
Loan Application: Submit your application, including financial and personal information.
Processing and Approval: The lender and USDA will review your application. If approved, you can proceed to closing.
USDA loans are an excellent option for those looking to buy a home in California's rural and suburban areas. With no down payment and flexible requirements, these loans make homeownership more attainable for many families. Explore your eligibility today and take the first step toward owning your dream home.
How to get verified on Coinbase Account?_.docxBuy bitget
t's important to note that buying verified Coinbase accounts is not recommended and may violate Coinbase's terms of service. Instead of searching to "buy verified Coinbase accounts," follow the proper steps to verify your own account to ensure compliance and security.
If you are looking for a pi coin investor. Then look no further because I have the right one he is a pi vendor (he buy and resell to whales in China). I met him on a crypto conference and ever since I and my friends have sold more than 10k pi coins to him And he bought all and still want more. I will drop his telegram handle below just send him a message.
@Pi_vendor_247
Poonawalla Fincorp and IndusInd Bank Introduce New Co-Branded Credit Cardnickysharmasucks
The unveiling of the IndusInd Bank Poonawalla Fincorp eLITE RuPay Platinum Credit Card marks a notable milestone in the Indian financial landscape, showcasing a successful partnership between two leading institutions, Poonawalla Fincorp and IndusInd Bank. This co-branded credit card not only offers users a plethora of benefits but also reflects a commitment to innovation and adaptation. With a focus on providing value-driven and customer-centric solutions, this launch represents more than just a new product—it signifies a step towards redefining the banking experience for millions. Promising convenience, rewards, and a touch of luxury in everyday financial transactions, this collaboration aims to cater to the evolving needs of customers and set new standards in the industry.
Falcon stands out as a top-tier P2P Invoice Discounting platform in India, bridging esteemed blue-chip companies and eager investors. Our goal is to transform the investment landscape in India by establishing a comprehensive destination for borrowers and investors with diverse profiles and needs, all while minimizing risk. What sets Falcon apart is the elimination of intermediaries such as commercial banks and depository institutions, allowing investors to enjoy higher yields.
how to sell pi coins effectively (from 50 - 100k pi)DOT TECH
Anywhere in the world, including Africa, America, and Europe, you can sell Pi Network Coins online and receive cash through online payment options.
Pi has not yet been launched on any exchange because we are currently using the confined Mainnet. The planned launch date for Pi is June 28, 2026.
Reselling to investors who want to hold until the mainnet launch in 2026 is currently the sole way to sell.
Consequently, right now. All you need to do is select the right pi network provider.
Who is a pi merchant?
An individual who buys coins from miners on the pi network and resells them to investors hoping to hang onto them until the mainnet is launched is known as a pi merchant.
debuts.
I'll provide you the Telegram username
@Pi_vendor_247
Empowering the Unbanked: The Vital Role of NBFCs in Promoting Financial Inclu...Vighnesh Shashtri
In India, financial inclusion remains a critical challenge, with a significant portion of the population still unbanked. Non-Banking Financial Companies (NBFCs) have emerged as key players in bridging this gap by providing financial services to those often overlooked by traditional banking institutions. This article delves into how NBFCs are fostering financial inclusion and empowering the unbanked.
Currently pi network is not tradable on binance or any other exchange because we are still in the enclosed mainnet.
Right now the only way to sell pi coins is by trading with a verified merchant.
What is a pi merchant?
A pi merchant is someone verified by pi network team and allowed to barter pi coins for goods and services.
Since pi network is not doing any pre-sale The only way exchanges like binance/huobi or crypto whales can get pi is by buying from miners. And a merchant stands in between the exchanges and the miners.
I will leave the telegram contact of my personal pi merchant. I and my friends has traded more than 6000pi coins successfully
Tele-gram
@Pi_vendor_247
US Economic Outlook - Being Decided - M Capital Group August 2021.pdfpchutichetpong
The U.S. economy is continuing its impressive recovery from the COVID-19 pandemic and not slowing down despite re-occurring bumps. The U.S. savings rate reached its highest ever recorded level at 34% in April 2020 and Americans seem ready to spend. The sectors that had been hurt the most by the pandemic specifically reduced consumer spending, like retail, leisure, hospitality, and travel, are now experiencing massive growth in revenue and job openings.
Could this growth lead to a “Roaring Twenties”? As quickly as the U.S. economy contracted, experiencing a 9.1% drop in economic output relative to the business cycle in Q2 2020, the largest in recorded history, it has rebounded beyond expectations. This surprising growth seems to be fueled by the U.S. government’s aggressive fiscal and monetary policies, and an increase in consumer spending as mobility restrictions are lifted. Unemployment rates between June 2020 and June 2021 decreased by 5.2%, while the demand for labor is increasing, coupled with increasing wages to incentivize Americans to rejoin the labor force. Schools and businesses are expected to fully reopen soon. In parallel, vaccination rates across the country and the world continue to rise, with full vaccination rates of 50% and 14.8% respectively.
However, it is not completely smooth sailing from here. According to M Capital Group, the main risks that threaten the continued growth of the U.S. economy are inflation, unsettled trade relations, and another wave of Covid-19 mutations that could shut down the world again. Have we learned from the past year of COVID-19 and adapted our economy accordingly?
“In order for the U.S. economy to continue growing, whether there is another wave or not, the U.S. needs to focus on diversifying supply chains, supporting business investment, and maintaining consumer spending,” says Grace Feeley, a research analyst at M Capital Group.
While the economic indicators are positive, the risks are coming closer to manifesting and threatening such growth. The new variants spreading throughout the world, Delta, Lambda, and Gamma, are vaccine-resistant and muddy the predictions made about the economy and health of the country. These variants bring back the feeling of uncertainty that has wreaked havoc not only on the stock market but the mindset of people around the world. MCG provides unique insight on how to mitigate these risks to possibly ensure a bright economic future.
Exploring Abhay Bhutada’s Views After Poonawalla Fincorp’s Collaboration With...beulahfernandes8
The financial landscape in India has witnessed a significant development with the recent collaboration between Poonawalla Fincorp and IndusInd Bank.
The launch of the co-branded credit card, the IndusInd Bank Poonawalla Fincorp eLITE RuPay Platinum Credit Card, marks a major milestone for both entities.
This strategic move aims to redefine and elevate the banking experience for customers.
The European Unemployment Puzzle: implications from population agingGRAPE
We study the link between the evolving age structure of the working population and unemployment. We build a large new Keynesian OLG model with a realistic age structure, labor market frictions, sticky prices, and aggregate shocks. Once calibrated to the European economy, we quantify the extent to which demographic changes over the last three decades have contributed to the decline of the unemployment rate. Our findings yield important implications for the future evolution of unemployment given the anticipated further aging of the working population in Europe. We also quantify the implications for optimal monetary policy: lowering inflation volatility becomes less costly in terms of GDP and unemployment volatility, which hints that optimal monetary policy may be more hawkish in an aging society. Finally, our results also propose a partial reversal of the European-US unemployment puzzle due to the fact that the share of young workers is expected to remain robust in the US.
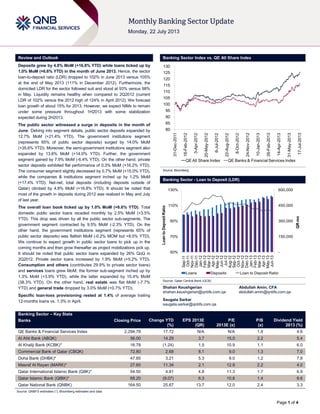
1. Page 1 of 4
Review and Outlook Banking Sector Index vs. QE All Share Index
Deposits grew by 4.8% MoM (+16.8% YTD) while loans ticked up by
1.0% MoM (+6.6% YTD) in the month of June 2013. Hence, the sector
loan-to-deposit ratio (LDR) dropped to 102% in June 2013 versus 105%
at the end of May 2013 (111% in December 2012). Furthermore, the
domiciled LDR for the sector followed suit and stood at 93% versus 98%
in May. Liquidity remains healthy when compared to 2Q2012 (current
LDR of 102% versus the 2012 high of 124% in April 2012). We forecast
loan growth of about 15% for 2013. However, we expect NIMs to remain
under some pressure throughout 1H2013 with some stabilization
expected during 2H2013.
The public sector witnessed a surge in deposits in the month of
June. Delving into segment details, public sector deposits expanded by
12.7% MoM (+21.4% YTD). The government institutions segment
(represents 65% of public sector deposits) surged by 14.0% MoM
(+35.6% YTD). Moreover, the semi-government institutions segment also
expanded by 13.6% MoM (+14.0% YTD). Further, the government
segment gained by 7.9% MoM (-6.4% YTD). On the other hand, private
sector deposits exhibited flat performance of 0.3% MoM (+16.2% YTD).
The consumer segment slightly decreased by 0.7% MoM (+15.0% YTD),
while the companies & institutions segment inched up by 1.2% MoM
(+17.4% YTD). Net-net, total deposits (including deposits outside of
Qatar) climbed by 4.8% MoM (+16.8% YTD). It should be noted that
most of the growth in deposits during 2012 was realized in May and July
of last year.
The overall loan book ticked up by 1.0% MoM (+6.6% YTD). Total
domestic public sector loans receded monthly by 2.5% MoM (+3.5%
YTD). This drop was driven by all the public sector sub-segments. The
government segment contracted by 9.5% MoM (-2.3% YTD). On the
other hand, the government institutions segment (represents 65% of
public sector deposits) was flattish MoM (-0.2% MOM but +8.5% YTD).
We continue to expect growth in public sector loans to pick up in the
coming months and then grow thereafter as project mobilizations pick up.
It should be noted that public sector loans expanded by 26% QoQ in
2Q2012. Private sector loans increased by 1.9% MoM (+5.2% YTD).
Consumption and others (contributes 29.9% to private sector loans)
and services loans grew MoM; the former sub-segment inched up by
1.3% MoM (+3.9% YTD), while the latter expanded by 10.4% MoM
(38.3% YTD). On the other hand, real estate was flat MoM (-7.7%
YTD) and general trade dropped by 3.0% MoM (+0.7% YTD).
Specific loan-loss provisioning rested at 1.4% of average trailing
12-months loans vs. 1.3% in April.
Source: Bloomberg
Banking Sector - Loan to Deposit (LDR)
Source: Qatar Central Bank (QCB)
Shahan Keushgerian Abdullah Amin, CFA
shahan.keushgerian@qnbfs.com.qa abdullah.amin@qnbfs.com.qa
Saugata Sarkar
saugata.sarkar@qnbfs.com.qa
Banking Sector – Key Stats
Banks Closing Price Change YTD
(%)
EPS 2013E
(QR)
P/E
2013E (x)
P/B
(x)
Dividend Yield
2013 (%)
QE Banks & Financial Services Index 2,294.78 17.72 N/A N/A 1.8 4.6
Al Ahli Bank (ABQK) 56.00 14.29 3.7 15.0 2.2 5.4
Al Khaliji Bank (KCBK)* 16.78 (1.24) 1.5 10.9 1.1 6.0
Commercial Bank of Qatar (CBQK) 72.80 2.68 8.1 9.0 1.3 7.0
Doha Bank (DHBK)* 47.85 3.21 5.3 9.0 1.2 7.8
Masraf Al Rayan (MARK)* 27.60 11.34 2.1 12.9 2.2 4.0
Qatar International Islamic Bank (QIIK)* 54.50 4.81 4.8 11.3 1.7 6.9
Qatar Islamic Bank (QIBK)* 68.20 (9.07) 6.3 10.8 1.4 6.6
Qatar National Bank (QNBK) 164.50 25.67 13.7 12.0 2.4 3.3
Source: QNBFS estimates (*), Bloomberg estimates and data
80
85
90
95
100
105
110
115
120
125
130
31-Dec-2011
16-Feb-2012
3-Apr-2012
20-May-2012
6-Jul-2012
22-Aug-2012
8-Oct-2012
24-Nov-2012
10-Jan-2013
26-Feb-2013
14-Apr-2013
31-May-2013
17-Jul-2013
QEAll Share Index QE Banks & Financial Services Index
-
150,000
300,000
450,000
600,000
50%
70%
90%
110%
130%
Sep-11
Oct-11
Nov-11
Dec-11
Jan-12
Feb-12
Mar-12
Apr-12
May-12
Jun-12
Jul-12
Aug-12
Sep-12
Oct-12
Nov-12
Dec-12
Jan-13
Feb-13
Mar-13
Apr-13
May-13
Jun-13
QRmn
LoantoDepositRatio
Loans Deposits Loan to Deposit Ratio
4. Contacts
Ahmed M. Shehada Keith Whitney Saugata Sarkar Sahbi Kasraoui
Head of Trading Head of Sales Head of Research Manager - HNWI
Tel: (+974) 4476 6535 Tel: (+974) 4476 6533 Tel: (+974) 4476 6534 Tel: (+974) 4476 6544
ahmed.shehada@qnbfs.com.qa keith.whitney@qnbfs.com.qa saugata.sarkar@qnbfs.com.qa sahbi.alkasraoui@qnbfs.com.qa
QNB Financial Services SPC
Contact Center: (+974) 4476 6666
PO Box 24025, Doha, Qatar
DISCLAIMER: This publication has been prepared by QNB Financial Services SPC (“QNBFS”) a wholly-owned subsidiary of Qatar National Bank (“QNB”). QNBFS is regulated by the Qatar
Financial Markets Authority and the Qatar Exchange; QNB is regulated by the Qatar Central Bank. This publication expresses the views and opinions of QNBFS at a given time only. It is not
an offer, promotion or recommendation to buy or sell securities or other investments, nor is it intended to constitute legal, tax, accounting, or financial advice. We therefore strongly advise
potential investors to seek independent professional advice before making any investment decision. Although the information in this report has been obtained from sources that QNBFS
believes to be reliable, we have not independently verified such information and it may not be accurate or complete. While this publication has been prepared with the utmost degree of care
by our analysts, QNBFS does not make any representations warranties as to the accuracy and completeness of the information it may contain, and declines any liability in that respect.
QNBFS reserves the right to amend the views and opinions expressed in this publication at any time. It may also express viewpoints or make investment decisions that differ significantly from,
or even contradict, the views and opinions included in this report.
COPYRIGHT: No part of this document may be reproduced without the explicit written permission of QNBFS.
Page 4 of 4
(In QR mn) 2010 2011 1Q-12 2Q-12 3Q-12 2012 1Q-13 2Q-13 Change MoM Change YTD
Total Assets 567,482 694,301 700,546 742,817 789,456 820,512 848,293 878,862 0.4% 7.1%
Total Credit (Loans) 314,481 403,563 412,247 460,946 482,719 510,048 517,690 543,834 1.0% 6.6%
Total Deposits 306,788 363,612 348,356 378,254 430,938 458,066 486,662 534,802 4.8% 16.8%
Loan to Deposit Ratio 103% 111% 118% 122% 112% 111% 106% 102% N/A N/A
Credit Facilities (Geographic)
Total Domestic Credit 293,920 376,695 384,622 432,472 452,086 478,305 479,776 499,441 -0.2% 4.4%
Total International Credit 20,561 26,867 27,625 28,475 30,634 31,743 37,914 44,394 16.8% 39.9%
Domestic Credit Facilities - Public Sector
Government 36,303 40,801 32,235 31,967 42,258 51,746 49,964 50,559 -9.5% -2.3%
Government Institutions 50,452 90,619 105,268 136,992 140,125 139,585 137,306 151,387 -0.2% 8.5%
Semi-Government Institutions 16,303 17,750 15,100 23,199 23,558 27,222 20,004 24,323 -1.0% -10.6%
Total Domestic Public Sector Credit 103,058 149,170 152,603 192,158 205,941 218,553 207,274 226,269 -2.5% 3.5%
Domestic Credit Facilities - Private Sector
General Trade 24,875 26,855 27,590 29,610 33,149 33,280 33,337 33,515 -3.0% 0.7%
Industry 6,648 6,534 5,755 6,883 8,070 9,339 9,703 10,166 0.8% 8.9%
Contractors 18,411 16,220 16,532 15,195 16,249 16,546 17,434 18,493 2.8% 11.8%
Real Estate 51,042 76,220 80,113 81,976 81,624 85,562 86,245 78,955 -0.3% -7.7%
Consumption & Others 60,345 71,986 76,386 79,210 75,881 78,587 87,127 81,632 1.3% 3.9%
Services 29,541 29,709 25,643 27,439 31,171 36,438 38,657 50,411 10.4% 38.3%
Total Domestic Private Sector Credit 190,862 227,525 232,019 240,314 246,144 259,752 272,502 273,172 1.9% 5.2%
Deposit Details (Geographic)
Resident Deposits 277,107 343,777 327,183 351,575 400,441 417,337 444,944 494,432 5.4% 18.5%
Non-resident Deposits 29,681 19,835 21,174 26,679 30,497 40,729 41,718 40,370 -3.0% -0.9%
Deposits - Public Sector (Domestic)
Government 18,486 40,825 31,352 26,354 33,842 44,557 36,666 41,704 7.9% -6.4%
Government Institutions 32,277 57,351 46,679 54,822 96,268 104,378 121,899 141,533 14.0% 35.6%
Semi Government Institutions 21,309 27,700 23,039 26,679 29,277 31,794 26,123 36,247 13.6% 14.0%
Total Public Sector Deposit 72,071 125,876 101,070 107,855 159,387 180,729 184,688 219,484 12.7% 21.4%
Deposits - Private Sector (Domestic)
Personal 90,828 103,093 111,843 117,147 117,470 116,257 126,938 133,674 -0.7% 15.0%
Companies & Institutions 114,207 114,809 114,270 126,574 123,584 120,350 133,317 141,274 1.2% 17.4%
Total Private Sector Deposit 205,036 217,902 226,113 243,721 241,054 236,607 260,255 274,948 0.3% 16.2%
Source: QCB