SlideShare a Scribd company logo
1 of 3
Download to read offline
Georgia | Banks | Company Update

RESEARCH ALERT
RESEARCH ALERT
RESEARCH ALERT
RESEARCH
RESEARCH ALERT
RESEARCH ALERT
RESEARCH ALERT

7 August 2013
GEL/US$ 1.6670

Liberty Bank Q2 2013 and 1H 2013 Results
GSE: BANK | BLOOMBERG: BANK GG | ISIN: GE1100000300

Not Rated

Liberty Bank (GSE: BANK, not rated) announced its Q2 2013 and 1H 2013
consolidated financial results, reporting Net Income of GEL 1.3 mln in Q2 2013
(up 624.5% q-o-q) and Net Income of GEL 1.5 mln in 1H 2013 (up 0.3% y-o-y).

Market Data
Current Price (GEL)
52 Week High (12/10/2012)
52 Week Low (09/01/2013)
1M Change
3M Change
12M Change
Shares Outstanding (bn)
MCap (GEL mln)
MCap (US$ mln)
Free Float (Including ESOP)
Free Float (US$ mln)
% Of Free Float Traded in 2010
% Of Free Float Traded in 2011
% Of Free Float Traded in 2012
Average Weekly Traded Volume in 2010-2012 (GEL '000)
% Of Free Float Traded YTD
Average Weekly Traded Volume YTD (GEL '000)
Major Shareholder - Liberty Holding Georgia Ltd**
Common Shares/GDR
GDRs Fully Fungible?
Current GDR Programme Ceiling (% Of Shares Outstanding)
% Of Shares Outstanding Currently Converted Into GDRs
Dividend Yield

0.0099
0.0170
0.0055
-1.0%
11.2%
-38.1%
5.5
54.5
32.7
19.6%
6.4
46.9%*
59.5%*
0.95%*
136.2
1.99%*
46.0
72.4%
500:1
Yes
30%
11.7%
0%

* By parties other than JSC Liberty Capital and Liberty Holding Georgia
**Formerly Liberty Capital LLC; renamed to Liberty Holding Georgia in July 2012

150.00
130.00
110.00
90.00
70.00
50.00

BANK’s BIS (Basel I) CAR stood at 17.4% as of 30 June 2013 as compared to BIS
CAR of 18.3% as at YE 2012.

30.00
Nov-10
Dec-10
Dec-10
Jan-11
Mar-11
Mar-11
Apr-11
May-11
Jun-11
Jul-11
Aug-11
Sep-11
Oct-11
Nov-11
Dec-11
Jan-12
Feb-12
Mar-12
Apr-12
May-12
Jun-12
Jul-12
Aug-12
Sep-12
Oct-12
Nov-12
Dec-12
Jan-13
Feb-13
Mar-13
Apr-13
May-13
Jun-13
Jul-13
Aug-13

10.00

BANK Closing Price (Rebased)
GSE Index (Rebased)
MSCI Emerging Markets Banks Index (Rebased)

Source: GSE, Bloomberg

Key Financials & Ratios

GEL mln, unless otherwise noted
Consolidated, IFRS-based

RESEARCH ALERT

Recurring Operating Costs increased in Q2 2013 by 0.6% q-o-q and 3.7% y-o-y
to GEL 17.0 mln. BANK’s Normalised Cost/Income Ratio decreased to 79.6% in
Q2 2013 as compared to 97.1% in Q1 2013 and increased from 66.9% in Q2
2012. BANK reported quarterly Normalised Net Operating Income of GEL 4.4
mln in Q2 2013, up 754.3% q-o-q and down 16.7% y-o-y on the like-for-like
basis (normalised for the discontinued state fees). Recurring Operating Costs
increased by 7.1% y-o-y to GEL 33.9 million in 1H 2013. Normalised
Cost/Income Ratio increased to 87.5% in 1H 2013 as compared to 68.9 % in 1H
2012. BANK reported Normalised Net Operating Income of GEL 4.9 million in
1H 2013, down 44.1% y-o-y on the like-for-like basis (normalised for the
discontinued state fees).
BANK is the third largest bank in Georgia (by Total Assets), with the
consolidated Total Assets reaching GEL 1,136.6 mln, up 18.7% q-o-q and 35.9%
y-o-y. BANK continued to gain market share, reaching 7.7% market share by
Total Assets as of 30 June 2013 (up from 6.3% as of 31 December 2012).
Market share in Net Loans and Client Balances & Deposits reached 5.4% and
11.7% as of 30 June 2013, respectively (up from 4.7% and 9.0% as of 31
December 2012, respectively).

Share Price Performance

Total Assets
Net Loans
Total Liabilities
Client Balances & Deposits
Shareholders’ Equity
Revenue
Net Income/(Loss)
EPS Basic
EPS Fully Diluted
ROAA
ROAE
CAR (NBG)
RWA/TA (NBG)

Unaudited d Unaudited d Unaudited d

Q2 2013
1,137
448
1,033
997
103
21.4
1.3
0.0002
0.0002
0.49%*
5.12%*
12.07%
60.78%

Q1 2013
958
393
856
825
102
17.4
0.2
0.00003
0.00003
0.08%*
0.72%*
12.78%
63.22%

Q2 2012
837
386
762
679
74
25.2
(1.4)
NMF
NMF
-0.67%*
-7.28%*
9.05%
75.81%

Growth
q-o-q
18.7%
14.0%
20.7%
20.7%
1.3%
22.7%
624.5%

Growth
y-o-y
35.9%
16.1%
35.5%
46.7%
39.3%
-15.3%
NMF

* Annualised

ALERT
RESEARCH ALERT

Total Operating Income in Q2 2013 reached GEL 21.4 mln, up 22.7% q-o-q and
up 1.8% y-o-y on a like-for-like basis (i.e. normalised for the GEL 4.2 mln
quarterly fees received from the state that were discontinued after Q2 2012).
Total Operating Income in 1H 2013 reached GEL 38.8 million, down 18.5% y-oy. Total Operating Income normalised for the loss of state fees decreased only
by 0.8% y-o-y in 1H 2013, reflecting the high negative carry in the first few
months of 2013.

Valuation Metrics
P/E
P/B
BV Per Share

* Excluding Treasury Shares

2012A
7.96
0.42
0.018*

2013F
3.93
0.49
0.020*

Capital Adequacy Ratio (as per the NBG methodology) reached 12.1% as at 30
June 2013. BANK was compliant, as of 30 June 2013, with the prudential
capital adequacy ratios.
BANK’s Net Loans/Total Assets decreased to 39.4% as at Q2 2013 as compared
to 44.6% as at YE 2012, reflecting the surge in Client Balances & Deposits in 1H
2013 However, looking ahead, we expect BANK to remain focused on the
further improvement of its balance sheet structure. We believe BANK could
reach Net Loans/Total Assets of 52% by YE 2013, with the annual balance
sheet growth reaching or exceeding 31%.
We forecast the overall Cost of Risk to reach 0.2% in 2013, due to the
expected recoveries on large legacy loans to be made in 2H 2013.
We forecast 2013 Net Income to reach GEL 14.0 mln, implying that ROAE and
ROAA will reach 12.8% and 1.4%, respectively.
Liberty Bank Q2 2013 and 1H 2013 Results
GSE: BANK | BLOOMBERG: BANK.GG | ISIN: GE1100000300

RESEARCH ALERT

RESEARCH ALERT

RESEARCH ALERT

RESEARCH ALERT

RESEARCH ALERT

Income Statement
Consolidated, IFRS-based
GEL '000, unless otherwise noted
Interest Income
Interest Expense
Net Interest Income
Fee And Commission Income
Fee And Commission Expenses
Net Fee And Commission Income
Net Income From Documentary Operations
Net Other Non-Interest Income
Net Income From FX And Translation Operations
Net Non-Interest Income
Total Operating Income
Recurring Operating Costs
Normalised Net Operating Income
Non-Recurring Costs/(Income)
Profit (Pre-Bonus) Before Provisions
Net Provisions
Pre-Bonus Result
Discretionary Bonus Pool
Share Of Associates' Net Profit
Pre-Tax Profit
Accrued Or Paid Income Tax Benefit/(Expense)
Impairment Of Deferred Tax Asset
Net Income

Balance Sheet
Consolidated, IFRS-based
GEL '000, unless otherwise noted
Cash And Due From Banks
Treasuries
Other Fixed Income Instruments
Net Loans
Net Investments
Investment Property
Net Property, Plant And Equipment
Net Other Assets
Total Assets
Total Balances & Deposits
Borrowed Funds
Other Liabilities
Contingent Capital Participation Note
Total Liabilities
Shareholders' Equity
Total Liabilities And Shareholders' Equity

Selected Ratios
Consolidated, IFRS-based
%, unless otherwise noted
ROAA
ROAE
Net Interest Margin
Net Spread
Net Non-Interest Income/Total Operating Income
Net Income/Total Operating Income
Net Fee & Commission Income/Total Operating Income
Net Fee & Commission Income/Average Total Assets
Cost/Income Ratio (Normalised)
Costs/Average Total Assets (Normalised)
Personnel Costs/Total Operating Income
Personnel Costs/Average Total Assets
Personnel Costs/Total Recurring Operating Costs
Net Loans/Total Assets
Total Balances & Deposits/Total Liabilities
Net Loans/Total Balances & Deposits
Net Loans/Total Liabilities
Liquid Assets/Total Assets
Leverage (Total Liabilities/Equity), Times
Shareholders' Equity/Total Assets
Average Shareholders' Equity/Average Total Assets
Loan Loss Reserves/Gross Loans
NPLs/Gross Loans
LLR Coverage Ratio
Cost of Risk (Standalone)

Unaudited
Q2 2013
37,427
23,768
13,659
6,522
718
5,804
116
315
1,486
7,721
21,380
17,023
4,357
114
4,242
2,761
1,543
6
1,549
(235)
1,314

Unaudited
Q1 2013
32,830
21,767
11,063
5,270
674
4,596
111
267
1,394
6,367
17,430
16,920
510
31
479
304
206
12
218
(36)
181

Unaudited
Q2 2012
32,006
17,980
14,026
10,146
727
9,419
284
232
1,287
11,222
25,248
16,417
8,831
(51)
8,882
5,806
3,152
476
(43)
2,633
(4,019)
(1,386)

Unaudited
Q2 2013
412,809
104,172
447,780
244
4,793
125,240
23,404
1,136,604
997,896
20,132
1,033,123
103,481
1,136,604

Q2 2013
0.49%
5.12%
8.09%
10.70%
36.11%
6.15%
27.15%
2.18%
79.62%
6.38%
42.18%
3.38%
52.97%
39.40%
96.59%
44.87%
43.34%
45.48%
9.98
9.10%
9.62%
3.94%
6.67%
74.81%
2.06%

Q1 2013
0.08%
0.72%
7.63%
10.69%
36.53%
1.04%
26.37%
2.01%
97.07%
7.39%
51.42%
3.91%
52.97%
41.01%
96.62%
47.51%
45.91%
41.59%
8.38
10.67%
11.01%
4.04%
6.72%
75.54%
0.26%

Unaudited
Q1 2013
324,758
73,572
392,828
196
4,793
124,710
20,586
957,825
826,769
17,510
855,662
102,163
957,825

Q2 2012
-0.67%
-7.28%
9.53%
9.44%
44.45%
-5.49%
37.31%
4.58%
66.91%
8.21%
36.07%
4.42%
55.47%
46.12%
90.60%
55.86%
50.61%
33.28%
10.27
8.88%
9.25%
7.95%
10.92%
93.69%
5.17%

Growth q-o-q
14.0%
9.2%
23.5%
23.8%
6.5%
26.3%
4.8%
18.0%
6.6%
21.3%
22.7%
0.6%
754.3%
266.9%
786.0%
807.8%
650.5%
0.0%
-52.9%
611.6%
547.3%
0.0%
624.5%

Audited
2012
235,533
57,497
374,003
173
4,793
126,095
24,820
838,932
691,177
26,667
15,491
740,270
98,661
838,932

1H 2013
0.30%
2.94%
7.9%
10.69%
36.30%
3.85%
26.80%
2.10%
87.46%
6.85%
46.33%
3.63%
52.97%
39.40%
96.59%
44.87%
43.34%
45.48%
9.98
9.10%
10.26%
3.94%
6.67%
74.81%
1.22%

Growth y-o-y
16.9%
32.2%
-2.6%
-35.7%
-1.3%
-38.4%
-59.1%
35.6%
15.5%
-31.2%
-15.3%
3.7%
-50.7%
NMF
-52.2%
-52.4%
-51.0%
-100.0%
NMF
-41.2%
NMF
NMF
NMF

Unaudited
1H 2013
70,257
45,535
24,722
11,792
1,393
10,400
226
582
2,880
14,088
38,810
33,943
4,867
146
4,721
3,065
1,749
18
1,767
(271)
1,496

Unaudited
1H 2012
61,172
35,248
25,924
19,550
1,351
18,199
560
454
2,473
21,687
47,611
31,704
15,907
(176)
16,082
9,085
7,146
1,082
(39)
6,026
(4,534)
1,492

Unaudited
Q2 2012
160,527
117,911
385,823
347
25,021
98,940
33,936
836,642
690,717
20,096
24,162
18,615
762,375
74,267
836,642

Growth q-o-q
27.1%
41.6%
NMF
14.0%
24.5%
0.0%
0.4%
13.7%
18.7%
20.7%
NMF
15.0%
NMF
20.7%
1.3%
18.7%

Growth YTD
75.3%
81.2%
NMF
19.7%
41.1%
0.0%
-0.7%
-5.7%
35.5%
44.4%
-100.0%
30.0%
NMF
39.6%
4.9%
35.5%

1H2012
0.36%
3.96%
8.7%
8.47%
45.55%
3.13%
38.22%
4.45%
68.86%
8.01%
37.82%
4.40%
56.80%
46.12%
90.60%
55.86%
50.61%
33.28%
10.27
8.88%
9.21%
7.95%
10.92%
93.69%
4.31%

2012
0.62%
6.44%
9.03%
8.88%
40.60%
5.64%
31.77%
3.48%
75.37%
8.25%
40.85%
4.47%
56.14%
44.58%
93.37%
54.11%
50.52%
34.93%
7.50
11.76%
9.59%
4.33%
5.27%
98.99%
3.03%

2011
1.06%
13.29%
9.44%
9.78%
50.95%
9.15%
42.80%
4.96%
70.78%
8.21%
37.11%
4.30%
54.10%
43.74%
93.86%
51.73%
48.56%
35.35%
9.08
9.36%
7.99%
7.80%
11.66%
86.30%
6.21%

2010
1.11%
21.58%
11.89%
18.08%
62.43%
7.39%
51.29%
7.64%
73.16%
10.90%
40.12%
5.97%
54.83%
29.49%
80.52%
39.19%
31.54%
42.00%
15.25
6.15%
7.04%
11.02%
18.55%
59.84%
7.01%

Growth y-o-y
14.9%
29.2%
-4.6%
-39.7%
3.1%
-42.9%
-59.6%
28.1%
16.4%
-35.0%
-18.5%
7.1%
-69.4%
NMF
-70.6%
-66.3%
-75.5%
-100.0%
NMF
-70.7%
NMF
-100.0%
0.3%

Growth y-o-y
157.2%
-11.7%
NMF
16.1%
-29.7%
-80.8%
26.6%
-31.0%
35.9%
44.5%
-100.0%
-16.7%
-100.0%
35.5%
39.3%
35.9%

2009
-1.70%
-45.86%
3.16%
8.15%
89.85%
-13.21%
71.49%
9.21%
103.44%
13.33%
48.99%
6.31%
47.36%
25.14%
81.38%
31.81%
25.88%
35.06%
33.80
2.87%
3.71%
20.34%
35.46%
60.35%
14.01%

Quarterly ratios are annualised, where applicable

2
Liberty Bank Q2 2013 and 1H 2013 Results
GSE: BANK | BLOOMBERG: BANK.GG | ISIN: GE1100000300
Liberty Securities
Liberty Tower
74 I. Chavchavadze Ave
Tbilisi, Georgia 0162
Tel: + 995 32 2555 500
research@libertysecurities.ge
www.libertysecurities.ge
Skype: liberty.securities

Temur Iremashvili
Director
Liberty Securities
+995 591 158 877
temur.iremashvili@libertysecurities.ge
Skype: Temur Iremashvili

Victor Meskhi
Director of Research
Liberty Securities
+995 593 551 506
victor.meskhi@libertysecurities.ge
Skype: v.meskhi

Liberty Capital & Liberty Bank
Tengiz Lashkhi
Asset Management Director
Liberty Securities
+995 591 709 280
tengiz.lashkhi@libertysecurities.ge

This document has been produced by Liberty Securities Ltd (“Liberty Securities”). Liberty Securities is a full-service broker-dealer wholly-owned by JSC Liberty Bank and licensed and regulated by the
National Bank of Georgia. Liberty Bank is a significant client of Liberty Securities. Liberty Securities and/or persons connected with it may effect or may have effected a transaction or transactions for
their own account in the Securities referred to in this document or any related investment before the material is published to Liberty Securities’ clients. Persons connected with Liberty Securities
may provide or have provided corporate finance and other services to the issuer(s) of the Securities and may seek to do so in the future. Accordingly, information may be available to Liberty
Securities and/or persons connected with it which is not reflected in this document. Liberty Securities, persons connected with it and their respective principals, directors, employees and/or
representatives may have a position in the Securities and/or any related investment and may make a purchase and/or sale, or offer to make a purchase and/or sale, of the Securities and/or any
related investment from time to time, in the open market or otherwise, in each case either as principal or as agent. This document is not, and should not be construed as an offer to sell or
solicitation of an offer to buy any securities. The information and opinions contained in this document have been compiled or arrived at by Liberty Securities from sources believed to be reliable and
in good faith, but no representation or warranty, express or implied, is made as to their accuracy, completeness or correctness. All opinions and estimates contained in this document constitute
Liberty Securities’ judgement as of the date hereof and are subject to change without notice. The information contained in this document is published for the assistance of the intended recipients,
but is not to be relied upon as authoritative or taken in the substitution of the exercise of judgement by any recipient. Liberty Securities accepts no liability whatsoever for any direct or
consequential loss arising from any use of this document or its contents. This document may not be reproduced, distributed or published for any purpose. It is not intended for and must not be
distributed to private customers. Further information may be obtained and for this purpose the intended recipients hereof should contact Liberty Securities at the address given above. This
document is not to be distributed in the United States and the United Kingdom, and in any other jurisdiction where such distribution is unlawful.

More Related Content

What's hot

Bank of Baroda reports NII of Rs3328.3 cr, up 15.2% y-o-y in Q1FY15 - HDFC Sec
Bank of Baroda reports NII of Rs3328.3 cr, up 15.2% y-o-y in Q1FY15 - HDFC SecBank of Baroda reports NII of Rs3328.3 cr, up 15.2% y-o-y in Q1FY15 - HDFC Sec
Bank of Baroda reports NII of Rs3328.3 cr, up 15.2% y-o-y in Q1FY15 - HDFC SecIndiaNotes.com
 
June 2011 results
June 2011 results June 2011 results
June 2011 results wgjlubbe
 
Sib ru2 qfy2011-221010
Sib ru2 qfy2011-221010Sib ru2 qfy2011-221010
Sib ru2 qfy2011-221010Angel Broking
 
캐피탈 2016년 3분기 ir 자료 en
캐피탈 2016년 3분기 ir 자료 en캐피탈 2016년 3분기 ir 자료 en
캐피탈 2016년 3분기 ir 자료 enHyundai Finance
 
Q1 2013 investor presentation
Q1 2013 investor presentationQ1 2013 investor presentation
Q1 2013 investor presentationnexon-ir
 
June 2012 results
June 2012 results June 2012 results
June 2012 results wgjlubbe
 
Icici bank ru2 qfy2011-291010
Icici bank ru2 qfy2011-291010Icici bank ru2 qfy2011-291010
Icici bank ru2 qfy2011-291010Angel Broking
 
Corporation bank ru2 qfy2011-221010
Corporation bank ru2 qfy2011-221010Corporation bank ru2 qfy2011-221010
Corporation bank ru2 qfy2011-221010Angel Broking
 
24.09.2013 Mongolian Economy: Investment Opportunity/ Challenges, Jim Dwyer
 24.09.2013 Mongolian Economy: Investment Opportunity/ Challenges, Jim Dwyer 24.09.2013 Mongolian Economy: Investment Opportunity/ Challenges, Jim Dwyer
24.09.2013 Mongolian Economy: Investment Opportunity/ Challenges, Jim DwyerThe Business Council of Mongolia
 
2016년 1분기 검토보고서 en
2016년 1분기 검토보고서  en2016년 1분기 검토보고서  en
2016년 1분기 검토보고서 enHyundai Finance
 
현대카드 Ir 자료 (2016 2 q) en
현대카드 Ir 자료 (2016 2 q) en현대카드 Ir 자료 (2016 2 q) en
현대카드 Ir 자료 (2016 2 q) enHyundai Finance
 
Sun pharmaceutical industries ltd.
Sun pharmaceutical industries ltd.Sun pharmaceutical industries ltd.
Sun pharmaceutical industries ltd.AbhishekSoni260
 
Ccall 3 q11_ing
Ccall 3 q11_ingCcall 3 q11_ing
Ccall 3 q11_ingItauRI
 
Weekly review 30-10-10
Weekly review  30-10-10Weekly review  30-10-10
Weekly review 30-10-10Angel Broking
 
Conference Call 2Q15
Conference Call 2Q15Conference Call 2Q15
Conference Call 2Q15ItauRI
 
Stock Recommendation: Buy Punjab National Bank on dips for a target of Rs185
Stock Recommendation: Buy Punjab National Bank on dips for a target of Rs185Stock Recommendation: Buy Punjab National Bank on dips for a target of Rs185
Stock Recommendation: Buy Punjab National Bank on dips for a target of Rs185IndiaNotes.com
 

What's hot (20)

Bank of Baroda reports NII of Rs3328.3 cr, up 15.2% y-o-y in Q1FY15 - HDFC Sec
Bank of Baroda reports NII of Rs3328.3 cr, up 15.2% y-o-y in Q1FY15 - HDFC SecBank of Baroda reports NII of Rs3328.3 cr, up 15.2% y-o-y in Q1FY15 - HDFC Sec
Bank of Baroda reports NII of Rs3328.3 cr, up 15.2% y-o-y in Q1FY15 - HDFC Sec
 
영문
영문영문
영문
 
June 2011 results
June 2011 results June 2011 results
June 2011 results
 
Sib ru2 qfy2011-221010
Sib ru2 qfy2011-221010Sib ru2 qfy2011-221010
Sib ru2 qfy2011-221010
 
캐피탈 2016년 3분기 ir 자료 en
캐피탈 2016년 3분기 ir 자료 en캐피탈 2016년 3분기 ir 자료 en
캐피탈 2016년 3분기 ir 자료 en
 
Ir material 1 q2016 en
Ir material 1 q2016 enIr material 1 q2016 en
Ir material 1 q2016 en
 
Q1 2013 investor presentation
Q1 2013 investor presentationQ1 2013 investor presentation
Q1 2013 investor presentation
 
June 2012 results
June 2012 results June 2012 results
June 2012 results
 
Icici bank ru2 qfy2011-291010
Icici bank ru2 qfy2011-291010Icici bank ru2 qfy2011-291010
Icici bank ru2 qfy2011-291010
 
Corporation bank ru2 qfy2011-221010
Corporation bank ru2 qfy2011-221010Corporation bank ru2 qfy2011-221010
Corporation bank ru2 qfy2011-221010
 
24.09.2013 Mongolian Economy: Investment Opportunity/ Challenges, Jim Dwyer
 24.09.2013 Mongolian Economy: Investment Opportunity/ Challenges, Jim Dwyer 24.09.2013 Mongolian Economy: Investment Opportunity/ Challenges, Jim Dwyer
24.09.2013 Mongolian Economy: Investment Opportunity/ Challenges, Jim Dwyer
 
2016년 1분기 검토보고서 en
2016년 1분기 검토보고서  en2016년 1분기 검토보고서  en
2016년 1분기 검토보고서 en
 
현대카드 Ir 자료 (2016 2 q) en
현대카드 Ir 자료 (2016 2 q) en현대카드 Ir 자료 (2016 2 q) en
현대카드 Ir 자료 (2016 2 q) en
 
Sun pharmaceutical industries ltd.
Sun pharmaceutical industries ltd.Sun pharmaceutical industries ltd.
Sun pharmaceutical industries ltd.
 
Ccall 3 q11_ing
Ccall 3 q11_ingCcall 3 q11_ing
Ccall 3 q11_ing
 
Banking Sector
Banking SectorBanking Sector
Banking Sector
 
Weekly review 30-10-10
Weekly review  30-10-10Weekly review  30-10-10
Weekly review 30-10-10
 
현대카드 영문
현대카드 영문현대카드 영문
현대카드 영문
 
Conference Call 2Q15
Conference Call 2Q15Conference Call 2Q15
Conference Call 2Q15
 
Stock Recommendation: Buy Punjab National Bank on dips for a target of Rs185
Stock Recommendation: Buy Punjab National Bank on dips for a target of Rs185Stock Recommendation: Buy Punjab National Bank on dips for a target of Rs185
Stock Recommendation: Buy Punjab National Bank on dips for a target of Rs185
 

Viewers also liked

Como mejorar el rendimiento de una pc
Como mejorar el rendimiento de una pcComo mejorar el rendimiento de una pc
Como mejorar el rendimiento de una pcMeiil Hernandez
 
المحاضرة الأولى مقدمة في التعلم عن بعد
المحاضرة الأولى مقدمة في التعلم عن بعدالمحاضرة الأولى مقدمة في التعلم عن بعد
المحاضرة الأولى مقدمة في التعلم عن بعدTameem Odat
 
Nuestra escuela caracterización temporal
Nuestra escuela caracterización temporalNuestra escuela caracterización temporal
Nuestra escuela caracterización temporalescuela25victoria
 
Wt d130pg
Wt d130pgWt d130pg
Wt d130pgsgccjis
 
Learning theories
Learning theoriesLearning theories
Learning theoriesnikoo_p
 

Viewers also liked (7)

Como mejorar el rendimiento de una pc
Como mejorar el rendimiento de una pcComo mejorar el rendimiento de una pc
Como mejorar el rendimiento de una pc
 
المحاضرة الأولى مقدمة في التعلم عن بعد
المحاضرة الأولى مقدمة في التعلم عن بعدالمحاضرة الأولى مقدمة في التعلم عن بعد
المحاضرة الأولى مقدمة في التعلم عن بعد
 
Kotozok!
Kotozok!Kotozok!
Kotozok!
 
Nuestra escuela caracterización temporal
Nuestra escuela caracterización temporalNuestra escuela caracterización temporal
Nuestra escuela caracterización temporal
 
Wt d130pg
Wt d130pgWt d130pg
Wt d130pg
 
virtual tour services
virtual tour servicesvirtual tour services
virtual tour services
 
Learning theories
Learning theoriesLearning theories
Learning theories
 

Similar to Liberty Bank Research Note - Q2 2013 and 1H 2013 Results

Liberty Bank Research Note - Q3 2013 and 9M 2013 Results
Liberty Bank Research Note - Q3 2013 and 9M 2013 ResultsLiberty Bank Research Note - Q3 2013 and 9M 2013 Results
Liberty Bank Research Note - Q3 2013 and 9M 2013 ResultsLiberty Securities
 
Liberty bank unaudited ifrs based q4 2013 and 2013 results
Liberty bank unaudited ifrs based q4 2013 and 2013 resultsLiberty bank unaudited ifrs based q4 2013 and 2013 results
Liberty bank unaudited ifrs based q4 2013 and 2013 resultsLibertyBank
 
Liberty Bank Research Note - Q2 2014 and 1H 2014 Results
Liberty Bank Research Note - Q2 2014 and 1H 2014 ResultsLiberty Bank Research Note - Q2 2014 and 1H 2014 Results
Liberty Bank Research Note - Q2 2014 and 1H 2014 ResultsLiberty Securities
 
Ccal 2 q13_ing
Ccal 2 q13_ingCcal 2 q13_ing
Ccal 2 q13_ingItauRI
 
Ccal 2 q12_ing
Ccal 2 q12_ingCcal 2 q12_ing
Ccal 2 q12_ingItauRI
 
WuXi Pharma Tech First Quarter 2013 Earnings Presentation
WuXi Pharma Tech First Quarter 2013 Earnings PresentationWuXi Pharma Tech First Quarter 2013 Earnings Presentation
WuXi Pharma Tech First Quarter 2013 Earnings PresentationCompany Spotlight
 
2 q13 conference call presentation
2 q13 conference call presentation2 q13 conference call presentation
2 q13 conference call presentationBancoABCRI
 
Luxottica FY13 Analyst & Investor presentation
Luxottica FY13 Analyst & Investor presentationLuxottica FY13 Analyst & Investor presentation
Luxottica FY13 Analyst & Investor presentationLuxottica Group
 
Ccal 1 q13_ing
Ccal 1 q13_ingCcal 1 q13_ing
Ccal 1 q13_ingItauRI
 
Results presentation 3 q13
Results presentation 3 q13Results presentation 3 q13
Results presentation 3 q13Providência
 
Liberty Bank Research Note - Q1 2014 Results
Liberty Bank Research Note - Q1 2014 ResultsLiberty Bank Research Note - Q1 2014 Results
Liberty Bank Research Note - Q1 2014 ResultsLiberty Securities
 
Gunnebo Interim Report January-June 2013
Gunnebo Interim Report January-June 2013Gunnebo Interim Report January-June 2013
Gunnebo Interim Report January-June 2013Gunnebo Group
 
Wolters Kluwer 2013 Half-Year Results Presentation
Wolters Kluwer 2013 Half-Year Results PresentationWolters Kluwer 2013 Half-Year Results Presentation
Wolters Kluwer 2013 Half-Year Results PresentationWolters Kluwer
 
Ccall 1 q12_ing
Ccall 1 q12_ingCcall 1 q12_ing
Ccall 1 q12_ingItauRI
 
BRCD Q4 2013 PR.pdf
BRCD Q4 2013 PR.pdfBRCD Q4 2013 PR.pdf
BRCD Q4 2013 PR.pdfKanuBabu1
 
Zep 4Q 2013 Earnings Call
Zep 4Q 2013 Earnings CallZep 4Q 2013 Earnings Call
Zep 4Q 2013 Earnings CallZep Inc.
 
2013 Annual Results
2013 Annual Results2013 Annual Results
2013 Annual ResultsBanca Ifis
 
WuXi Second Quarter 2013 Earnings Presentation
WuXi Second Quarter 2013 Earnings PresentationWuXi Second Quarter 2013 Earnings Presentation
WuXi Second Quarter 2013 Earnings PresentationCompany Spotlight
 
AMD Second Quarter 2013 Earnings Results Summary
AMD Second Quarter 2013 Earnings Results SummaryAMD Second Quarter 2013 Earnings Results Summary
AMD Second Quarter 2013 Earnings Results SummaryAMD
 

Similar to Liberty Bank Research Note - Q2 2013 and 1H 2013 Results (20)

Liberty Bank Research Note - Q3 2013 and 9M 2013 Results
Liberty Bank Research Note - Q3 2013 and 9M 2013 ResultsLiberty Bank Research Note - Q3 2013 and 9M 2013 Results
Liberty Bank Research Note - Q3 2013 and 9M 2013 Results
 
Liberty bank unaudited ifrs based q4 2013 and 2013 results
Liberty bank unaudited ifrs based q4 2013 and 2013 resultsLiberty bank unaudited ifrs based q4 2013 and 2013 results
Liberty bank unaudited ifrs based q4 2013 and 2013 results
 
Liberty Bank Research Note - Q2 2014 and 1H 2014 Results
Liberty Bank Research Note - Q2 2014 and 1H 2014 ResultsLiberty Bank Research Note - Q2 2014 and 1H 2014 Results
Liberty Bank Research Note - Q2 2014 and 1H 2014 Results
 
2Q13 Earnings Presentation
2Q13 Earnings Presentation2Q13 Earnings Presentation
2Q13 Earnings Presentation
 
Ccal 2 q13_ing
Ccal 2 q13_ingCcal 2 q13_ing
Ccal 2 q13_ing
 
Ccal 2 q12_ing
Ccal 2 q12_ingCcal 2 q12_ing
Ccal 2 q12_ing
 
WuXi Pharma Tech First Quarter 2013 Earnings Presentation
WuXi Pharma Tech First Quarter 2013 Earnings PresentationWuXi Pharma Tech First Quarter 2013 Earnings Presentation
WuXi Pharma Tech First Quarter 2013 Earnings Presentation
 
2 q13 conference call presentation
2 q13 conference call presentation2 q13 conference call presentation
2 q13 conference call presentation
 
Luxottica FY13 Analyst & Investor presentation
Luxottica FY13 Analyst & Investor presentationLuxottica FY13 Analyst & Investor presentation
Luxottica FY13 Analyst & Investor presentation
 
Ccal 1 q13_ing
Ccal 1 q13_ingCcal 1 q13_ing
Ccal 1 q13_ing
 
Results presentation 3 q13
Results presentation 3 q13Results presentation 3 q13
Results presentation 3 q13
 
Liberty Bank Research Note - Q1 2014 Results
Liberty Bank Research Note - Q1 2014 ResultsLiberty Bank Research Note - Q1 2014 Results
Liberty Bank Research Note - Q1 2014 Results
 
Gunnebo Interim Report January-June 2013
Gunnebo Interim Report January-June 2013Gunnebo Interim Report January-June 2013
Gunnebo Interim Report January-June 2013
 
Wolters Kluwer 2013 Half-Year Results Presentation
Wolters Kluwer 2013 Half-Year Results PresentationWolters Kluwer 2013 Half-Year Results Presentation
Wolters Kluwer 2013 Half-Year Results Presentation
 
Ccall 1 q12_ing
Ccall 1 q12_ingCcall 1 q12_ing
Ccall 1 q12_ing
 
BRCD Q4 2013 PR.pdf
BRCD Q4 2013 PR.pdfBRCD Q4 2013 PR.pdf
BRCD Q4 2013 PR.pdf
 
Zep 4Q 2013 Earnings Call
Zep 4Q 2013 Earnings CallZep 4Q 2013 Earnings Call
Zep 4Q 2013 Earnings Call
 
2013 Annual Results
2013 Annual Results2013 Annual Results
2013 Annual Results
 
WuXi Second Quarter 2013 Earnings Presentation
WuXi Second Quarter 2013 Earnings PresentationWuXi Second Quarter 2013 Earnings Presentation
WuXi Second Quarter 2013 Earnings Presentation
 
AMD Second Quarter 2013 Earnings Results Summary
AMD Second Quarter 2013 Earnings Results SummaryAMD Second Quarter 2013 Earnings Results Summary
AMD Second Quarter 2013 Earnings Results Summary
 

Recently uploaded

Authentic No 1 Amil Baba In Pakistan Authentic No 1 Amil Baba In Karachi No 1...
Authentic No 1 Amil Baba In Pakistan Authentic No 1 Amil Baba In Karachi No 1...Authentic No 1 Amil Baba In Pakistan Authentic No 1 Amil Baba In Karachi No 1...
Authentic No 1 Amil Baba In Pakistan Authentic No 1 Amil Baba In Karachi No 1...First NO1 World Amil baba in Faisalabad
 
Attachment Of Assets......................
Attachment Of Assets......................Attachment Of Assets......................
Attachment Of Assets......................AmanBajaj36
 
letter-from-the-chair-to-the-fca-relating-to-british-steel-pensions-scheme-15...
letter-from-the-chair-to-the-fca-relating-to-british-steel-pensions-scheme-15...letter-from-the-chair-to-the-fca-relating-to-british-steel-pensions-scheme-15...
letter-from-the-chair-to-the-fca-relating-to-british-steel-pensions-scheme-15...Henry Tapper
 
Classical Theory of Macroeconomics by Adam Smith
Classical Theory of Macroeconomics by Adam SmithClassical Theory of Macroeconomics by Adam Smith
Classical Theory of Macroeconomics by Adam SmithAdamYassin2
 
(办理原版一样)QUT毕业证昆士兰科技大学毕业证学位证留信学历认证成绩单补办
(办理原版一样)QUT毕业证昆士兰科技大学毕业证学位证留信学历认证成绩单补办(办理原版一样)QUT毕业证昆士兰科技大学毕业证学位证留信学历认证成绩单补办
(办理原版一样)QUT毕业证昆士兰科技大学毕业证学位证留信学历认证成绩单补办fqiuho152
 
AfRESFullPaper22018EmpiricalPerformanceofRealEstateInvestmentTrustsandShareho...
AfRESFullPaper22018EmpiricalPerformanceofRealEstateInvestmentTrustsandShareho...AfRESFullPaper22018EmpiricalPerformanceofRealEstateInvestmentTrustsandShareho...
AfRESFullPaper22018EmpiricalPerformanceofRealEstateInvestmentTrustsandShareho...yordanosyohannes2
 
The Triple Threat | Article on Global Resession | Harsh Kumar
The Triple Threat | Article on Global Resession | Harsh KumarThe Triple Threat | Article on Global Resession | Harsh Kumar
The Triple Threat | Article on Global Resession | Harsh KumarHarsh Kumar
 
20240417-Calibre-April-2024-Investor-Presentation.pdf
20240417-Calibre-April-2024-Investor-Presentation.pdf20240417-Calibre-April-2024-Investor-Presentation.pdf
20240417-Calibre-April-2024-Investor-Presentation.pdfAdnet Communications
 
Call Girls In Yusuf Sarai Women Seeking Men 9654467111
Call Girls In Yusuf Sarai Women Seeking Men 9654467111Call Girls In Yusuf Sarai Women Seeking Men 9654467111
Call Girls In Yusuf Sarai Women Seeking Men 9654467111Sapana Sha
 
Vip B Aizawl Call Girls #9907093804 Contact Number Escorts Service Aizawl
Vip B Aizawl Call Girls #9907093804 Contact Number Escorts Service AizawlVip B Aizawl Call Girls #9907093804 Contact Number Escorts Service Aizawl
Vip B Aizawl Call Girls #9907093804 Contact Number Escorts Service Aizawlmakika9823
 
Bladex Earnings Call Presentation 1Q2024
Bladex Earnings Call Presentation 1Q2024Bladex Earnings Call Presentation 1Q2024
Bladex Earnings Call Presentation 1Q2024Bladex
 
Instant Issue Debit Cards - High School Spirit
Instant Issue Debit Cards - High School SpiritInstant Issue Debit Cards - High School Spirit
Instant Issue Debit Cards - High School Spiritegoetzinger
 
(DIYA) Bhumkar Chowk Call Girls Just Call 7001035870 [ Cash on Delivery ] Pun...
(DIYA) Bhumkar Chowk Call Girls Just Call 7001035870 [ Cash on Delivery ] Pun...(DIYA) Bhumkar Chowk Call Girls Just Call 7001035870 [ Cash on Delivery ] Pun...
(DIYA) Bhumkar Chowk Call Girls Just Call 7001035870 [ Cash on Delivery ] Pun...ranjana rawat
 
Malad Call Girl in Services 9892124323 | ₹,4500 With Room Free Delivery
Malad Call Girl in Services  9892124323 | ₹,4500 With Room Free DeliveryMalad Call Girl in Services  9892124323 | ₹,4500 With Room Free Delivery
Malad Call Girl in Services 9892124323 | ₹,4500 With Room Free DeliveryPooja Nehwal
 
House of Commons ; CDC schemes overview document
House of Commons ; CDC schemes overview documentHouse of Commons ; CDC schemes overview document
House of Commons ; CDC schemes overview documentHenry Tapper
 
VIP Call Girls LB Nagar ( Hyderabad ) Phone 8250192130 | ₹5k To 25k With Room...
VIP Call Girls LB Nagar ( Hyderabad ) Phone 8250192130 | ₹5k To 25k With Room...VIP Call Girls LB Nagar ( Hyderabad ) Phone 8250192130 | ₹5k To 25k With Room...
VIP Call Girls LB Nagar ( Hyderabad ) Phone 8250192130 | ₹5k To 25k With Room...Suhani Kapoor
 
call girls in Nand Nagri (DELHI) 🔝 >༒9953330565🔝 genuine Escort Service 🔝✔️✔️
call girls in  Nand Nagri (DELHI) 🔝 >༒9953330565🔝 genuine Escort Service 🔝✔️✔️call girls in  Nand Nagri (DELHI) 🔝 >༒9953330565🔝 genuine Escort Service 🔝✔️✔️
call girls in Nand Nagri (DELHI) 🔝 >༒9953330565🔝 genuine Escort Service 🔝✔️✔️9953056974 Low Rate Call Girls In Saket, Delhi NCR
 

Recently uploaded (20)

Authentic No 1 Amil Baba In Pakistan Authentic No 1 Amil Baba In Karachi No 1...
Authentic No 1 Amil Baba In Pakistan Authentic No 1 Amil Baba In Karachi No 1...Authentic No 1 Amil Baba In Pakistan Authentic No 1 Amil Baba In Karachi No 1...
Authentic No 1 Amil Baba In Pakistan Authentic No 1 Amil Baba In Karachi No 1...
 
Monthly Economic Monitoring of Ukraine No 231, April 2024
Monthly Economic Monitoring of Ukraine No 231, April 2024Monthly Economic Monitoring of Ukraine No 231, April 2024
Monthly Economic Monitoring of Ukraine No 231, April 2024
 
Attachment Of Assets......................
Attachment Of Assets......................Attachment Of Assets......................
Attachment Of Assets......................
 
letter-from-the-chair-to-the-fca-relating-to-british-steel-pensions-scheme-15...
letter-from-the-chair-to-the-fca-relating-to-british-steel-pensions-scheme-15...letter-from-the-chair-to-the-fca-relating-to-british-steel-pensions-scheme-15...
letter-from-the-chair-to-the-fca-relating-to-british-steel-pensions-scheme-15...
 
Classical Theory of Macroeconomics by Adam Smith
Classical Theory of Macroeconomics by Adam SmithClassical Theory of Macroeconomics by Adam Smith
Classical Theory of Macroeconomics by Adam Smith
 
(办理原版一样)QUT毕业证昆士兰科技大学毕业证学位证留信学历认证成绩单补办
(办理原版一样)QUT毕业证昆士兰科技大学毕业证学位证留信学历认证成绩单补办(办理原版一样)QUT毕业证昆士兰科技大学毕业证学位证留信学历认证成绩单补办
(办理原版一样)QUT毕业证昆士兰科技大学毕业证学位证留信学历认证成绩单补办
 
AfRESFullPaper22018EmpiricalPerformanceofRealEstateInvestmentTrustsandShareho...
AfRESFullPaper22018EmpiricalPerformanceofRealEstateInvestmentTrustsandShareho...AfRESFullPaper22018EmpiricalPerformanceofRealEstateInvestmentTrustsandShareho...
AfRESFullPaper22018EmpiricalPerformanceofRealEstateInvestmentTrustsandShareho...
 
The Triple Threat | Article on Global Resession | Harsh Kumar
The Triple Threat | Article on Global Resession | Harsh KumarThe Triple Threat | Article on Global Resession | Harsh Kumar
The Triple Threat | Article on Global Resession | Harsh Kumar
 
20240417-Calibre-April-2024-Investor-Presentation.pdf
20240417-Calibre-April-2024-Investor-Presentation.pdf20240417-Calibre-April-2024-Investor-Presentation.pdf
20240417-Calibre-April-2024-Investor-Presentation.pdf
 
Call Girls In Yusuf Sarai Women Seeking Men 9654467111
Call Girls In Yusuf Sarai Women Seeking Men 9654467111Call Girls In Yusuf Sarai Women Seeking Men 9654467111
Call Girls In Yusuf Sarai Women Seeking Men 9654467111
 
Vip B Aizawl Call Girls #9907093804 Contact Number Escorts Service Aizawl
Vip B Aizawl Call Girls #9907093804 Contact Number Escorts Service AizawlVip B Aizawl Call Girls #9907093804 Contact Number Escorts Service Aizawl
Vip B Aizawl Call Girls #9907093804 Contact Number Escorts Service Aizawl
 
Commercial Bank Economic Capsule - April 2024
Commercial Bank Economic Capsule - April 2024Commercial Bank Economic Capsule - April 2024
Commercial Bank Economic Capsule - April 2024
 
Bladex Earnings Call Presentation 1Q2024
Bladex Earnings Call Presentation 1Q2024Bladex Earnings Call Presentation 1Q2024
Bladex Earnings Call Presentation 1Q2024
 
Instant Issue Debit Cards - High School Spirit
Instant Issue Debit Cards - High School SpiritInstant Issue Debit Cards - High School Spirit
Instant Issue Debit Cards - High School Spirit
 
(DIYA) Bhumkar Chowk Call Girls Just Call 7001035870 [ Cash on Delivery ] Pun...
(DIYA) Bhumkar Chowk Call Girls Just Call 7001035870 [ Cash on Delivery ] Pun...(DIYA) Bhumkar Chowk Call Girls Just Call 7001035870 [ Cash on Delivery ] Pun...
(DIYA) Bhumkar Chowk Call Girls Just Call 7001035870 [ Cash on Delivery ] Pun...
 
Malad Call Girl in Services 9892124323 | ₹,4500 With Room Free Delivery
Malad Call Girl in Services  9892124323 | ₹,4500 With Room Free DeliveryMalad Call Girl in Services  9892124323 | ₹,4500 With Room Free Delivery
Malad Call Girl in Services 9892124323 | ₹,4500 With Room Free Delivery
 
House of Commons ; CDC schemes overview document
House of Commons ; CDC schemes overview documentHouse of Commons ; CDC schemes overview document
House of Commons ; CDC schemes overview document
 
🔝9953056974 🔝Call Girls In Dwarka Escort Service Delhi NCR
🔝9953056974 🔝Call Girls In Dwarka Escort Service Delhi NCR🔝9953056974 🔝Call Girls In Dwarka Escort Service Delhi NCR
🔝9953056974 🔝Call Girls In Dwarka Escort Service Delhi NCR
 
VIP Call Girls LB Nagar ( Hyderabad ) Phone 8250192130 | ₹5k To 25k With Room...
VIP Call Girls LB Nagar ( Hyderabad ) Phone 8250192130 | ₹5k To 25k With Room...VIP Call Girls LB Nagar ( Hyderabad ) Phone 8250192130 | ₹5k To 25k With Room...
VIP Call Girls LB Nagar ( Hyderabad ) Phone 8250192130 | ₹5k To 25k With Room...
 
call girls in Nand Nagri (DELHI) 🔝 >༒9953330565🔝 genuine Escort Service 🔝✔️✔️
call girls in  Nand Nagri (DELHI) 🔝 >༒9953330565🔝 genuine Escort Service 🔝✔️✔️call girls in  Nand Nagri (DELHI) 🔝 >༒9953330565🔝 genuine Escort Service 🔝✔️✔️
call girls in Nand Nagri (DELHI) 🔝 >༒9953330565🔝 genuine Escort Service 🔝✔️✔️
 

Liberty Bank Research Note - Q2 2013 and 1H 2013 Results

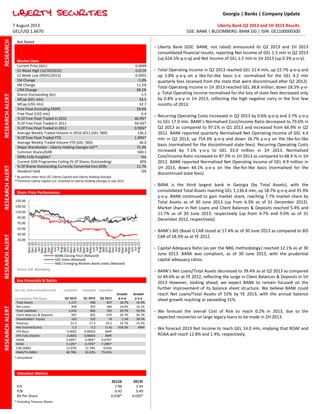
  • 1. Georgia | Banks | Company Update RESEARCH ALERT RESEARCH ALERT RESEARCH ALERT RESEARCH RESEARCH ALERT RESEARCH ALERT RESEARCH ALERT 7 August 2013 GEL/US$ 1.6670 Liberty Bank Q2 2013 and 1H 2013 Results GSE: BANK | BLOOMBERG: BANK GG | ISIN: GE1100000300 Not Rated Liberty Bank (GSE: BANK, not rated) announced its Q2 2013 and 1H 2013 consolidated financial results, reporting Net Income of GEL 1.3 mln in Q2 2013 (up 624.5% q-o-q) and Net Income of GEL 1.5 mln in 1H 2013 (up 0.3% y-o-y). Market Data Current Price (GEL) 52 Week High (12/10/2012) 52 Week Low (09/01/2013) 1M Change 3M Change 12M Change Shares Outstanding (bn) MCap (GEL mln) MCap (US$ mln) Free Float (Including ESOP) Free Float (US$ mln) % Of Free Float Traded in 2010 % Of Free Float Traded in 2011 % Of Free Float Traded in 2012 Average Weekly Traded Volume in 2010-2012 (GEL '000) % Of Free Float Traded YTD Average Weekly Traded Volume YTD (GEL '000) Major Shareholder - Liberty Holding Georgia Ltd** Common Shares/GDR GDRs Fully Fungible? Current GDR Programme Ceiling (% Of Shares Outstanding) % Of Shares Outstanding Currently Converted Into GDRs Dividend Yield 0.0099 0.0170 0.0055 -1.0% 11.2% -38.1% 5.5 54.5 32.7 19.6% 6.4 46.9%* 59.5%* 0.95%* 136.2 1.99%* 46.0 72.4% 500:1 Yes 30% 11.7% 0% * By parties other than JSC Liberty Capital and Liberty Holding Georgia **Formerly Liberty Capital LLC; renamed to Liberty Holding Georgia in July 2012 150.00 130.00 110.00 90.00 70.00 50.00 BANK’s BIS (Basel I) CAR stood at 17.4% as of 30 June 2013 as compared to BIS CAR of 18.3% as at YE 2012. 30.00 Nov-10 Dec-10 Dec-10 Jan-11 Mar-11 Mar-11 Apr-11 May-11 Jun-11 Jul-11 Aug-11 Sep-11 Oct-11 Nov-11 Dec-11 Jan-12 Feb-12 Mar-12 Apr-12 May-12 Jun-12 Jul-12 Aug-12 Sep-12 Oct-12 Nov-12 Dec-12 Jan-13 Feb-13 Mar-13 Apr-13 May-13 Jun-13 Jul-13 Aug-13 10.00 BANK Closing Price (Rebased) GSE Index (Rebased) MSCI Emerging Markets Banks Index (Rebased) Source: GSE, Bloomberg Key Financials & Ratios GEL mln, unless otherwise noted Consolidated, IFRS-based RESEARCH ALERT Recurring Operating Costs increased in Q2 2013 by 0.6% q-o-q and 3.7% y-o-y to GEL 17.0 mln. BANK’s Normalised Cost/Income Ratio decreased to 79.6% in Q2 2013 as compared to 97.1% in Q1 2013 and increased from 66.9% in Q2 2012. BANK reported quarterly Normalised Net Operating Income of GEL 4.4 mln in Q2 2013, up 754.3% q-o-q and down 16.7% y-o-y on the like-for-like basis (normalised for the discontinued state fees). Recurring Operating Costs increased by 7.1% y-o-y to GEL 33.9 million in 1H 2013. Normalised Cost/Income Ratio increased to 87.5% in 1H 2013 as compared to 68.9 % in 1H 2012. BANK reported Normalised Net Operating Income of GEL 4.9 million in 1H 2013, down 44.1% y-o-y on the like-for-like basis (normalised for the discontinued state fees). BANK is the third largest bank in Georgia (by Total Assets), with the consolidated Total Assets reaching GEL 1,136.6 mln, up 18.7% q-o-q and 35.9% y-o-y. BANK continued to gain market share, reaching 7.7% market share by Total Assets as of 30 June 2013 (up from 6.3% as of 31 December 2012). Market share in Net Loans and Client Balances & Deposits reached 5.4% and 11.7% as of 30 June 2013, respectively (up from 4.7% and 9.0% as of 31 December 2012, respectively). Share Price Performance Total Assets Net Loans Total Liabilities Client Balances & Deposits Shareholders’ Equity Revenue Net Income/(Loss) EPS Basic EPS Fully Diluted ROAA ROAE CAR (NBG) RWA/TA (NBG) Unaudited d Unaudited d Unaudited d Q2 2013 1,137 448 1,033 997 103 21.4 1.3 0.0002 0.0002 0.49%* 5.12%* 12.07% 60.78% Q1 2013 958 393 856 825 102 17.4 0.2 0.00003 0.00003 0.08%* 0.72%* 12.78% 63.22% Q2 2012 837 386 762 679 74 25.2 (1.4) NMF NMF -0.67%* -7.28%* 9.05% 75.81% Growth q-o-q 18.7% 14.0% 20.7% 20.7% 1.3% 22.7% 624.5% Growth y-o-y 35.9% 16.1% 35.5% 46.7% 39.3% -15.3% NMF * Annualised ALERT RESEARCH ALERT Total Operating Income in Q2 2013 reached GEL 21.4 mln, up 22.7% q-o-q and up 1.8% y-o-y on a like-for-like basis (i.e. normalised for the GEL 4.2 mln quarterly fees received from the state that were discontinued after Q2 2012). Total Operating Income in 1H 2013 reached GEL 38.8 million, down 18.5% y-oy. Total Operating Income normalised for the loss of state fees decreased only by 0.8% y-o-y in 1H 2013, reflecting the high negative carry in the first few months of 2013. Valuation Metrics P/E P/B BV Per Share * Excluding Treasury Shares 2012A 7.96 0.42 0.018* 2013F 3.93 0.49 0.020* Capital Adequacy Ratio (as per the NBG methodology) reached 12.1% as at 30 June 2013. BANK was compliant, as of 30 June 2013, with the prudential capital adequacy ratios. BANK’s Net Loans/Total Assets decreased to 39.4% as at Q2 2013 as compared to 44.6% as at YE 2012, reflecting the surge in Client Balances & Deposits in 1H 2013 However, looking ahead, we expect BANK to remain focused on the further improvement of its balance sheet structure. We believe BANK could reach Net Loans/Total Assets of 52% by YE 2013, with the annual balance sheet growth reaching or exceeding 31%. We forecast the overall Cost of Risk to reach 0.2% in 2013, due to the expected recoveries on large legacy loans to be made in 2H 2013. We forecast 2013 Net Income to reach GEL 14.0 mln, implying that ROAE and ROAA will reach 12.8% and 1.4%, respectively.
  • 2. Liberty Bank Q2 2013 and 1H 2013 Results GSE: BANK | BLOOMBERG: BANK.GG | ISIN: GE1100000300 RESEARCH ALERT RESEARCH ALERT RESEARCH ALERT RESEARCH ALERT RESEARCH ALERT Income Statement Consolidated, IFRS-based GEL '000, unless otherwise noted Interest Income Interest Expense Net Interest Income Fee And Commission Income Fee And Commission Expenses Net Fee And Commission Income Net Income From Documentary Operations Net Other Non-Interest Income Net Income From FX And Translation Operations Net Non-Interest Income Total Operating Income Recurring Operating Costs Normalised Net Operating Income Non-Recurring Costs/(Income) Profit (Pre-Bonus) Before Provisions Net Provisions Pre-Bonus Result Discretionary Bonus Pool Share Of Associates' Net Profit Pre-Tax Profit Accrued Or Paid Income Tax Benefit/(Expense) Impairment Of Deferred Tax Asset Net Income Balance Sheet Consolidated, IFRS-based GEL '000, unless otherwise noted Cash And Due From Banks Treasuries Other Fixed Income Instruments Net Loans Net Investments Investment Property Net Property, Plant And Equipment Net Other Assets Total Assets Total Balances & Deposits Borrowed Funds Other Liabilities Contingent Capital Participation Note Total Liabilities Shareholders' Equity Total Liabilities And Shareholders' Equity Selected Ratios Consolidated, IFRS-based %, unless otherwise noted ROAA ROAE Net Interest Margin Net Spread Net Non-Interest Income/Total Operating Income Net Income/Total Operating Income Net Fee & Commission Income/Total Operating Income Net Fee & Commission Income/Average Total Assets Cost/Income Ratio (Normalised) Costs/Average Total Assets (Normalised) Personnel Costs/Total Operating Income Personnel Costs/Average Total Assets Personnel Costs/Total Recurring Operating Costs Net Loans/Total Assets Total Balances & Deposits/Total Liabilities Net Loans/Total Balances & Deposits Net Loans/Total Liabilities Liquid Assets/Total Assets Leverage (Total Liabilities/Equity), Times Shareholders' Equity/Total Assets Average Shareholders' Equity/Average Total Assets Loan Loss Reserves/Gross Loans NPLs/Gross Loans LLR Coverage Ratio Cost of Risk (Standalone) Unaudited Q2 2013 37,427 23,768 13,659 6,522 718 5,804 116 315 1,486 7,721 21,380 17,023 4,357 114 4,242 2,761 1,543 6 1,549 (235) 1,314 Unaudited Q1 2013 32,830 21,767 11,063 5,270 674 4,596 111 267 1,394 6,367 17,430 16,920 510 31 479 304 206 12 218 (36) 181 Unaudited Q2 2012 32,006 17,980 14,026 10,146 727 9,419 284 232 1,287 11,222 25,248 16,417 8,831 (51) 8,882 5,806 3,152 476 (43) 2,633 (4,019) (1,386) Unaudited Q2 2013 412,809 104,172 447,780 244 4,793 125,240 23,404 1,136,604 997,896 20,132 1,033,123 103,481 1,136,604 Q2 2013 0.49% 5.12% 8.09% 10.70% 36.11% 6.15% 27.15% 2.18% 79.62% 6.38% 42.18% 3.38% 52.97% 39.40% 96.59% 44.87% 43.34% 45.48% 9.98 9.10% 9.62% 3.94% 6.67% 74.81% 2.06% Q1 2013 0.08% 0.72% 7.63% 10.69% 36.53% 1.04% 26.37% 2.01% 97.07% 7.39% 51.42% 3.91% 52.97% 41.01% 96.62% 47.51% 45.91% 41.59% 8.38 10.67% 11.01% 4.04% 6.72% 75.54% 0.26% Unaudited Q1 2013 324,758 73,572 392,828 196 4,793 124,710 20,586 957,825 826,769 17,510 855,662 102,163 957,825 Q2 2012 -0.67% -7.28% 9.53% 9.44% 44.45% -5.49% 37.31% 4.58% 66.91% 8.21% 36.07% 4.42% 55.47% 46.12% 90.60% 55.86% 50.61% 33.28% 10.27 8.88% 9.25% 7.95% 10.92% 93.69% 5.17% Growth q-o-q 14.0% 9.2% 23.5% 23.8% 6.5% 26.3% 4.8% 18.0% 6.6% 21.3% 22.7% 0.6% 754.3% 266.9% 786.0% 807.8% 650.5% 0.0% -52.9% 611.6% 547.3% 0.0% 624.5% Audited 2012 235,533 57,497 374,003 173 4,793 126,095 24,820 838,932 691,177 26,667 15,491 740,270 98,661 838,932 1H 2013 0.30% 2.94% 7.9% 10.69% 36.30% 3.85% 26.80% 2.10% 87.46% 6.85% 46.33% 3.63% 52.97% 39.40% 96.59% 44.87% 43.34% 45.48% 9.98 9.10% 10.26% 3.94% 6.67% 74.81% 1.22% Growth y-o-y 16.9% 32.2% -2.6% -35.7% -1.3% -38.4% -59.1% 35.6% 15.5% -31.2% -15.3% 3.7% -50.7% NMF -52.2% -52.4% -51.0% -100.0% NMF -41.2% NMF NMF NMF Unaudited 1H 2013 70,257 45,535 24,722 11,792 1,393 10,400 226 582 2,880 14,088 38,810 33,943 4,867 146 4,721 3,065 1,749 18 1,767 (271) 1,496 Unaudited 1H 2012 61,172 35,248 25,924 19,550 1,351 18,199 560 454 2,473 21,687 47,611 31,704 15,907 (176) 16,082 9,085 7,146 1,082 (39) 6,026 (4,534) 1,492 Unaudited Q2 2012 160,527 117,911 385,823 347 25,021 98,940 33,936 836,642 690,717 20,096 24,162 18,615 762,375 74,267 836,642 Growth q-o-q 27.1% 41.6% NMF 14.0% 24.5% 0.0% 0.4% 13.7% 18.7% 20.7% NMF 15.0% NMF 20.7% 1.3% 18.7% Growth YTD 75.3% 81.2% NMF 19.7% 41.1% 0.0% -0.7% -5.7% 35.5% 44.4% -100.0% 30.0% NMF 39.6% 4.9% 35.5% 1H2012 0.36% 3.96% 8.7% 8.47% 45.55% 3.13% 38.22% 4.45% 68.86% 8.01% 37.82% 4.40% 56.80% 46.12% 90.60% 55.86% 50.61% 33.28% 10.27 8.88% 9.21% 7.95% 10.92% 93.69% 4.31% 2012 0.62% 6.44% 9.03% 8.88% 40.60% 5.64% 31.77% 3.48% 75.37% 8.25% 40.85% 4.47% 56.14% 44.58% 93.37% 54.11% 50.52% 34.93% 7.50 11.76% 9.59% 4.33% 5.27% 98.99% 3.03% 2011 1.06% 13.29% 9.44% 9.78% 50.95% 9.15% 42.80% 4.96% 70.78% 8.21% 37.11% 4.30% 54.10% 43.74% 93.86% 51.73% 48.56% 35.35% 9.08 9.36% 7.99% 7.80% 11.66% 86.30% 6.21% 2010 1.11% 21.58% 11.89% 18.08% 62.43% 7.39% 51.29% 7.64% 73.16% 10.90% 40.12% 5.97% 54.83% 29.49% 80.52% 39.19% 31.54% 42.00% 15.25 6.15% 7.04% 11.02% 18.55% 59.84% 7.01% Growth y-o-y 14.9% 29.2% -4.6% -39.7% 3.1% -42.9% -59.6% 28.1% 16.4% -35.0% -18.5% 7.1% -69.4% NMF -70.6% -66.3% -75.5% -100.0% NMF -70.7% NMF -100.0% 0.3% Growth y-o-y 157.2% -11.7% NMF 16.1% -29.7% -80.8% 26.6% -31.0% 35.9% 44.5% -100.0% -16.7% -100.0% 35.5% 39.3% 35.9% 2009 -1.70% -45.86% 3.16% 8.15% 89.85% -13.21% 71.49% 9.21% 103.44% 13.33% 48.99% 6.31% 47.36% 25.14% 81.38% 31.81% 25.88% 35.06% 33.80 2.87% 3.71% 20.34% 35.46% 60.35% 14.01% Quarterly ratios are annualised, where applicable 2
  • 3. Liberty Bank Q2 2013 and 1H 2013 Results GSE: BANK | BLOOMBERG: BANK.GG | ISIN: GE1100000300 Liberty Securities Liberty Tower 74 I. Chavchavadze Ave Tbilisi, Georgia 0162 Tel: + 995 32 2555 500 research@libertysecurities.ge www.libertysecurities.ge Skype: liberty.securities Temur Iremashvili Director Liberty Securities +995 591 158 877 temur.iremashvili@libertysecurities.ge Skype: Temur Iremashvili Victor Meskhi Director of Research Liberty Securities +995 593 551 506 victor.meskhi@libertysecurities.ge Skype: v.meskhi Liberty Capital & Liberty Bank Tengiz Lashkhi Asset Management Director Liberty Securities +995 591 709 280 tengiz.lashkhi@libertysecurities.ge This document has been produced by Liberty Securities Ltd (“Liberty Securities”). Liberty Securities is a full-service broker-dealer wholly-owned by JSC Liberty Bank and licensed and regulated by the National Bank of Georgia. Liberty Bank is a significant client of Liberty Securities. Liberty Securities and/or persons connected with it may effect or may have effected a transaction or transactions for their own account in the Securities referred to in this document or any related investment before the material is published to Liberty Securities’ clients. Persons connected with Liberty Securities may provide or have provided corporate finance and other services to the issuer(s) of the Securities and may seek to do so in the future. Accordingly, information may be available to Liberty Securities and/or persons connected with it which is not reflected in this document. Liberty Securities, persons connected with it and their respective principals, directors, employees and/or representatives may have a position in the Securities and/or any related investment and may make a purchase and/or sale, or offer to make a purchase and/or sale, of the Securities and/or any related investment from time to time, in the open market or otherwise, in each case either as principal or as agent. This document is not, and should not be construed as an offer to sell or solicitation of an offer to buy any securities. The information and opinions contained in this document have been compiled or arrived at by Liberty Securities from sources believed to be reliable and in good faith, but no representation or warranty, express or implied, is made as to their accuracy, completeness or correctness. All opinions and estimates contained in this document constitute Liberty Securities’ judgement as of the date hereof and are subject to change without notice. The information contained in this document is published for the assistance of the intended recipients, but is not to be relied upon as authoritative or taken in the substitution of the exercise of judgement by any recipient. Liberty Securities accepts no liability whatsoever for any direct or consequential loss arising from any use of this document or its contents. This document may not be reproduced, distributed or published for any purpose. It is not intended for and must not be distributed to private customers. Further information may be obtained and for this purpose the intended recipients hereof should contact Liberty Securities at the address given above. This document is not to be distributed in the United States and the United Kingdom, and in any other jurisdiction where such distribution is unlawful.