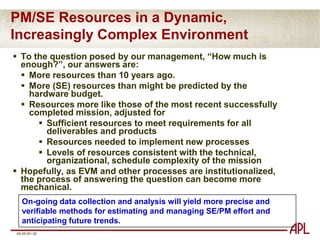
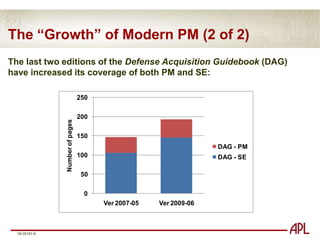
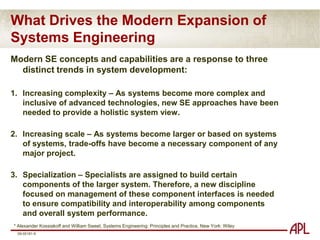
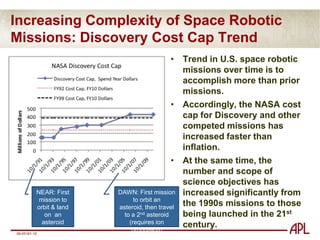
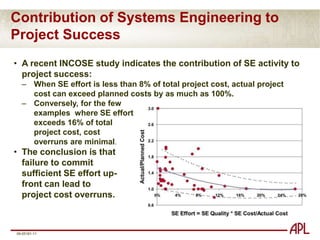
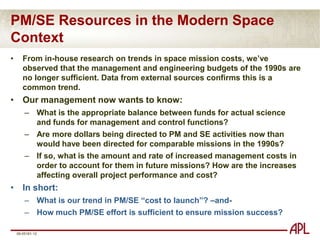
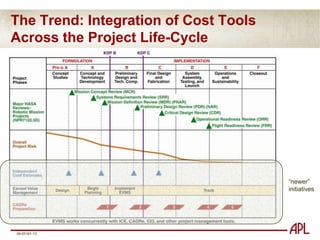
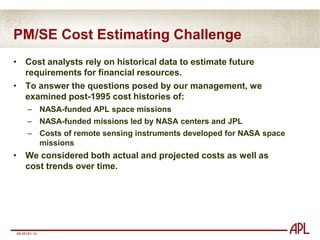
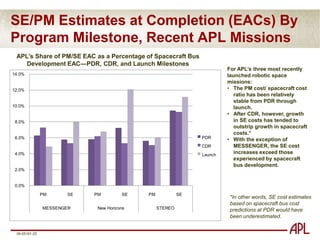
This document discusses trends in project management (PM) and systems engineering (SE) costs for NASA space missions. It finds that PM and SE costs have been increasing over time as a percentage of total mission costs, driven by factors like increasing technical complexity, scale of projects, and specialization. Data is presented showing trends in PM and SE costs for NASA-funded APL space missions and other NASA robotic missions from 1996-2018. While instrument management costs have declined for some missions since 2002, overall the data indicates PM and SE costs are growing and additional resources are needed to ensure project success in the current environment.
![[PM] includes project reviews and documentation, non-project owned facilities, and project reserves.](https://image.slidesharecdn.com/shinn-111018103724-phpapp02/85/Shinn-4-320.jpg)
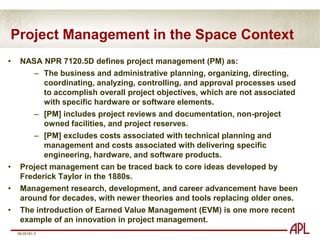
![[PM] excludes costs associated with technical planning and management and costs associated with delivering specific engineering, hardware, and software products.Project management can be traced back to core ideas developed by Frederick Taylor in the 1880s. Management research, development, and career advancement have been around for decades, with newer theories and tools replacing older ones. The introduction of Earned Value Management (EVM) is one more recent example of an innovation in project management.](https://image.slidesharecdn.com/shinn-111018103724-phpapp02/85/Shinn-5-320.jpg)
![Systems Engineering in the Space ContextNASA NPR 7120.5D defines project-level systems engineering (SE) as:The technical and management efforts of directing and controlling an integrated engineering effort for the project.[SE] includes the efforts to define the project’s space flight vehicle(s) and ground system, conducting trade studies, the integrated planning and control of the technical program efforts of design engineering, software engineering, specialty engineering, system architecture development and integrated test planning, system requirements writing, configuration control, technical oversight, control and monitoring of the technical program, and risk management activities.Documentation products include requirements documents, interface control documents, a Risk Management Plan, and a master verification and validation plan.](https://image.slidesharecdn.com/shinn-111018103724-phpapp02/85/Shinn-6-320.jpg)
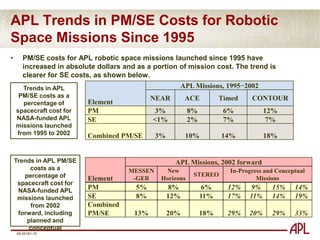
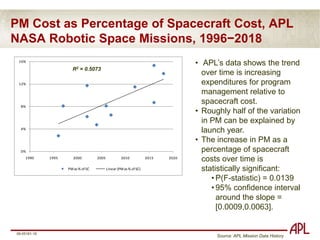
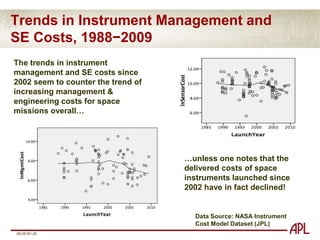
![95% confidence interval around the slope = [0.0009,0.0063].R2 = 0.5073Source: APL Mission Data History](https://image.slidesharecdn.com/shinn-111018103724-phpapp02/85/Shinn-24-320.jpg)
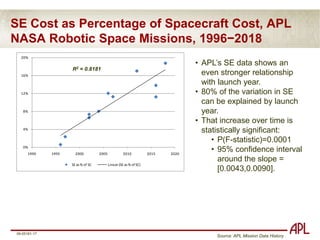
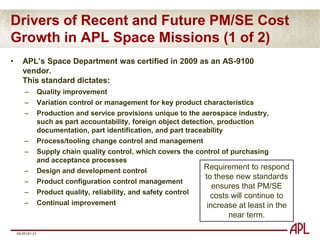
![95% confidence interval around the slope = [0.0043,0.0090].R2 = 0.8181Source: APL Mission Data History](https://image.slidesharecdn.com/shinn-111018103724-phpapp02/85/Shinn-29-320.jpg)