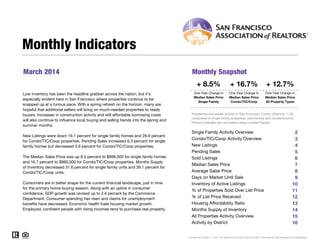
- Housing market activity in San Francisco increased in March 2014 compared to the previous year. The median sales price for single family homes rose 8.5% and condos increased 16.7% from March 2013 levels.
- New listings and pending sales were down compared to the previous year while months of inventory decreased, indicating a strong seller's market with low availability and high demand.
- The local economy is improving, fueling further growth in the housing market as consumer confidence, spending and employment are up.
- Housing market activity in San Francisco increased in October 2014 compared to the previous year. The median sales price for single family homes rose 34.4% and condos rose 10%.
- New listings were down for both single family (-16.2%) and condos (-3.4%) compared to the previous year. Pending sales increased for single family homes by 8.2% but decreased for condos by 12.6%.
- Inventory levels decreased for both single family homes and condos compared to the previous year.
The real estate market in San Francisco remained strong in April 2016, with several key metrics showing year-over-year increases. The median sales price rose 7.1% for single family homes to $1,400,000, and increased 6.6% for condos to $1,149,000. Meanwhile, new listings declined slightly while inventory levels were up. Overall the market conditions were described as predictable with low interest rates and steady price increases in desirable areas.
The monthly real estate snapshot report summarizes residential real estate activity in San Francisco for May 2016. Key metrics showed that new listings were down 10.8% for single family homes and 4.2% for condos from the previous year. Pending sales increased 18.2% for single family but decreased 3.4% for condos. Median sales prices were down slightly at 1.4% for single family homes and 1.1% for condos from the previous year. Inventory levels increased while demand remained high, putting pressure on housing supply.
- Residential real estate activity in San Francisco saw median home sale prices increase 5.4% year-over-year for single family homes but decrease 2.6% for condos from September 2015 to September 2016.
- New listings were down slightly while pending sales decreased more significantly, and months of inventory increased, indicating a softening market.
- Demand has remained high through 2016 due to factors like millennials buying homes and low interest rates, but lower inventory and months of supply point to a cooling real estate market.
San Francisco Real Estate Market Report August 2014Ronny Budiutama
- Residential real estate activity in San Francisco saw a 4.4% increase in the median sales price for single family homes and a 14.8% increase for condos from the previous year in August 2014.
- New listings were down 28.3% for single family homes and 36.7% for condos compared to August 2013, while pending sales decreased 14.4% and 14.2% respectively.
- Sustained job growth, lower mortgage rates, and a slow rise in home inventory have helped drive increased housing demand despite some monthly fluctuations in the market.
- The median sales price for single family homes increased 6.2% year-over-year to $1,115,000, while the median sales price for condos increased 17.4% to $1,100,000.
- New listings decreased for both single family homes and condos compared to February 2014. Pending sales also decreased for both property types compared to the previous year.
- The number of sold properties decreased for both single family homes and condos in February 2015 versus February 2014.
Residential real estate activity in San Francisco saw increases in median sales prices and pending sales in March 2015 compared to the previous year. The median sales price for single family homes rose 27.6% to $1,250,000, while the median price for condos increased 14% to $1,100,000. Pending sales for single family homes were up 6%, though pending sales for condos fell slightly by 0.7%. New listings declined for both single family homes and condos. Overall the real estate market in San Francisco remained strong with higher prices and sales activity despite reductions in inventory.
Residential real estate activity in San Francisco decreased in August 2016. New listings and pending sales declined for both single family homes and condos/co-ops compared to the previous year. The median sales price increased slightly for single family homes but decreased for condos/co-ops. Low inventory continued to be a challenge, putting upward pressure on home prices.
- Residential real estate activity in San Francisco County saw a 0.2% decrease in the median sales price for single family homes but a 4.6% increase for condo/TIC/Coop properties in March 2017 compared to the previous year.
- New listings were down 18.3% for single family homes and 25.7% for condo/TIC/Coop properties, while pending sales increased 6.7% and 27.4% respectively.
- Months supply of inventory decreased 33.3% for single family units and 18.5% for condo/TIC/Coop units in March 2017.
The document summarizes residential real estate activity in San Francisco County for July 2016. It reports that the median sales price increased 6.4% year-over-year for single family homes and 1.0% for condos. New listings were down 23.0% for single family homes and 26.5% for condos year-over-year. Pending sales decreased 20.1% for single family homes but increased 0.4% for condos. Low housing supply has prevented further sales growth despite low mortgage rates and unemployment, as inventory constraints are limiting buyer options and contributing to price increases.
- Housing demand in San Francisco remained strong in August despite rising mortgage rates, with properties selling quickly within 37 days on average.
- The median sales price of single family homes increased 27.7% year-over-year to $977,000, while the median price for condos rose 12.1% to $812,500.
- New listings declined slightly compared to the previous year, falling 3.1% for single family homes and 8.3% for condos, while pending sales rose by small margins for both property types.
- Residential real estate activity in San Francisco saw a 26.5% year-over-year increase in the median sales price of single family homes to $1,410,000 in February 2016, though the median price of condos decreased 0.5% to $1,095,000.
- Inventory levels decreased for single family properties but increased for condos, while new listings were down 18.5% and 9.1% respectively and pending sales decreased for single family but increased for condos.
- Low inventory continues to be a key issue, constraining further growth in sales activity despite strong demand, low interest rates, and economic growth.
Residential real estate activity in San Francisco saw increases in the first half of 2015 compared to the same period last year. The median sales price for single-family homes rose 10.7% to $1,301,000, while condos rose 15.2% to $1,100,000. New listings declined for both segments, down 19.1% for single-family and 26.2% for condos. Pending sales rose 10.5% for single-family but fell 9.1% for condos. Inventory levels decreased across the board, dropping over 25% for both single-family and condo units.
2014 Market Forecast - California Association of RealtorsRonny Budiutama
The document summarizes California's housing market outlook for 2008-2014. It shows that after declining until 2011, home sales and median home prices in California increased in 2012-2013 and are projected to continue rising in 2014. Mortgage interest rates have also trended downward since 2008 and are expected to remain low. Overall the data indicates the California housing market has recovered from the recession and conditions will continue improving in the coming year.
The document provides residential real estate statistics for San Francisco for April 2015. It summarizes that new listings decreased 14.1% for single family homes and 15.8% for condos from the previous year. Median sales prices increased substantially, up 20.6% for single family homes to $1,326,500 and 21.7% for condos to $1,101,000. Months of inventory decreased for both single family homes and condos compared to the previous year.
The document provides a monthly snapshot of real estate activity in San Francisco for March 2016. Some key highlights include:
- Median home sale prices increased 8.4% year-over-year for single family homes but were flat for condos.
- New listings and pending sales decreased compared to previous months and year-ago levels across both single family homes and condos.
- Inventory levels remained flat for single family but increased 22.2% for condos, suggesting the market may be slowing.
- The report concludes that demand remains but low inventory could limit further sales growth in the year ahead if supply does not increase.
Residential real estate activity in San Francisco saw increases in median sales prices in May 2015 compared to the previous year. The median sales price for single family homes rose 28.4% to $1,400,000, while the median price for condos rose 19.7% to $1,125,000. New listings and pending sales declined compared to the previous year, falling 22.9% and 4.2% respectively for single family homes.
Halfway through 2016, the San Francisco residential real estate market is performing as expected, with sales and prices up in most areas while inventory remains low. Specifically:
- Median sales prices increased 3.8% for single-family homes and 7% for condos over the past year.
- New listings were down 21% for single-family but up 13% for condos. Pending sales fell 1% for single-family and 16% for condos.
- Months of supply decreased 5% for single-family but increased 58% for condos, indicating the inventory issue is more pronounced in the condo market.
The document provides detailed data on housing activity and market metrics in San
The document provides a monthly snapshot of real estate activity in San Francisco for August 2017. It summarizes that median home sale prices increased 10.4% for single family homes and 10.8% for condos from the previous year. New listings and pending sales decreased compared to the previous year, while months of inventory available also decreased. The prevailing housing trends from the summer were expected to continue as economic factors have remained stable in recent years.
Residential real estate activity in San Francisco remained strong in November 2016, with certain metrics showing year-over-year increases. The median sales price of single-family homes rose 8.1% compared to November 2015, though the median price for condos fell 7.2%. New listings were down 21.7% for single-family homes and 31.3% for condos year-over-year. Pending sales rose 17.7% for single-family homes and 10.9% for condos. The housing market outlook remains uncertain following the presidential election.
The monthly snapshot report provides key housing market metrics for San Francisco County. In February 2017:
- New listings were down 36.1% for single family homes and 23.7% for condos from the previous year.
- Median sales prices were down 7.6% for single family homes but up 10.3% for condos compared to February 2016.
- Inventory decreased 25% for single family homes and 4.3% for condos, while pending sales rose slightly for single family and fell for condos.
The report indicates the local housing market remains very competitive with low inventory and high demand, particularly in the single family home segment.
San Francisco Real Estate Housing Market December 2016Ronny Budiutama
The document provides a monthly snapshot of residential real estate activity in San Francisco County for December 2016. Some key highlights include:
- Median sales prices for single family homes increased 8.9% year-over-year while median prices for condos decreased 8.3%.
- New listings and pending sales were down significantly year-over-year for both single family homes and condos.
- Months of inventory decreased while average and median sales prices generally increased, suggesting an ongoing seller's market with high demand and low supply.
Residential real estate activity in San Francisco decreased in October 2016 compared to the previous year. The median sales price increased 11% for single family homes but only 4.5% for condos. New listings and pending sales declined over 22% and 15% respectively for single family properties, and 16% and 14% for condos. Inventory levels rose for both market segments as demand softened amid low housing supply.
This document summarizes residential real estate activity in San Francisco for July 2017. It finds that new listings were down 28.9% for single family homes and 20.4% for condos from the previous year. The median sales price rose 9.7% for single family homes to $1,431,000 and 12.4% for condos to $1,175,000, while months of inventory decreased. The report indicates the market remains strongly in favor of sellers with multiple offers and homes selling quickly.
San Francisco Real Estate Housing Market January 2017Ronny Budiutama
- Residential real estate activity in San Francisco saw an increase in the median sales price of single family homes of 7.1% in January 2017 compared to January 2016, but a decrease of 5.7% for condominiums.
- New listings were down 24.6% for single family homes and 7.5% for condominiums in January 2017 versus January 2016.
- Pending sales decreased 9.1% for single family homes but increased 0.7% for condominiums in January 2017 compared to January 2016.
In 2015, the national residential real estate market performed well overall with healthy supply and demand driven by low interest rates and improved employment. Housing markets have shown resilience to recent interest rate increases. The San Francisco residential real estate market saw increases in median home prices in 2015, with single family home prices up 12% and condo prices up 18.7% compared to 2014. Both new listings and pending sales declined in December 2015 compared to the previous year.
The document provides a monthly snapshot of real estate activity in San Francisco for July 2015. Some key points:
- Median home sale prices increased 18.8% year-over-year for single family homes and 6.3% for condos.
- New property listings declined 17.7% for single family homes and 32.9% for condos compared to the previous year.
- Pending home sales decreased 9.7% for single family homes and 13.5% for condos over the same period.
- The housing market showed signs of stability and strength despite a continued low national homeownership rate near 50-year lows.
- Home prices rose significantly in San Francisco year-over-year in August 2015, with median sales prices up 26.6% for single family homes and 12.4% for condos.
- Residential real estate activity decreased from the previous year, with new listings down 16.0% for single family homes and 21.6% for condos, and pending sales down 3.9% and 10.5% respectively.
- The report analyzed various housing market metrics and found that while activity was lower than the previous year, prices remained substantially higher, indicating the market remains strong despite less inventory.
San Francisco asking and sold price property 4 16 2014Ronny Budiutama
This document summarizes the sale details of 44 single-family homes in San Francisco that sold between April 1st and April 16th, 2014. It lists the address, number of bedrooms and bathrooms, square footage, sale price, price per square foot, and days on market for each property. The homes sold at prices ranging from $310,000 to $6,500,000 and were located across many neighborhoods in San Francisco.
The document provides housing market statistics for San Francisco for the month of June 2013. It notes that median sales prices increased 22.4% for single family homes and 9.5% for condos from the previous year. New listings decreased slightly while pending sales increased 16% for single family and decreased 10% for condos. The housing market remains very strong despite low inventory and interest rates rising slightly from previous lows.
The document provides an overview of residential real estate activity in San Francisco County for October 2013, noting robust gains in home sales prices and volumes throughout the year. Median single family home prices exceeded $1 million in April and May, though new listings decreased for single family homes while pending sales also dropped. The economy continues recovering slowly from the government shutdown, though consumer confidence and spending remain important drivers of the housing market.
San Francisco South Beach april 2011 april 2013Ronny Budiutama
The document compares median sold prices, number of sold properties, number of under contract properties, and number of new properties for condominiums in South Beach for April 2011 and April 2013. It finds that the median sold price increased 36% over this period, while the number of sold properties decreased slightly by 3%. Meanwhile, the number of under contract properties increased significantly by 89% and the number of new properties rose by 23%.
The monthly snapshot report summarizes real estate activity in San Francisco for January 2014. Key points include:
- Median home sale prices increased 24.6% for both single family and condo/co-op properties compared to January 2013.
- New property listings decreased 11.3% for single family homes and 7.8% for condos/co-ops from the previous year.
- Inventory levels dropped with months supply of housing falling 20% for single family and 31.6% for condos/co-ops.
Residential real estate activity in San Francisco County saw encouraging signs in November 2013, though some metrics moderated from multiyear highs. New listings and pending sales decreased month-over-month for both single family homes and condos/co-ops. However, median sales prices continued rising sharply with a 20.4% increase for single family homes and 6.5% for condos/co-ops compared to November 2012. Strong economic data and job growth are supporting the housing recovery. Watch for further tapering of the Federal Reserve's stimulus program in March 2014.
The document is a monthly real estate snapshot for San Francisco County that provides key metrics and year-over-year changes for November 2014. It shows that median sales prices increased 20.2% for single family homes and 24.1% for condos from November 2013 to November 2014. New listings decreased 35.7% for single family homes and 22.5% for condos compared to the previous year. Pending sales were down 7.6% for single family homes and 20.8% for condos.
The document provides a forecast for the California housing market in 2013. It predicts that in 2013, home sales will increase by 1.3% and the median home price will rise by 5.7% compared to 2012. The dollar volume of home sales is also expected to increase, up 7% in 2013 after a 16.5% rise in 2012. The forecast expects continued recovery in the California housing market in 2013, with both home sales transactions and median home prices increasing compared to 2012 levels.
In September 2013:
- San Francisco's housing market remained very strong with high demand from buyers and low inventory.
- The median sales price for single family homes increased 29.0% year-over-year to $935,000, while the median price for condos rose 6.8% to $829,044.
- Pending sales were up 14.1% for single family homes and 11.9% for condos, reflecting continued high buyer demand, while new listings declined slightly, exacerbating the low inventory.
The monthly snapshot report summarizes real estate activity in San Francisco for September 2015. Median home prices rose 14.6% for single family homes and 17.5% for condos year-over-year. New listings fell 21.7% for single family but rose 1.3% for condos. Pending sales were down for both. The report concludes that the housing market remains healthy with continued job growth and low interest rates.
The document discusses the benefits of exercise for mental health. Regular physical activity can help reduce anxiety and depression and improve mood and cognitive functioning. Exercise causes chemical changes in the brain that may help protect against mental illness and improve symptoms.
The document provides monthly median home sale price data for San Francisco over a two year period from April 2010 to April 2012. It shows that the median sale price was down 3% in April 2012 compared to April 2010, with prices of $760,000 in April 2012 versus $782,000 in April 2010. Additionally, the number of homes sold increased 8% from 203 in April 2010 to 219 in April 2012. Finally, the number of homes under contract declined 11% from 267 in April 2010 to 238 in April 2012.
The document discusses sustainable tourism and golf courses in Andalusia, Spain. It outlines the territorial development plans established by the Andalusian government to separate real estate development from golf course construction and prioritize environmental sustainability. These plans include the Territorial Development Plan of Andalusia, Urban Plans of Subregional Areas, and the Sustainable Tourism Plan. The goals are to balance tourism growth, protect the environment and local culture, and generate long-term local employment. Golf course regulations established by the decree 43/2008 require bioclimatic design, landscape integration, renewable energies, water and waste management, and environmental certification.
Incremental pattern matching in the VIATRA2 model transformation frameworkIstvan Rath
This document discusses incremental pattern matching in the VIATRA2 model transformation framework. It introduces incremental pattern matching using the RETE algorithm as implemented in VIATRA2. The RETE algorithm caches pattern matches and incrementally updates them as the model changes. This allows pattern matching to be performed incrementally for efficient model transformations on evolving models. The document outlines how RETE networks are constructed from patterns and how they are updated based on model changes notified through the VIATRA framework. Initial performance analysis is discussed to compare incremental versus local search approaches.
Getting started with discovery education streaminglindatw
This document provides instructions for using Discovery Education Streaming, including how to create an account, search for videos, view video pages, download or stream videos, organize content into folders, and embed or share videos. New users enter a school passcode to create an account, while existing users log in with their username and password. The search features allow filtering by grade level, subject, and media type, and search results can be further refined. Videos can be added to a personal "My Content" area for later retrieval and organization.
The document provides housing market statistics for San Francisco County for June 2014. Median home sale prices increased 27.8% for single family homes and 25% for condos over the previous year. New property listings declined 17.1% for single family homes and 18.7% for condos compared to June 2013. Pending home sales decreased 29.1% for single family properties but rose 4.1% for condos. Interest rates were generally lower than a year prior and housing demand was picking up in higher price tiers while inventory levels rose slowly in some areas.
- The document is a monthly real estate snapshot for San Francisco from May 2014.
- It summarizes key metrics like median sales prices, new listings, pending sales, and inventory for both single family homes and condos/co-ops in San Francisco.
- The median sales price for single family homes rose 8.1% year-over-year to $1,100,000, while the median price for condos/co-ops rose 14.8% to $952,500 in May 2014 compared to the previous year. New listings and pending sales declined while inventory decreased.
The document provides an overview of the San Francisco residential real estate market in February 2014. Key metrics showed that new listings were down 17.1% for single family homes and 18.4% for condos from the previous year. Pending sales increased 13.4% for single family homes and 11.5% for condos. Median sales prices rose sharply, increasing 35.7% for single family homes to $1,086,500 and 24.9% for condos to $937,000. Months of inventory decreased significantly. The report concludes that while some volatility is expected, the spring market is anticipated to be strong.
Residential real estate activity in San Francisco saw decreases in new listings and pending sales in April 2017 compared to the previous year. The median sales price for single-family homes increased slightly by 1.6% to $1,402,500, while the median price for condos decreased by 4.3% to $1,100,000. Inventory levels also dropped, with months of supply decreasing by 30.8% for single-family homes and 25.8% for condos. Overall, the real estate market remains strong with high demand, though affordability issues persist for some buyers.
- The median sales price of single family homes in San Francisco reached over $1 million in April, the highest point in the last 12 months. Supply remains tight with new listings down 29.1% for single family homes and 23.7% for condos.
- The median sales price was up 10.0% to $1,100,000 for single family homes and 6.8% to $902,500 for condos in April compared to the same month last year.
- Months supply of inventory decreased 38.1% for single family homes and 40.0% for condos in April, indicating low housing supply.
Residential real estate activity in San Francisco saw increases in median sales prices in October 2015 compared to the previous year. The median sales price for single family homes rose 8.4% to $1,290,000, while the median price for condos increased 15.7% to $1,105,000. New listings were down slightly while pending sales remained flat for single family homes and decreased for condos. Inventory levels decreased for single family but increased for condos.
This monthly snapshot summarizes real estate activity in San Francisco for May 2013. Key points include:
- Median home sales prices increased 35.6% for single family homes and 18.2% for condos year-over-year.
- New listings rose 20.1% for single family but fell 5.1% for condos. Pending sales were up for both.
- Inventory levels decreased with months supply down 23.1% for single family and 36.4% for condos.
- The market remains heated with strong demand and constrained supply driving prices higher.
The monthly snapshot report summarizes real estate activity in San Francisco County for March 2018. Median home sale prices increased 25% year-over-year for single family homes and 10% for condos. New listings and pending sales were down compared to the previous year due to low inventory. Despite fewer homes for sale, buyer demand has kept prices rising and is expected to continue doing so.
This document provides a monthly snapshot of residential real estate activity in San Francisco County for September 2014. It finds that the median sales price for single family homes increased 11.7% compared to the previous year, while the median sales price for condos increased 11.4%. Overall real estate markets appear to be continuing their recovery, with new construction reaching six-year highs and rising inventory providing more options for buyers. However, factors like student debt and wage growth are slowing the transition to homeownership for some.
The document is a monthly real estate snapshot for San Francisco County that provides key metrics and year-over-year comparisons. It reports that in May 2017:
- Median home prices rose 12% for single-family homes and 10.9% for condos from a year ago.
- New listings declined 7.4% for single-family homes and 18.4% for condos from a year ago.
- Inventory levels decreased with months supply of inventory falling 24% for single-family homes and 25% for condos from a year ago.
The document provides a monthly snapshot of real estate activity in San Francisco for June 2017. Some key points:
- Median sales prices for single-family homes increased 10.8% year-over-year while median prices for condos decreased 2.6%.
- New listings were down 18.1% for single family homes and 36% for condos compared to the previous year. Pending sales rose for both single family homes and condos.
- Inventory levels decreased significantly with months of supply dropping 30.4% for single family homes and 40% for condos.
The document provides a monthly snapshot of real estate market data and metrics for San Francisco County for March 2019. Some key highlights include:
- New listings were down 34.1% for single family homes and 26.9% for condos/co-ops compared to the previous year. Pending sales also decreased.
- The median sales price was down 2.2% to $1,650,000 for single family homes but remained flat at $1,250,000 for condos/co-ops. Months of inventory decreased as well.
- Residential real estate activity saw declines across several metrics compared to the previous year, indicating a slowing market. The Federal Reserve also recently announced no further
Similar to San Francisco Market Focus March 2014 (12)
The document provides a monthly snapshot of real estate activity in San Francisco for January 2024. It summarizes that median home sale prices increased 15.2% year-over-year for single family homes and 8.7% for condos. Pending home sales increased 32.2% for single family homes and 47.2% for condos. Inventory decreased for single family homes but increased for condos compared to the previous year.
The document provides housing market statistics for San Francisco County for December 2023. It shows that existing home sales in the US rose slightly from the previous month but were down 7.3% from the same period last year. In San Francisco, new listings were down 37.5% for single family homes and 3.8% for condos from the previous year. The median sales price fell 5.7% for single family homes but rose 4.9% for condos compared to December 2022. Inventory remained low overall amid continued affordability challenges for buyers.
- New listings were down 35.9% for single family homes and 1.3% for condo/TIC/Coop properties in November 2023 compared to the previous year.
- The median sales price increased 2.3% to $1,535,000 for single family homes but remained flat at $1,125,000 for condo/TIC/Coop properties in November 2023 year-over-year.
- Inventory remains at historically low levels nationwide, keeping pressure on home prices which have continued to rise despite a slowdown in home sales.
The document provides an annual report on the San Francisco County housing market in 2023. It summarizes that pending home sales decreased 25.6% while sold listings decreased 27.4% compared to 2022. Housing inventory declined 19.7% and median home prices fell 9.1% year-over-year. The report reviews housing market statistics by property type, bedroom count, square footage, and area of San Francisco County.
October 2023 Report: San Francisco Real Estate Market InsightsRonny Budiutama
Residential real estate activity in San Francisco declined in October 2023 compared to the previous year. The median sales price for single family homes fell 1.2% year-over-year to $1,650,000, while the median price for condos dropped 1.3% to $1,185,000. New listings were down for both single family (-1.6%) and condos (-17.2%), while pending sales rose for single family homes (+16.9%) but fell for condos (-4.1%). Inventory remained low, rising 2.7% from the prior month but falling 8.1% from a year ago.
CA Weekly MLS Market Data Report - August 2023Ronny Budiutama
This Power BI report contains various charts and graphs analyzing real estate market trends in different regions of California from 2020 to 2023. It shows metrics for existing single family home closed sales, pending sales, median listing prices, and sales by price segment. Closed sales are broken down by week, year, region and price point with year-over-year comparisons. Pending sales and listings are also shown at the state level and by region and price point. The report provides high-level insights into housing demand, pricing, and sales volume trends over time for existing single family homes in California.
- Residential real estate activity in San Francisco saw declines in July 2023, with new listings down 23.2% for single family homes and 37.7% for condos from the previous year. Pending sales also decreased nearly 20% and 18.5% respectively.
- The median sales price dropped 13% for single family homes to $1,450,000, and 3.1% for condos to $1,159,500 compared to July 2022. Months of inventory increased over 6% for single family and nearly 16% for condos.
- Higher mortgage rates have limited buyer activity while also discouraging homeowners from listing due to not wanting to give up their lower rates, contributing to
- Existing home sales fell 3.4% nationwide in May 2023 compared to the previous month and were down 23% from May 2022 as higher mortgage rates reduced buyer affordability.
- New listings were down 9.0% for single family homes and 36.8% for condos from May 2022 levels, while pending sales decreased 12.0% and 27.7% respectively.
- Median sales prices declined sharply, falling 17.8% for single family homes to $1,650,000 and 7.7% for condos to $1,121,500 compared to May 2022.
- Residential real estate activity in San Francisco County saw declines across key metrics in June 2023 compared to the previous year. The median sales price for single family homes declined 14.6% year-over-year to $1,605,000, while the median price for condos fell 8.9% to $1,130,000. New listings dropped 32.6% for single family homes and 29.5% for condos. Pending sales rose slightly for single family but declined 9.2% for condos. Months of inventory increased for both property types. Nationwide, housing inventory rose 3.8% but remained low while median home prices fell 3.1% annually.
- Residential real estate activity in San Francisco saw declines across key metrics in March 2023 compared to the previous year. New listings were down 29.5% for single family homes and 41.6% for condos. Pending sales decreased 36.9% and 36.4% respectively. The median sales price dropped 15.1% and 10.5% respectively.
- Residential real estate activity in San Francisco saw significant declines in February 2023 compared to the previous year. New listings were down 40.3% for single family homes and 40.7% for condos. Pending sales decreased 39.5% and 25.8% respectively. The median sales price dropped 25.4% for single family homes and 6.3% for condos.
- Residential real estate activity in San Francisco decreased significantly in January 2023 compared to January 2022. New listings and pending sales were down 28.5% and 33.1% respectively for single family homes, and down 28.6% and 40.6% for condo/co-op properties. Median sales prices decreased as well, down 16% for single family homes and 6.5% for condo/co-op properties.
Annual Report on the San Francisco County Housing Market.pdfRonny Budiutama
This annual report summarizes housing market trends in San Francisco County in 2022. Some key points:
- Home sales and new listings declined significantly (over 25%) in 2022 from record highs in 2021, as mortgage rates rose sharply reducing affordability.
- Median home prices increased slightly (0.8%) countywide to $1,450,000, though prices decreased for single family homes and condos.
- Inventory remained very low, with only 653 active listings at the end of the year despite a 28.6% decline in new listings.
- The hot housing market that defined 2021 cooled considerably in 2022 as affordability challenges took hold, though demand remained robust in more
San Francisco Market Report December 2022.pdfRonny Budiutama
In 2022, rising inflation, interest rates, and home prices slowed the US housing market. Pending and existing home sales declined significantly year-over-year in December. In San Francisco, median home prices fell 7.5% for single family homes and 26.5% for condos from December 2021 to December 2022, as higher mortgage rates reduced buyer demand and purchasing power. New listings, pending sales, and closed sales all declined substantially from 2021 levels. Economists predict further price softening and slowing sales in 2023 if inventory remains limited and rates stay high.
San Francisco Market Report November 2022.pdfRonny Budiutama
Residential real estate activity in San Francisco saw declines in November 2022 compared to the previous year. The median sales price for single-family homes decreased 20.2% year-over-year to $1,500,000, while the median price for condos fell 8.9% to $1,148,000. New listings were down 12.3% for single-family properties and 41.9% for condos. Pending sales declined 31.7% for single-family homes and 49.2% for condos. With mortgage rates over double what they were a year ago, housing affordability remains a challenge and fewer buyers and sellers are participating in the market.
- Residential real estate activity in San Francisco declined in October 2022, with new listings, pending sales, and sold listings all decreasing between 24-39% year-over-year for both single family homes and condos.
- The median sales price decreased 7.2% for single family homes to $1,675,000 and 3.8% for condos to $1,200,000 compared to October 2021.
- Months supply of inventory increased over last year for both property types, up 15.8% for single family and 5.7% for condos, as high mortgage rates and inflation dampened homebuyer demand.
San Francisco Market Report September 2022.pdfRonny Budiutama
The real estate market in San Francisco continues to slow in September 2022 as interest rates rise and homebuyer budgets are squeezed. Key metrics show a year-over-year decrease for both single family homes and condos, including new listings down 13.2% and 19.8%, pending sales down 38.2% and 28.8%, and median sales prices down 5.7% and 2.5% respectively. Inventory remains lower than normal but is expected to rise as the market shifts in the coming months.
- Real estate activity in San Francisco County declined in August 2022 compared to the previous year according to the report. Key metrics such as new listings, pending sales, and median sales prices decreased for both single family homes and condo/co-op properties.
- New listings were down 13.7% for single family homes and 20.4% for condos. Pending sales decreased 25.2% and 29.1% respectively. Median sales prices declined 12.0% for single family homes and 14.1% for condos.
- Higher interest rates, inflation, and recession fears have discouraged buyers and sellers, leading to fewer transactions and declining prices compared to the strong market in previous years.
Why is Revit MEP Outsourcing considered an as good option for construction pr...MarsBIM1
Outsourcing MEP modeling services require effective collaboration and coordination amongst multiple engineering trades. The engineers and the designers often change the details of the MEP projects, but the work of Revit MEP drafting services is having the master plan and model of the complete project. To have proper coordination and installation, there is a need to execute the project effectively. Hence, the work of Revit family creation facilitates the MEP engineers.
Listing Turkey - Piyalepasa Istanbul CatalogListing Turkey
We are working around the clock to transform a long-time dream into reality. As a result, Piyalepasa Istanbul will be the largest privately developed urban regeneration project in Turkey.
THE NEIGHBORHOOD WE HAVE BEEN LONGING FOR IS COMING TO LIFE
The good old days of the Piyalepasa neighborhood are being brought back to life with Piyalepasa Istanbul houses, residences, offices, hotels and a pedestrianized shopping avenue.
The wide streets of this 82.000 square meter development conveniently face the main boulevard in a prime Beyoglu location. “Piyalepaşa İstanbul” stands out as the only project designed to offer a neighborhood lifestyle, complete with its grocers, bagel sellers and greengrocer. Piyalepasa Istanbul has all the values to make it an authentic neighborhood, our very own community.
A NEIGHBORHOOD FULL OF LIFE, IN THE HEART OF THE CITY!
“Piyalepaşa İstanbul” is a “mixed-use” concept containing all the elements for a vibrant social life with houses, residences, offices, hotels and high street shopping.
“Piyalepaşa İstanbul” will take the liveliness of Istanbul into its heart. The elegant sparkle of Nisantasi, the young and colorful Besiktas, the variety and multicultural heritage of Istiklal Street will all be contained within the streets of this neighborhood.
“Piyalepaşa İstanbul” bears traces of the most beautiful examples of Turkish architecture from the Seljuks to the Ottomans and from Anatolia to Rumelia. With its graded facades, wide eaves, bay windows, pools, and interior courtyard systems, it offers a new living space without disrupting the city’s silhouette and neighborhood.
“Piyalepaşa İstanbul” is the new attraction of this splendid city.
TO BE AT THE CENTER OF ISTANBUL… THIS IS REAL LUXURY!
With its proximity to D-100 highway, connecting roads and tunnels, “Piyalepaşa İstanbul” is only minutes away from Kabatas, Besiktas, the Golden Horn and Karakoy.
“Piyalepaşa İstanbul” is close to the prestigious new Istanbul Court House, a major hospital, the Perpa trade center and the city’s most lively neighborhoods. With its shuttle service to Okmeydani Metrobus station, Sishane and the Court House subway stations, “Piyalepaşa İstanbul” will provide you with the most convenient transport connections.
https://listingturkey.com/property/piyalepasa-istanbul/
Living in an UBER World - June '24 Sales MeetingTom Blefko
June 2024 Lancaster County Sales Meeting for Berkshire Hathaway HomeServices Homesale Realty covering the following topics: 1. VA Suspends Buyer Agent Payment Plan (article), 2. Frequently Used Terms in title, 3. Zillow Showcase Overview, 4. QuickBuy commission promotion, 5. Documenting Cooperative Compensation, 6. NAR's Code of Ethics - Mass Media Solicitations, 7. Is it really cheaper to rent? 8. Do's and Don't's when Terminating the Agreement of Sale, 9. Living in an UBER World
Selling your home can be easy. Our team helps make it happen.Eric B. Slifkin, PA
Why hire one realtor when you can hire a team for the exact cost? Our team ensures better service, communication, and efficiency, which can make all the difference in finding your perfect home or securing the right buyer. See how we market homes for sellers.
36,778 sq. ft. building; Zoning: SE (Suburban Employment): The (SE) District allows numerous commercial site uses; Passenger elevator; Private and common restrooms; Fully sprinkled; Data center with a grounded floor and a specialized HVAC system; 60 KVA back-up generator; Building/pylon signage; Potential to purchase adjacent parcels; Sale Price: $4,413,360
Gianluigi Torzi | Managing Director and Head of Capital MarketsGianluigi Torzi
Gianluigi Torzi is a prominent figure in the financial industry, known for his strategic leadership as Managing Director and Head of Capital Markets for the Middle East and Africa. Gianluigi Torzi extensive experience in investment banking equips him with the skills to navigate complex financial landscapes and deliver exceptional results for clients
Stark Builders: Where Quality Meets Craftsmanship!shuilykhatunnil
At Stark Builders our vision is to redefine the renovation experience by combining both stunning design and high quality construction skills. We believe that by delivering both these key aspects together we are able to achieve incredible results for our clients and ensure every project reflects their vision and enhances their lifestyle.
Although we are not all related by blood we have created a team of highly professional and hardworking individuals who share the common goal of delivering beautiful and functional renovated spaces. Our tight nit team are able to work together in a way where we pour our passion into each and every project as we have a love for what we do. Building is our life.
Andhra Pradesh, known for its strategic location on the southeastern coast of India, has emerged as a key player in India’s industrial landscape. Over the decades, the state has witnessed significant growth across various sectors,
Anilesh Ahuja Pioneering a Paradigm Shift in Real Estate Success.pptxneilahuja668
Anilesh Ahuja journey is a testament to the power of vision, resilience, and unwavering determination. As a visionary leader, he continues to inspire and empower others to dream big and challenge the status quo. His legacy extends far beyond the realm of real estate, leaving an indelible mark on the industry and the world at large.
Signature Global TITANIUM SPR | 3.5 & 4.5BHK High rise Apartments in Gurgaonglobalsignature2022
Signature Global TITANIUM SPR launched a high rise apartments in Gurgaon . In this project Signature Global offers 3.5 & 4.5 BHK high rise Apartment at sector 71 Gurgaon SPR Road. Signature Global Titanium SPR is IGBC Gold certified, a testament to our commitment to sustainability.
Expressways of India: A Comprehensive Guidenarinav14
India’s expressway network is a testament to the nation’s dedication to improving infrastructure and connectivity. These high-speed corridors facilitate seamless travel across vast distances, reducing travel time and fuel consumption
The SVN® organization shares a portion of their new weekly listings via their SVN Live® Weekly Property Broadcast. Visit https://svn.com/svn-live/ if you would like to attend our weekly call, which we open up to the brokerage community.
1. March 2014 Monthly Snapshot
One-Year Change in One-Year Change in
Median Sales Price
Single Family
Median Sales Price
Condo/TIC/Coop
2
3
4
5
6
7
8
9
10
11
12
13
14
15
16
Monthly Indicators
+ 8.5% + 16.7% + 12.7%
One-Year Change inLow inventory has been the headline grabber across the nation, but it’s
especially evident here in San Francisco where properties continue to be
snapped up at a furious pace. With a spring refresh on the horizon, many are
hopeful that additional sellers will bring on much-needed properties to ready
buyers. Increases in construction activity and still affordable borrowing costs
will also continue to influence local buying and selling trends into the spring and
summer months.
New Listings were down 16.1 percent for single family homes and 28.9 percent
for Condo/TIC/Coop properties. Pending Sales increased 6.3 percent for single
family homes but decreased 5.6 percent for Condo/TIC/Coop properties.
The Median Sales Price was up 8.5 percent to $998,000 for single family homes
and 16.7 percent to $960,000 for Condo/TIC/Coop properties. Months Supply
of Inventory decreased 31.6 percent for single family units and 39.1 percent for
Condo/TIC/Coop units.
Consumers are in better shape for the current financial landscape, just in time
for the primary home-buying season. Along with an uptick in consumer
confidence, GDP growth was revised up to 2.6 percent by the Commerce
Department. Consumer spending has risen and claims for unemployment
benefits have decreased. Economic health fuels housing market growth.
Employed, confident people with rising incomes tend to purchase real property.
Median Sales Price
All Property Types
Residential real estate activity in San Francisco County (Districts 1-10),
comprised of single-family properties, townhomes and condominiums.
Percent changes are calculated using rounded figures.
Single Family Activity Overview
Months Supply of Inventory
Current as of April 11, 2014. All data from the San Francisco MLS. Powered by 10K Research and Marketing.
Condo/TIC/Coop Activity Overview
Inventory of Active Listings
% of Properties Sold Over List Price
% of List Price Received
Housing Affordability Ratio
All Properties Activity Overview
New Listings
Pending Sales
Sold Listings
Median Sales Price
Average Sales Price
Days on Market Until Sale
Activity by District
2. Single Family Activity Overview
Key metrics by report month and for year-to-date (YTD) starting from the first of the year.
Key Metrics Historical Sparkbars 3-2013 3-2014 Percent Change YTD 2013 YTD 2014 Percent Change
Current as of April 11, 2014. All data from the San Francisco MLS. Powered by 10K Research and Marketing. | Click for Cover Page | 2
Months Supply 1.9 1.3 - 31.6% -- -- --
Affordability Ratio 57 49 - 14.0%
% of List Price Received 109.9% 112.1% + 2.0% 108.3%
65
73.4% + 3.7%
+ 1.7%
49 - 24.6%
110.1%
% of Properties Sold Over List Price 74.9% 77.8% + 3.9% 70.8%
Active Listings 404 281 - 30.4% --
Average Sales Price $1,365,029 $1,446,238 + 5.9% $1,166,199
Days on Market 39 33 - 15.4% 42 37 - 11.9%
$1,395,348
-- --
Median Sales Price $920,000 $998,000 + 8.5% $809,000
Sold Listings 207 171 - 17.4% 497
New Listings 254 213 - 16.1% 669
Pending Sales 207 220 + 6.3% + 1.2%514 520
- 8.5%612
458 - 7.8%
$985,000 + 21.8%
+ 19.6%
3-2011 3-2012 3-2013 3-2014
3-2011 3-2012 3-2013 3-2014
3-2011 3-2012 3-2013 3-2014
3-2011 3-2012 3-2013 3-2014
3-2011 3-2012 3-2013 3-2014
3-2011 3-2012 3-2013 3-2014
3-2011 3-2012 3-2013 3-2014
3-2011 3-2012 3-2013 3-2014
3-2011 3-2012 3-2013 3-2014
3-2011 3-2012 3-2013 3-2014
3-2011 3-2012 3-2013 3-2014
3. Condo/TIC/Coop Activity Overview
Key metrics by report month and for year-to-date (YTD) starting from the first of the year.
Key Metrics Historical Sparkbars 3-2013 3-2014 Percent Change YTD 2013 YTD 2014 Percent Change
Current as of April 11, 2014. All data from the San Francisco MLS. Powered by 10K Research and Marketing. | Click for Cover Page | 3
Months Supply 2.3 1.4 - 39.1% -- -- --
Affordability Ratio 64 50 - 21.9%
% of List Price Received 104.9% 108.6% + 3.5% 103.7%
67
63.9% + 16.6%
+ 2.5%
51 - 23.9%
106.3%
% of Properties Sold Over List Price 63.1% 73.2% + 16.0% 54.8%
Active Listings 615 393 - 36.1% --
Average Sales Price $953,615 $1,064,808 + 11.7% $899,564
Days on Market 42 32 - 23.8% 49
$950,000 + 21.0%
+ 17.6%
40 - 18.4%
$1,057,862
-- --
Sold Listings 282 257 - 8.9% 633 654 + 3.3%
Median Sales Price $822,500 $960,000 + 16.7% $785,000
- 11.5%
Pending Sales 302 285 - 5.6% 693 720 + 3.9%
New Listings 370 263 - 28.9% 996 881
3-2011 3-2012 3-2013 3-2014
3-2011 3-2012 3-2013 3-2014
3-2011 3-2012 3-2013 3-2014
3-2011 3-2012 3-2013 3-2014
3-2011 3-2012 3-2013 3-2014
3-2011 3-2012 3-2013 3-2014
3-2011 3-2012 3-2013 3-2014
3-2011 3-2012 3-2013 3-2014
3-2011 3-2012 3-2013 3-2014
3-2011 3-2012 3-2013 3-2014
3-2011 3-2012 3-2013 3-2014
4. New Listings
New Listings
Single
Family
Year-Over-Year
Change
Condo/TIC/
Coop
Year-Over-Year
Change
Apr-2013 302 +15.3% 396 +15.1%
May-2013 339 +30.9% 384 +2.7%
Jun-2013 293 +13.1% 358 +7.2%
Jul-2013 259 +1.6% 332 +23.4%
Aug-2013 272 +7.1% 341 +8.9%
Sep-2013 296 -6.6% 448 +15.8%
Oct-2013 278 -3.1% 319 +4.6%
Nov-2013 170 -6.1% 190 -10.0%
Dec-2013 110 +7.8% 115 +0.9%
Jan-2014 206 +1.0% 327 +5.5%
Feb-2014 193 -8.5% 291 -7.9%
Mar-2014 213 -16.1% 263 -28.9%
12-Month Avg 244 +3.0% 314 +3.2%
Historical New Listings by Month
Current as of April 11, 2014. All data from the San Francisco MLS. Powered by 10K Research and Marketing. | Click for Cover Page | 4
A count of the properties that have been newly listed on the market in a given month.
290
328
254
370
213
263
Single Family Condo/TIC/Coop
March
0
100
200
300
400
500
600
700
1-2005 1-2006 1-2007 1-2008 1-2009 1-2010 1-2011 1-2012 1-2013 1-2014
Single Family Condo/TIC/Coop
796
939
669
996
612
881
Single Family Condo/TIC/Coop
Year to Date
2012 2013 2014
- 28.9%+ 12.8%- 16.1%- 12.4% + 6.1%- 8.5%- 16.0% - 11.5%
2012 2013 2014 2012 2013 2014 2012 2013 2014
- 15.5% - 11.8% - 19.9%- 18.6%
5. Pending Sales
Pending Sales
Single
Family
Year-Over-Year
Change
Condo/TIC/
Coop
Year-Over-Year
Change
Apr-2013 242 +3.0% 309 -3.4%
May-2013 269 +10.2% 360 +13.9%
Jun-2013 278 +17.3% 290 -7.6%
Jul-2013 250 +10.6% 332 +16.1%
Aug-2013 230 +1.8% 302 +4.5%
Sep-2013 211 +14.7% 254 +16.5%
Oct-2013 245 -14.6% 340 +22.7%
Nov-2013 223 -11.2% 270 -0.4%
Dec-2013 171 +0.6% 201 -1.0%
Jan-2014 135 -14.6% 183 +5.2%
Feb-2014 165 +10.7% 252 +16.1%
Mar-2014 220 +6.3% 285 -5.6%
12-Month Avg 220 +2.5% 282 +6.0%
Historical Pending Sales by Month
A count of the properties on which offers have been accepted in a given month.
Current as of April 11, 2014. All data from the San Francisco MLS. Powered by 10K Research and Marketing. | Click for Cover Page | 5
230
278
207
302
220
285
Single Family Condo/TIC/Coop
March
0
100
200
300
400
1-2005 1-2006 1-2007 1-2008 1-2009 1-2010 1-2011 1-2012 1-2013 1-2014
Single Family Condo/TIC/Coop
590
660
514
693
520
720
Single Family Condo/TIC/Coop
Year to Date
2012 2013 2014
- 5.6%+ 8.6%+ 6.3%- 10.0% + 5.0%+ 1.2%- 12.9% + 3.9%
2012 2013 2014 2012 2013 2014 2012 2013 2014
+ 0.4% + 6.5% + 6.3%+ 9.4%
6. Sold Listings
Sold Listings
Single
Family
Year-Over-Year
Change
Condo/TIC/
Coop
Year-Over-Year
Change
Apr-2013 222 +0.5% 303 +2.7%
May-2013 251 +6.4% 380 +27.1%
Jun-2013 272 +1.5% 277 -18.5%
Jul-2013 278 +28.1% 341 +23.1%
Aug-2013 237 -1.7% 303 -6.2%
Sep-2013 188 +5.0% 229 +0.4%
Oct-2013 256 +0.4% 335 +21.8%
Nov-2013 240 -11.8% 283 +4.8%
Dec-2013 213 +1.9% 246 -2.0%
Jan-2014 130 -19.3% 177 +13.5%
Feb-2014 157 +21.7% 220 +12.8%
Mar-2014 171 -17.4% 257 -8.9%
12-Month Avg 218 +0.8% 279 +5.0%
Historical Sold Listings by Month
A count of the actual sales that closed in a given month.
Current as of April 11, 2014. All data from the San Francisco MLS. Powered by 10K Research and Marketing. | Click for Cover Page | 6
223
266
207
282
171
257
Single Family Condo/TIC/Coop
March
0
100
200
300
400
1-2005 1-2006 1-2007 1-2008 1-2009 1-2010 1-2011 1-2012 1-2013 1-2014
Single Family Condo/TIC/Coop
535
608
497
633
458
654
Single Family Condo/TIC/Coop
Year to Date
2012 2013 2014
- 8.9%+ 6.0%- 17.4%- 7.2% + 4.1%- 7.8%- 7.1% + 3.3%
2012 2013 2014 2012 2013 2014 2012 2013 2014
+ 3.7% + 7.0% + 5.4%+ 0.4%
7. Median Sales Price
Median Sales Price
Single
Family
Year-Over-Year
Change
Condo/TIC/
Coop
Year-Over-Year
Change
Apr-2013 $1,000,000 +31.6% $845,250 +19.9%
May-2013 $1,020,000 +31.1% $830,000 +18.6%
Jun-2013 $939,000 +20.4% $780,000 +9.5%
Jul-2013 $872,500 +13.6% $850,000 +23.2%
Aug-2013 $940,000 +22.9% $810,000 +11.7%
Sep-2013 $929,000 +28.1% $826,000 +6.4%
Oct-2013 $905,000 +9.0% $865,000 +13.8%
Nov-2013 $957,000 +18.1% $826,000 +6.6%
Dec-2013 $949,000 +13.7% $762,500 +9.1%
Jan-2014 $925,500 +24.2% $950,000 +24.6%
Feb-2014 $1,050,000 +31.2% $939,500 +25.3%
Mar-2014 $998,000 +8.5% $960,000 +16.7%
12-Month Avg* $945,000 +18.5% $845,000 +13.9%
Historical Median Sales Price by Month
Point at which half of the sales sold for more and half sold for less, not accounting for seller concessions, in a given month.
* Median Sales Price for all properties from April 2013 through March 2014. This is not the
average of the individual figures above.
Current as of April 11, 2014. All data from the San Francisco MLS. Powered by 10K Research and Marketing. | Click for Cover Page | 7
$713,250
$627,500
$920,000
$822,500
$998,000
$960,000
Single Family Condo/TIC/Coop
March
$500,000
$600,000
$700,000
$800,000
$900,000
$1,000,000
$1,100,000
1-2005 1-2006 1-2007 1-2008 1-2009 1-2010 1-2011 1-2012 1-2013 1-2014
Single Family Condo/TIC/Coop
$666,000
$626,250
$809,000
$785,000
$985,000
$950,000
Single Family Condo/TIC/Coop
Year to Date
2012 2013 2014
+ 16.7%+ 31.1%+ 8.5%+ 29.0% + 25.3%+ 21.8%+ 21.5% + 21.0%
2012 2013 2014 2012 2013 2014 2012 2013 2014
- 6.0% + 1.1% + 1.2%- 0.4%
8. Average Sales Price
Average Sales
Price
Single
Family
Year-Over-Year
Change
Condo/TIC/
Coop
Year-Over-Year
Change
Apr-2013 $1,362,627 +28.7% $975,623 +28.3%
May-2013 $1,494,344 +32.6% $980,113 +21.3%
Jun-2013 $1,195,239 +3.0% $930,338 +12.9%
Jul-2013 $1,281,445 +8.5% $1,018,542 +30.8%
Aug-2013 $1,304,100 +31.8% $929,734 +15.4%
Sep-2013 $1,235,064 +31.9% $941,430 +4.8%
Oct-2013 $1,347,949 +4.0% $1,009,812 +13.6%
Nov-2013 $1,323,997 +18.8% $980,320 +1.0%
Dec-2013 $1,348,164 -2.7% $1,020,083 +19.3%
Jan-2014 $1,247,342 +37.0% $1,121,761 +34.7%
Feb-2014 $1,462,472 +25.4% $998,629 +14.1%
Mar-2014 $1,446,238 +5.9% $1,064,808 +11.7%
12-Month Avg* $1,334,318 +16.4% $993,380 +16.7%
Historical Average Sales Price by Month
Average sales price for all closed sales, not accounting for seller concessions, in a given month.
* Average Sales Price for all properties from April 2013 through March 2014. This is not the
average of the individual figures above.
Current as of April 11, 2014. All data from the San Francisco MLS. Powered by 10K Research and Marketing. | Click for Cover Page | 8
$945,426
$739,335
$1,365,029
$953,615
$1,446,238
$1,064,808
Single Family Condo/TIC/Coop
March
$600,000
$800,000
$1,000,000
$1,200,000
$1,400,000
$1,600,000
1-2005 1-2006 1-2007 1-2008 1-2009 1-2010 1-2011 1-2012 1-2013 1-2014
Single Family Condo/TIC/Coop
$955,283
$731,865
$1,166,199
$899,564
$1,395,348
$1,057,862
Single Family Condo/TIC/Coop
Year to Date
2012 2013 2014
+ 11.7%+ 29.0%+ 5.9%+ 44.4% + 22.9%+ 19.6%+ 22.1% + 17.6%
2012 2013 2014 2012 2013 2014 2012 2013 2014
- 8.2% + 5.0% + 2.7%- 3.5%
9. Days on Market Until Sale
Days on Market
Single
Family
Year-Over-Year
Change
Condo/TIC/
Coop
Year-Over-Year
Change
Apr-2013 35 -35.2% 41 -41.4%
May-2013 32 -31.9% 36 -36.8%
Jun-2013 35 -40.7% 38 -33.3%
Jul-2013 33 -29.8% 39 -35.0%
Aug-2013 38 -22.4% 38 -29.6%
Sep-2013 31 -32.6% 37 -28.8%
Oct-2013 34 -24.4% 37 -32.7%
Nov-2013 34 -19.0% 41 -19.6%
Dec-2013 42 -12.5% 44 -27.9%
Jan-2014 41 -16.3% 51 -19.0%
Feb-2014 38 -7.3% 39 -20.4%
Mar-2014 33 -15.4% 32 -23.8%
12-Month Avg* 35 -26.1% 39 -30.0%
Historical Days on Market Until Sale by Month
Average number of days between when a property is listed and when an offer is accepted in a given month.
* Days on Market for all properties from April 2013 through March 2014. This is not the average of
the individual figures above.
Current as of April 11, 2014. All data from the San Francisco MLS. Powered by 10K Research and Marketing. | Click for Cover Page | 9
64
67
39
42
33 32
Single Family Condo/TIC/Coop
March
20
40
60
80
100
120
1-2005 1-2006 1-2007 1-2008 1-2009 1-2010 1-2011 1-2012 1-2013 1-2014
Single Family Condo/TIC/Coop
68
83
42
49
37
40
Single Family Condo/TIC/Coop
Year to Date
2012 2013 2014
- 23.8%- 37.3%- 15.4%- 39.1% - 41.0%- 11.9%- 38.2% - 18.4%
2012 2013 2014 2012 2013 2014 2012 2013 2014
- 3.0% - 5.6% - 2.4%- 9.5%
10. Inventory of Active Listings
Active Listings
Single
Family
Year-Over-Year
Change
Condo/TIC/
Coop
Year-Over-Year
Change
Apr-2013 443 -23.9% 661 -11.2%
May-2013 483 -12.5% 641 -15.2%
Jun-2013 466 -10.9% 655 -9.3%
Jul-2013 453 -10.8% 611 -8.9%
Aug-2013 462 -8.2% 588 -6.8%
Sep-2013 497 -16.9% 717 -4.7%
Oct-2013 487 -10.6% 634 -11.5%
Nov-2013 385 -12.9% 497 -17.4%
Dec-2013 259 -18.0% 323 -21.2%
Jan-2014 303 -9.8% 438 -12.6%
Feb-2014 308 -18.7% 452 -21.5%
Mar-2014 281 -30.4% 393 -36.1%
12-Month Avg* 402 -15.1% 551 -14.1%
Historical Inventory of Active Listings by Month
The number of properties available for sale in active status at the end of a given month.
* Active Listings for all properties from April 2013 through March 2014. This is not the average of
the individual figures above.
Current as of April 11, 2014. All data from the San Francisco MLS. Powered by 10K Research and Marketing. | Click for Cover Page | 10
588
762
404
615
281
393
Single Family Condo/TIC/Coop
March
200
400
600
800
1,000
1,200
1,400
1,600
1-2005 1-2006 1-2007 1-2008 1-2009 1-2010 1-2011 1-2012 1-2013 1-2014
Single Family Condo/TIC/Coop
2012 2013 2014
- 36.1%- 19.3%- 30.4%- 31.3%
2012 2013 2014
- 22.7% - 30.8%
11. % of Properties Sold Over List Price
% of Properties
Sold Over List Price
Single
Family
Year-Over-Year
Change
Condo/TIC/
Coop
Year-Over-Year
Change
Apr-2013 79.7% +29.6% 67.3% +77.1%
May-2013 78.1% +33.5% 67.6% +41.4%
Jun-2013 80.1% +24.0% 71.8% +49.0%
Jul-2013 78.1% +23.8% 73.3% +72.1%
Aug-2013 75.1% +13.8% 66.0% +45.1%
Sep-2013 78.7% +14.6% 68.6% +29.2%
Oct-2013 80.8% +23.4% 67.8% +11.7%
Nov-2013 77.5% +16.5% 62.5% +14.9%
Dec-2013 65.3% +5.8% 54.1% +17.1%
Jan-2014 64.6% +0.9% 43.8% +10.3%
Feb-2014 75.8% +4.3% 69.1% +25.9%
Mar-2014 77.8% +3.9% 73.2% +16.0%
12-Month Avg 76.5% +17.2% 66.3% +33.7%
Historical % of Properties Sold Over List Price by Month
Percentage found when dividing the number of properties sold by properties sold over its original list price, not accounting for seller
concessions.
* % of Properties Sold Over List Price for all properties from April 2013 through March 2014. This
is not the average of the individual figures above.
Current as of April 11, 2014. All data from the San Francisco MLS. Powered by 10K Research and Marketing. | Click for Cover Page | 11
46.4%
41.4%
74.9%
63.1%
77.8%
73.2%
Single Family Condo/TIC/Coop
March
0.0%
20.0%
40.0%
60.0%
80.0%
100.0%
1-2005 1-2006 1-2007 1-2008 1-2009 1-2010 1-2011 1-2012 1-2013 1-2014
Single Family Condo/TIC/Coop
40.8%
34.0%
70.8%
54.8%
73.4%
63.9%
Single Family Condo/TIC/Coop
Year to Date
2012 2013 2014
+ 16.0%+ 52.4%+ 3.9%+ 61.4% + 61.2%+ 3.7%+ 73.5% + 16.6%
2012 2013 2014 2012 2013 2014 2012 2013 2014
+ 14.6% + 15.9% + 51.1%+ 73.9%
12. % of List Price Received
% of List Price
Received
Single
Family
Year-Over-Year
Change
Condo/TIC/
Coop
Year-Over-Year
Change
Apr-2013 111.7% +7.8% 105.7% +4.9%
May-2013 111.4% +6.2% 105.9% +3.9%
Jun-2013 112.4% +7.3% 107.0% +5.5%
Jul-2013 109.6% +3.9% 106.8% +5.1%
Aug-2013 110.1% +4.1% 105.5% +3.4%
Sep-2013 109.8% +2.7% 105.8% +3.5%
Oct-2013 110.2% +4.8% 105.5% +1.8%
Nov-2013 108.7% +2.2% 105.0% +2.4%
Dec-2013 107.0% +2.3% 103.4% +1.8%
Jan-2014 107.6% +1.4% 103.0% +1.7%
Feb-2014 110.2% +1.7% 106.2% +2.3%
Mar-2014 112.1% +2.0% 108.6% +3.5%
12-Month Avg* 110.2% +4.1% 105.8% +3.4%
Historical % of List Price Received by Month
Percentage found when dividing a property’s sales price by its most recent list price, then taking the average for all properties sold in a given
month, not accounting for seller concessions.
* % of List Price Received for all properties from April 2013 through March 2014. This is not the
average of the individual figures above.
Current as of April 11, 2014. All data from the San Francisco MLS. Powered by 10K Research and Marketing. | Click for Cover Page | 12
101.8% 100.7%
109.9%
104.9%
112.1%
108.6%
Single Family Condo/TIC/Coop
March
100.8% 99.8%
108.3%
103.7%
110.1%
106.3%
Single Family Condo/TIC/Coop
Year to Date
95.0%
100.0%
105.0%
110.0%
115.0%
1-2005 1-2006 1-2007 1-2008 1-2009 1-2010 1-2011 1-2012 1-2013 1-2014
Single Family Condo/TIC/Coop
2012 2013 2014
+ 3.5%+ 4.2%+ 2.0%+ 8.0%
2012 2013 2014
+ 1.9% + 2.7%
2012 2013 2014
+ 2.5%+ 3.9%+ 1.7%+ 7.4%
2012 2013 2014
+ 1.5% + 1.9%
13. Housing Affordability Ratio
Affordability Ratio
Single
Family
Year-Over-Year
Change
Condo/TIC/
Coop
Year-Over-Year
Change
Apr-2013 54 -20.6% 63 -14.9%
May-2013 51 -25.0% 62 -17.3%
Jun-2013 52 -23.5% 62 -16.2%
Jul-2013 56 -20.0% 57 -26.9%
Aug-2013 51 -27.1% 59 -20.3%
Sep-2013 53 -29.3% 59 -16.9%
Oct-2013 54 -18.2% 56 -22.2%
Nov-2013 55 -19.1% 63 -11.3%
Dec-2013 52 -21.2% 64 -19.0%
Jan-2014 51 -29.2% 50 -28.6%
Feb-2014 46 -30.3% 51 -27.1%
Mar-2014 49 -14.0% 50 -21.9%
12-Month Avg* 52 -27.9% 68 -31.0%
Historical Housing Affordability Ratio by Month
This index measures housing affordability for the region. An index of 120 means the median household income is 120% of what is necessary to
qualify for the median-priced home under prevailing interest rates. A higher number means greater affordability.
* Affordability Ratio for all properties from April 2013 through March 2014. This is not the average
of the individual figures above.
Current as of April 11, 2014. All data from the San Francisco MLS. Powered by 10K Research and Marketing. | Click for Cover Page | 13
72
81
57
64
49 50
Single Family Condo/TIC/Coop
March
30
40
50
60
70
80
90
1-2005 1-2006 1-2007 1-2008 1-2009 1-2010 1-2011 1-2012 1-2013 1-2014
Single Family Condo/TIC/Coop
2012 2013 2014
- 21.9%- 21.0%- 14.0%- 20.8%
2012 2013 2014
+ 18.0% + 11.0%
76
81
65 67
49 51
Single Family Condo/TIC/Coop
Year to Date
2012 2013 2014
- 23.9%- 17.3%- 24.6%- 14.5%
2012 2013 2014
+ 8.6% + 9.5%
14. Months Supply of Inventory
Months Supply
Single
Family
Year-Over-Year
Change
Condo/TIC/
Coop
Year-Over-Year
Change
Apr-2013 2.1 -22.2% 2.5 -24.2%
May-2013 2.2 -15.4% 2.4 -27.3%
Jun-2013 2.1 -16.0% 2.5 -19.4%
Jul-2013 2.0 -16.7% 2.3 -17.9%
Aug-2013 2.1 -8.7% 2.2 -15.4%
Sep-2013 2.2 -21.4% 2.6 -13.3%
Oct-2013 2.2 -12.0% 2.3 -17.9%
Nov-2013 1.8 -10.0% 1.8 -21.7%
Dec-2013 1.2 -14.3% 1.2 -25.0%
Jan-2014 1.4 -6.7% 1.6 -15.8%
Feb-2014 1.4 -22.2% 1.6 -27.3%
Mar-2014 1.3 -31.6% 1.4 -39.1%
12-Month Avg* 1.8 -16.9% 2.0 -22.3%
Historical Months Supply of Inventory by Month
The inventory of homes for sale at the end of a given month, divided by the average monthly pending sales from the last 12 months.
* Months Supply for all properties from April 2013 through March 2014. This is not the average of
the individual figures above.
Current as of April 11, 2014. All data from the San Francisco MLS. Powered by 10K Research and Marketing. | Click for Cover Page | 14
2.8
3.5
1.9
2.3
1.3 1.4
Single Family Condo/TIC/Coop
March
0.0
2.0
4.0
6.0
8.0
10.0
1-2005 1-2006 1-2007 1-2008 1-2009 1-2010 1-2011 1-2012 1-2013 1-2014
Single Family Condo/TIC/Coop
2012 2013 2014
- 39.1%- 34.3%- 31.6%- 32.1%
2012 2013 2014
- 28.2% - 35.2%
15. All Properties Activity Overview
Key metrics by report month and for year-to-date (YTD) starting from the first of the year.
Key Metrics Historical Sparkbars 3-2013 3-2014 Percent Change YTD 2013 YTD 2014 Percent Change
Current as of April 11, 2014. All data from the San Francisco MLS. Powered by 10K Research and Marketing. | Click for Cover Page | 15
Months Supply 2.1 1.3 - 38.1% -- -- --
Affordability Ratio 47 40 - 14.9%
% of List Price Received 107.0% 110.0% + 2.8% 105.7%
52
67.8% + 9.7%
+ 2.1%
41 - 21.8%
107.9%
% of Properties Sold Over List Price 68.1% 75.0% + 10.1% 61.8%
Active Listings 1,019 674 - 33.9% --
Average Sales Price $1,127,772 $1,217,202 + 7.9% $1,016,704
Days on Market 40 32 - 20.0% 46
$960,000 + 20.0%
+ 17.7%
39 - 15.2%
$1,196,988
-- --
Sold Listings 489 428 - 12.5% 1,130 1,112 - 1.6%
Median Sales Price $865,000 $975,000 + 12.7% $800,000
- 10.3%
Pending Sales 509 505 - 0.8% 1,207 1,240 + 2.7%
New Listings 624 476 - 23.7% 1,665 1,493
3-2011 3-2012 3-2013 3-2014
3-2011 3-2012 3-2013 3-2014
3-2011 3-2012 3-2013 3-2014
3-2011 3-2012 3-2013 3-2014
3-2011 3-2012 3-2013 3-2014
3-2011 3-2012 3-2013 3-2014
3-2011 3-2012 3-2013 3-2014
3-2011 3-2012 3-2013 3-2014
3-2011 3-2012 3-2013 3-2014
3-2011 3-2012 3-2013 3-2014
3-2011 3-2012 3-2013 3-2014
16. Activity by District
SF District 1: Northwest (Sea Cliff, Lake, Jordan Park / Laurel Heights, Outer Richmond, Central Richmond, Inner Richmond, Lone Mountain)
SF District 2: Central West (Outer Sunset, Central Sunset, Inner Sunset, Outer Parkside, Parkside, Inner Parkside, Golden Gate Heights)
SF District 3: Southwest (Pine Lake Park, Lake Shore, Merced Manor, Stonestown, Lakeside, Merced Heights, Ingleside, Ingleside Heights, Oceanview)
SF District 4: Twin Peaks W (Forest Hill (& Ext), W Portal, St Francis Wd, Balboa Terr, Mt Dav Manor, Ingleside Terr, Monterey Hts, Wstwd Pk & H'lnds, Shrwd Fst, Miraloma Pk, Dmnd Hts, Mdtwn Terr)
SF District 5: Central (Haight Ashbury, Cole Vly / Prnssus Hts, Clarndn Hts, Corona Hts, Twin Pks, Glen Pk, Noe Vly, Eureka Vly / Dolores Hts, Mission Dolores, Duboce Trngl, Buena Vista / Ashbury Hts)
SF District 6: Central North (Lower Pacific Heights, Anza Vista, Western Addition, North Panhandle, Alamo Square, Hayes Valley)
SF District 7: North (Marina, Cow Hollow, Presidio Heights, Pacific Heights)
SF District 8: Northeast (North Waterfront, North Beach, Russian Hill, Telegraph Hill, Nob Hill, Financial District / Barbary Coast, Downtown, Van Ness / Civic Center, Tenderloin)
SF District 9: Central East (Yerba Buena, South Beach, South of Market, Mission Bay, Inner Mission, Potrero Hill, Central Waterfront / Dogpatch, Bernal Heights)
SF District 10: Southeast (Outer Mission, Mission Terr, Excelsior, Portola, Bayview, Silver Terr, Hunters Pt, Candlestick Pt, Bayview Hts, Little Hollywood, Visitation Vly, Crocker Amazon)
3-2013 3-2014 + / – 3-2013 3-2014 + / – 3-2013 3-2014 + / – 3-2013 3-2014 + / – 3-2013 3-2014 + / –
Single Family
1 SF District 1 41 23 -43.9% 17 13 -23.5% $1,260,000 $1,226,000 -2.7% 16 53 +238.6% 2.3 1.2 -45.9%
2 SF District 2 57 38 -33.3% 34 36 +5.9% $810,000 $952,500 +17.6% 59 34 -42.4% 1.7 0.9 -48.3%
3 SF District 3 31 23 -25.8% 4 11 +175.0% $559,000 $718,000 +28.4% 26 43 +63.1% 2.1 1.4 -35.3%
4 SF District 4 37 25 -32.4% 26 26 0.0% $1,011,500 $1,355,000 +34.0% 28 31 +9.2% 1.3 0.9 -26.8%
5 SF District 5 51 36 -29.4% 39 25 -35.9% $1,650,000 $2,505,000 +51.8% 38 16 -58.4% 1.6 1.2 -27.1%
6 SF District 6 9 4 -55.6% 3 0 -100.0% $2,200,000 $0 -100.0% 25 0 -100.0% 2.2 1.0 -54.5%
7 SF District 7 37 16 -56.8% 13 7 -46.2% $4,250,000 $4,500,000 +5.9% 55 19 -66.2% 3.8 1.4 -63.1%
8 SF District 8 10 6 -40.0% 2 1 -50.0% $2,900,000 $6,500,000 +124.1% 74 12 -83.7% 3.7 2.7 -27.3%
9 SF District 9 39 24 -38.5% 20 12 -40.0% $1,008,000 $1,220,000 +21.0% 28 33 +18.8% 1.9 1.1 -45.4%
10 SF District 10 92 86 -6.5% 49 40 -18.4% $552,000 $640,000 +15.9% 38 37 -4.3% 1.8 2.0 +10.2%
Condo/TIC/Coop
1 SF District 1 29 21 -27.6% 15 9 -40.0% $913,000 $1,100,000 +20.5% 45 32 -28.6% 2.1 1.8 -16.0%
2 SF District 2 17 4 -76.5% 3 2 -33.3% $600,000 $880,000 +46.7% 44 25 -42.7% 3.3 0.9 -73.8%
3 SF District 3 6 2 -66.7% 5 3 -40.0% $385,500 $475,000 +23.2% 14 48 +250.5% 1.9 0.7 -62.5%
4 SF District 4 13 11 -15.4% 6 4 -33.3% $524,750 $620,000 +18.2% 62 25 -60.6% 3.0 1.9 -35.3%
5 SF District 5 65 54 -16.9% 39 51 +30.8% $920,000 $1,059,000 +15.1% 32 33 +3.5% 1.7 1.3 -23.9%
6 SF District 6 56 31 -44.6% 37 29 -21.6% $727,000 $921,000 +26.7% 44 29 -35.6% 2.0 1.0 -49.5%
7 SF District 7 64 36 -43.8% 49 20 -59.2% $1,200,000 $1,215,000 +1.3% 54 23 -57.1% 2.1 1.2 -42.2%
8 SF District 8 124 82 -33.9% 37 55 +48.6% $1,010,000 $885,000 -12.4% 37 41 +9.7% 2.7 1.7 -36.6%
9 SF District 9 202 139 -31.2% 84 80 -4.8% $788,944 $950,000 +20.4% 39 30 -25.0% 2.3 1.4 -38.8%
10 SF District 10 39 13 -66.7% 7 4 -42.9% $401,000 $484,500 +20.8% 47 28 -40.6% 6.2 2.2 -63.8%
Key metrics by report month for the districts of San Fransisco.
Current as of April 11, 2014. All data from the San Francisco MLS. Powered by 10K Research and Marketing. | Click for Cover Page | 16
Active Listings Sold Listings Median Sales Price Days on Market Months Supply