San Francisco Market Focus February 2014
•
1 like•490 views

The document provides an overview of the San Francisco residential real estate market in February 2014. Key metrics showed that new listings were down 17.1% for single family homes and 18.4% for condos from the previous year. Pending sales increased 13.4% for single family homes and 11.5% for condos. Median sales prices rose sharply, increasing 35.7% for single family homes to $1,086,500 and 24.9% for condos to $937,000. Months of inventory decreased significantly. The report concludes that while some volatility is expected, the spring market is anticipated to be strong.

Recommended
Recommended
More Related Content
What's hot
What's hot (20)
Similar to San Francisco Market Focus February 2014
Similar to San Francisco Market Focus February 2014 (20)
More from Ronny Budiutama
More from Ronny Budiutama (20)
Recently uploaded
Recently uploaded (20)
San Francisco Market Focus February 2014
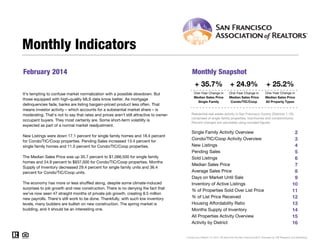
- 1. February 2014 Monthly Snapshot One-Year Change in One-Year Change in Median Sales Price Single Family Median Sales Price Condo/TIC/Coop 2 Monthly Indicators + 35.7% + 24.9% + 25.2% One-Year Change inIt's tempting to confuse market normalization with a possible slowdown. But those equipped with high-quality MLS data know better. As mortgage delinquencies fade, banks are listing bargain-priced product less often. That means investor activity – which accounts for a substantial market share – is moderating. That's not to say that rates and prices aren't still attractive to owner- occupant buyers. They most certainly are. Some short-term volatility is expected as part of a normal market readjustment. Median Sales Price All Property Types Residential real estate activity in San Francisco County (Districts 1-10), comprised of single-family properties, townhomes and condominiums. Percent changes are calculated using rounded figures. Single Family Activity Overview 2 3 4 5 6 7 8 9 10 11 12 13 14 15 16 Current as of March 13, 2014. All data from the San Francisco MLS. Powered by 10K Research and Marketing. Condo/TIC/Coop Activity Overview Inventory of Active Listings % of Properties Sold Over List Price % of List Price Received Housing Affordability Ratio All Properties Activity Overview New Listings Pending Sales Sold Listings Median Sales Price Average Sales Price Days on Market Until Sale Activity by District New Listings were down 17.1 percent for single family homes and 18.4 percent for Condo/TIC/Coop properties. Pending Sales increased 13.4 percent for single family homes and 11.5 percent for Condo/TIC/Coop properties. The Median Sales Price was up 35.7 percent to $1,086,500 for single family homes and 24.9 percent to $937,000 for Condo/TIC/Coop properties. Months Supply of Inventory decreased 29.4 percent for single family units and 36.4 percent for Condo/TIC/Coop units. The economy has more or less shuffled along, despite some climate-induced surprises to job growth and new construction. There is no denying the fact that we've now seen 47 straight months of private job growth, creating 8.5 million new payrolls. There's still work to be done. Thankfully, with such low inventory levels, many builders are bullish on new construction. The spring market is budding, and it should be an interesting one. Single Family Activity Overview Months Supply of Inventory
- 2. Single Family Activity Overview Key metrics by report month and for year-to-date (YTD) starting from the first of the year. Key Metrics Historical Sparkbars 2-2013 2-2014 Percent Change YTD 2013 YTD 2014 Percent Change - 8.9%378 280 - 3.4% $981,500 + 29.1% + 34.4% Pending Sales 149 169 + 13.4% - 0.7%307 305 New Listings 211 175 - 17.1% 415 Sold Listings 129 152 + 17.8% 290 Median Sales Price $800,500 $1,086,500 + 35.7% $760,000 $1,376,066Average Sales Price $1,166,453 $1,476,888 + 26.6% $1,023,784 2-2011 2-2012 2-2013 2-2014 2-2011 2-2012 2-2013 2-2014 2-2011 2-2012 2-2013 2-2014 2-2011 2-2012 2-2013 2-2014 39 - 13.3% -- -- Days on Market 41 38 - 7.3% 45 Active Listings 378 274 - 27.5% -- % of Properties Sold Over List Price 72.7% 75.7% + 4.1% 67.8% 69 70.4% + 3.8% + 1.9% 49 - 29.0% 109.1%% of List Price Received 108.4% 110.4% + 1.8% 107.1% Current as of March 13, 2014. All data from the San Francisco MLS. Powered by 10K Research and Marketing. | Click for Cover Page | 2 Months Supply 1.7 1.2 - 29.4% -- -- -- Affordability Ratio 66 45 - 31.8% 2-2011 2-2012 2-2013 2-2014 2-2011 2-2012 2-2013 2-2014 2-2011 2-2012 2-2013 2-2014 2-2011 2-2012 2-2013 2-2014 2-2011 2-2012 2-2013 2-2014 2-2011 2-2012 2-2013 2-2014 2-2011 2-2012 2-2013 2-2014
- 3. Condo/TIC/Coop Activity Overview Key metrics by report month and for year-to-date (YTD) starting from the first of the year. Key Metrics Historical Sparkbars 2-2013 2-2014 Percent Change YTD 2013 YTD 2014 Percent Change - 8.3% Pending Sales 217 242 + 11.5% 391 424 + 8.4% New Listings 316 258 - 18.4% 625 573 Sold Listings 195 216 + 10.8% 351 391 + 11.4% Median Sales Price $750,000 $937,000 + 24.9% $760,000 $942,500 + 24.0% + 22.0%$1,044,576Average Sales Price $874,966 $982,562 + 12.3% $856,138 2-2011 2-2012 2-2013 2-2014 2-2011 2-2012 2-2013 2-2014 2-2011 2-2012 2-2013 2-2014 2-2011 2-2012 2-2013 2-2014 45 - 18.2% -- -- Days on Market 49 40 - 18.4% 55 Active Listings 575 398 - 30.8% -- % of Properties Sold Over List Price 54.9% 69.4% + 26.4% 48.1% 69 58.2% + 21.0% + 2.0% 51 - 26.1% 104.8%% of List Price Received 103.8% 106.3% + 2.4% 102.7% Current as of March 13, 2014. All data from the San Francisco MLS. Powered by 10K Research and Marketing. | Click for Cover Page | 3 Months Supply 2.2 1.4 - 36.4% -- -- -- Affordability Ratio 70 51 - 27.1% 2-2011 2-2012 2-2013 2-2014 2-2011 2-2012 2-2013 2-2014 2-2011 2-2012 2-2013 2-2014 2-2011 2-2012 2-2013 2-2014 2-2011 2-2012 2-2013 2-2014 2-2011 2-2012 2-2013 2-2014 2-2011 2-2012 2-2013 2-2014
- 4. New Listings New Listings Single Family Year-Over-Year Change Condo/TIC/ Coop Year-Over-Year Change Mar-2013 254 -12.4% 369 +12.5% Apr-2013 302 +15.3% 396 +15.1% May-2013 339 +30.9% 384 +2.7% Jun-2013 293 +13.1% 358 +7.2% Jul-2013 259 +1.6% 332 +23.4% Aug-2013 272 +7.1% 339 +8.3% Sep-2013 296 -6.6% 448 +15.8% Oct-2013 277 -3.5% 319 +4.6% Nov-2013 168 -7.2% 188 -10.9% Dec-2013 109 +6.9% 111 -2.6% Jan-2014 203 -0.5% 315 +1.9% Feb-2014 175 -17.1% 258 -18.4% 12-Month Avg 246 +2.3% 318 +5.9% A count of the properties that have been newly listed on the market in a given month. 258 307 211 316 175 258 February 506 611 415 625 378 573 Year to Date 2012 2013 2014 - 18 4%+ 2 9%17 1%18 2% + 2 3%8 9%18 0% 8 3% 2012 2013 2014 2012 2013 2014 2012 2013 2014 9 8% 9 6% 20 5%- 16 1% 12 Month Avg 246 +2.3% 318 +5.9% Historical New Listings by Month Current as of March 13, 2014. All data from the San Francisco MLS. Powered by 10K Research and Marketing. | Click for Cover Page | 4 Single Family Condo/TIC/Coop 0 100 200 300 400 500 600 700 1-2005 1-2006 1-2007 1-2008 1-2009 1-2010 1-2011 1-2012 1-2013 1-2014 Single Family Condo/TIC/Coop Single Family Condo/TIC/Coop 2012 2013 2014 - 18.4%+ 2.9%- 17.1%- 18.2% + 2.3%- 8.9%- 18.0% - 8.3% 2012 2013 2014 2012 2013 2014 2012 2013 2014 - 9.8% - 9.6% - 20.5%- 16.1%
- 5. Pending Sales Pending Sales Single Family Year-Over-Year Change Condo/TIC/ Coop Year-Over-Year Change Mar-2013 207 -10.0% 302 +8.6% Apr-2013 242 +3.0% 309 -3.4% May-2013 269 +10.2% 360 +13.9% Jun-2013 277 +16.9% 290 -7.6% Jul-2013 250 +10.6% 332 +16.1% Aug-2013 230 +1.8% 302 +4.5% Sep-2013 211 +14.7% 254 +16.5% Oct-2013 245 -14.6% 340 +22.7% Nov-2013 222 -11.9% 271 0.0% Dec-2013 174 +2.4% 201 -1.0% Jan-2014 136 -13.9% 182 +4.6% Feb-2014 169 +13.4% 242 +11.5% 12-Month Avg 219 +1.3% 282 +7.0% A count of the properties on which offers have been accepted in a given month. 190 219 149 217 169 242 February 360 382 307 391 305 424 Year to Date 2012 2013 2014 + 11 5%- 0 9%+ 13 4%21 6% + 2 4%0 7%14 7% + 8 4% 2012 2013 2014 2012 2013 2014 2012 2013 2014 + 7 3% + 10 8% + 4 1%+ 5 3% 12 Month Avg 219 +1.3% 282 +7.0% Historical Pending Sales by Month Current as of March 13, 2014. All data from the San Francisco MLS. Powered by 10K Research and Marketing. | Click for Cover Page | 5 Single Family Condo/TIC/Coop 0 100 200 300 400 1-2005 1-2006 1-2007 1-2008 1-2009 1-2010 1-2011 1-2012 1-2013 1-2014 Single Family Condo/TIC/Coop Single Family Condo/TIC/Coop 2012 2013 2014 + 11.5%- 0.9%+ 13.4%- 21.6% + 2.4%- 0.7%- 14.7% + 8.4% 2012 2013 2014 2012 2013 2014 2012 2013 2014 + 7.3% + 10.8% + 4.1%+ 5.3%
- 6. Sold Listings Sold Listings Single Family Year-Over-Year Change Condo/TIC/ Coop Year-Over-Year Change Mar-2013 207 -7.2% 282 +6.0% Apr-2013 222 +0.5% 303 +2.7% May-2013 251 +6.4% 380 +27.1% Jun-2013 271 +1.1% 277 -18.5% Jul-2013 278 +28.1% 341 +23.6% Aug-2013 237 -1.7% 302 -6.5% Sep-2013 187 +4.5% 229 +0.4% Oct-2013 256 +0.4% 335 +21.8% Nov-2013 240 -11.8% 282 +4.4% Dec-2013 210 +0.5% 246 -2.0% Jan-2014 128 -20.5% 175 +12.2% Feb-2014 152 +17.8% 216 +10.8% 12-Month Avg 220 +1.1% 281 +6.1% A count of the actual sales that closed in a given month. 182 181 129 195 152 216 February 312 342 290 351 280 391 Year to Date 2012 2013 2014 + 10 8%+ 7 7%+ 17 8%29 1% + 2 6%3 4%7 1% + 11 4% 2012 2013 2014 2012 2013 2014 2012 2013 2014 + 46 8% + 9 5% + 9 6%+ 5 8% 12 Month Avg 220 +1.1% 281 +6.1% Historical Sold Listings by Month Current as of March 13, 2014. All data from the San Francisco MLS. Powered by 10K Research and Marketing. | Click for Cover Page | 6 Single Family Condo/TIC/Coop 0 100 200 300 400 1-2005 1-2006 1-2007 1-2008 1-2009 1-2010 1-2011 1-2012 1-2013 1-2014 Single Family Condo/TIC/Coop Single Family Condo/TIC/Coop 2012 2013 2014 + 10.8%+ 7.7%+ 17.8%- 29.1% + 2.6%- 3.4%- 7.1% + 11.4% 2012 2013 2014 2012 2013 2014 2012 2013 2014 + 46.8% + 9.5% + 9.6%+ 5.8%
- 7. Median Sales Price Median Sales Price Single Family Year-Over-Year Change Condo/TIC/ Coop Year-Over-Year Change Mar-2013 $920,000 +29.0% $822,500 +31.1% Apr-2013 $1,000,000 +31.6% $845,250 +19.9% May-2013 $1,020,000 +31.1% $830,000 +18.6% Jun-2013 $940,000 +20.5% $780,000 +9.5% Jul-2013 $872,500 +13.6% $850,000 +23.2% Aug-2013 $940,000 +22.9% $810,000 +11.7% Sep-2013 $930,000 +28.3% $826,000 +6.4% Oct-2013 $905,000 +9.0% $865,000 +13.8% Nov-2013 $957,000 +18.1% $828,000 +6.8% Dec-2013 $949,000 +13.7% $762,500 +9.1% Jan-2014 $927,000 +24.4% $950,000 +24.6% Feb-2014 $1,086,500 +35.7% $937,000 +24.9% 12-Month Avg* $939,000 +21.0% $830,000 +14.5% Point at which half of the sales sold for more and half sold for less, not accounting for seller concessions, in a given month. $635,000 $649,000 $800,500 $750,000 $1,086,500 $937,000 February $635,000 $626,250 $760,000 $760,000 $981,500 $942,500 Year to Date 2012 2013 2014 + 24 9%+ 15 6%+ 35 7%+ 26 1% + 21 4%+ 29 1%+ 19 7% + 24 0% 2012 2013 2014 2012 2013 2014 2012 2013 2014 + 2 3% + 3 3% + 5 7%+ 15 5% 12 Month Avg $939,000 +21.0% $830,000 +14.5% Historical Median Sales Price by Month * Median Sales Price for all properties from March 2013 through February 2014. This is not the average of the individual figures above. Current as of March 13, 2014. All data from the San Francisco MLS. Powered by 10K Research and Marketing. | Click for Cover Page | 7 Single Family Condo/TIC/Coop $500,000 $600,000 $700,000 $800,000 $900,000 $1,000,000 $1,100,000 1-2005 1-2006 1-2007 1-2008 1-2009 1-2010 1-2011 1-2012 1-2013 1-2014 Single Family Condo/TIC/Coop Single Family Condo/TIC/Coop 2012 2013 2014 + 24.9%+ 15.6%+ 35.7%+ 26.1% + 21.4%+ 29.1%+ 19.7% + 24.0% 2012 2013 2014 2012 2013 2014 2012 2013 2014 + 2.3% + 3.3% + 5.7%+ 15.5%
- 8. Average Sales Price Average Sales Price Single Family Year-Over-Year Change Condo/TIC/ Coop Year-Over-Year Change Mar-2013 $1,365,029 +44.4% $953,615 +29.0% Apr-2013 $1,362,627 +28.7% $975,623 +28.3% May-2013 $1,494,344 +32.6% $980,113 +21.3% Jun-2013 $1,198,063 +3.3% $930,338 +12.9% Jul-2013 $1,281,445 +8.5% $1,018,542 +30.7% Aug-2013 $1,304,100 +31.8% $929,239 +15.3% Sep-2013 $1,236,936 +32.1% $941,430 +4.8% Oct-2013 $1,347,949 +4.0% $1,009,812 +13.6% Nov-2013 $1,323,997 +18.8% $980,924 +1.1% Dec-2013 $1,350,543 -2.5% $1,020,083 +19.3% Jan-2014 $1,256,340 +38.0% $1,121,558 +34.7% Feb-2014 $1,476,888 +26.6% $982,562 +12.3% 12-Month Avg* $1,331,250 +19.7% $983,502 +18.0% Average sales price for all closed sales, not accounting for seller concessions, in a given month. $1,086,135 $739,474 $1,166,453 $874,966 $1,476,888 $982,562 February $962,297 $726,055 $1,023,784 $856,138 $1,376,066 $1,044,576 Year to Date 2012 2013 2014 + 12 3%+ 18 3%+ 26 6%+ 7 4% + 17 9%+ 34 4%+ 6 4% + 22 0% 2012 2013 2014 2012 2013 2014 2012 2013 2014 + 37 7% + 17 4% + 8 8%+ 11 5% 12 Month Avg $1,331,250 +19.7% $983,502 +18.0% Historical Average Sales Price by Month * Average Sales Price for all properties from March 2013 through February 2014. This is not the average of the individual figures above. Current as of March 13, 2014. All data from the San Francisco MLS. Powered by 10K Research and Marketing. | Click for Cover Page | 8 Single Family Condo/TIC/Coop $600,000 $800,000 $1,000,000 $1,200,000 $1,400,000 $1,600,000 1-2005 1-2006 1-2007 1-2008 1-2009 1-2010 1-2011 1-2012 1-2013 1-2014 Single Family Condo/TIC/Coop Single Family Condo/TIC/Coop 2012 2013 2014 + 12.3%+ 18.3%+ 26.6%+ 7.4% + 17.9%+ 34.4%+ 6.4% + 22.0% 2012 2013 2014 2012 2013 2014 2012 2013 2014 + 37.7% + 17.4% + 8.8%+ 11.5%
- 9. Days on Market Until Sale Days on Market Single Family Year-Over-Year Change Condo/TIC/ Coop Year-Over-Year Change Mar-2013 39 -39.1% 42 -37.3% Apr-2013 35 -35.2% 41 -41.4% May-2013 32 -31.9% 36 -36.8% Jun-2013 35 -40.7% 38 -33.3% Jul-2013 33 -29.8% 39 -33.9% Aug-2013 38 -22.4% 38 -29.6% Sep-2013 31 -32.6% 37 -28.8% Oct-2013 34 -24.4% 37 -32.7% Nov-2013 34 -19.0% 41 -19.6% Dec-2013 42 -12.5% 44 -27.9% Jan-2014 41 -16.3% 51 -19.0% Feb-2014 38 -7.3% 40 -18.4% 12-Month Avg* 35 -28.5% 40 -31.3% Average number of days between when a property is listed and when an offer is accepted in a given month. 63 94 41 49 38 40 February 70 95 45 55 39 45 Year to Date 2012 2013 2014 18 4%- 47 9%7 3%34 9% 42 1%13 3%35 7% 18 2% 2012 2013 2014 2012 2013 2014 2012 2013 2014 24 1% 7 9% + 1 1%+ 9 3% 12 Month Avg 35 28.5% 40 31.3% Historical Days on Market Until Sale by Month * Days on Market for all properties from March 2013 through February 2014. This is not the average of the individual figures above. Current as of March 13, 2014. All data from the San Francisco MLS. Powered by 10K Research and Marketing. | Click for Cover Page | 9 Single Family Condo/TIC/Coop 20 40 60 80 100 120 1-2005 1-2006 1-2007 1-2008 1-2009 1-2010 1-2011 1-2012 1-2013 1-2014 Single Family Condo/TIC/Coop Single Family Condo/TIC/Coop 2012 2013 2014 - 18.4%- 47.9%- 7.3%- 34.9% - 42.1%- 13.3%- 35.7% - 18.2% 2012 2013 2014 2012 2013 2014 2012 2013 2014 - 24.1% - 7.9% + 1.1%+ 9.3%
- 10. Inventory of Active Listings Active Listings Single Family Year-Over-Year Change Condo/TIC/ Coop Year-Over-Year Change Mar-2013 403 -31.5% 613 -19.6% Apr-2013 441 -24.2% 659 -11.4% May-2013 481 -12.9% 639 -15.5% Jun-2013 465 -11.1% 653 -9.6% Jul-2013 452 -11.0% 606 -9.7% Aug-2013 461 -8.3% 581 -7.9% Sep-2013 496 -17.1% 710 -5.6% Oct-2013 485 -11.0% 627 -12.4% Nov-2013 381 -13.6% 486 -19.3% Dec-2013 251 -20.3% 308 -24.9% Jan-2014 292 -12.8% 411 -17.8% Feb-2014 274 -27.5% 398 -30.8% 12-Month Avg* 407 -16.8% 558 -14.7% The number of properties available for sale in active status at the end of a given month. 568 777 378 575 274 398 February 2012 2013 2014 30 8%26 0%27 5%33 5% 2012 2013 2014 20 0% 26 3% 12 Month Avg 407 16.8% 558 14.7% Historical Inventory of Active Listings by Month * Active Listings for all properties from March 2013 through February 2014. This is not the average of the individual figures above. Current as of March 13, 2014. All data from the San Francisco MLS. Powered by 10K Research and Marketing. | Click for Cover Page | 10 Single Family Condo/TIC/Coop 200 400 600 800 1,000 1,200 1,400 1,600 1-2005 1-2006 1-2007 1-2008 1-2009 1-2010 1-2011 1-2012 1-2013 1-2014 Single Family Condo/TIC/Coop 2012 2013 2014 - 30.8%- 26.0%- 27.5%- 33.5% 2012 2013 2014 - 20.0% - 26.3%
- 11. % of Properties Sold Over List Price % of Properties Sold Over List Price Single Family Year-Over-Year Change Condo/TIC/ Coop Year-Over-Year Change Mar-2013 74.9% +61.4% 63.1% +52.4% Apr-2013 79.7% +29.6% 67.3% +77.1% May-2013 78.1% +33.5% 67.6% +41.4% Jun-2013 80.4% +24.5% 71.8% +49.0% Jul-2013 78.1% +23.8% 73.3% +71.3% Aug-2013 75.1% +13.8% 66.2% +45.5% Sep-2013 79.1% +15.1% 68.6% +29.2% Oct-2013 80.8% +23.4% 67.8% +11.7% Nov-2013 77.5% +16.5% 62.4% +14.7% Dec-2013 65.7% +6.5% 54.1% +17.1% Jan-2014 64.1% +0.2% 44.3% +11.6% Feb-2014 75.7% +4.1% 69.4% +26.4% 12-Month Avg 76.4% +21.4% 65.6% +37.5% Percentage found when dividing the number of properties sold by properties sold over its original list price, not accounting for seller concessions. 40.7% 32.0% 72.7% 54.9% 75.7% 69.4% February 36.9% 28.4% 67.8% 48.1% 70.4% 58.2% Year to Date 2012 2013 2014 + 26 4%+ 71 6%+ 4 1%+ 78 6% + 69 4%+ 3 8%+ 83 7% + 21 0% 2012 2013 2014 2012 2013 2014 2012 2013 2014 + 29 2% + 18 3% + 32 1%+ 33 3% 12 Month Avg 76.4% +21.4% 65.6% +37.5% Historical % of Properties Sold Over List Price by Month * % of Properties Sold Over List Price for all properties from March 2013 through February 2014. This is not the average of the individual figures above. Current as of March 13, 2014. All data from the San Francisco MLS. Powered by 10K Research and Marketing. | Click for Cover Page | 11 Single Family Condo/TIC/Coop 0.0% 20.0% 40.0% 60.0% 80.0% 100.0% 1-2005 1-2006 1-2007 1-2008 1-2009 1-2010 1-2011 1-2012 1-2013 1-2014 Single Family Condo/TIC/Coop Single Family Condo/TIC/Coop 2012 2013 2014 + 26.4%+ 71.6%+ 4.1%+ 78.6% + 69.4%+ 3.8%+ 83.7% + 21.0% 2012 2013 2014 2012 2013 2014 2012 2013 2014 + 29.2% + 18.3% + 32.1%+ 33.3%
- 12. % of List Price Received % of List Price Received Single Family Year-Over-Year Change Condo/TIC/ Coop Year-Over-Year Change Mar-2013 109.9% +8.0% 104.9% +4.2% Apr-2013 111.7% +7.8% 105.7% +4.9% May-2013 111.4% +6.2% 105.9% +3.9% Jun-2013 112.4% +7.3% 107.0% +5.5% Jul-2013 109.6% +3.9% 106.8% +5.1% Aug-2013 110.1% +4.1% 105.5% +3.4% Sep-2013 109.9% +2.8% 105.8% +3.5% Oct-2013 110.2% +4.8% 105.5% +1.8% Nov-2013 108.7% +2.2% 105.1% +2.5% Dec-2013 107.0% +2.3% 103.4% +1.8% Jan-2014 107.5% +1.3% 103.0% +1.7% Feb-2014 110.4% +1.8% 106.3% +2.4% 12-Month Avg* 110.1% +4.6% 105.5% +3.5% Percentage found when dividing a property’s sales price by its most recent list price, then taking the average for all properties sold in a given month, not accounting for seller concessions. 100.4% 99.5% 108.4% 103.8% 110.4% 106.3% February 100.0% 99.1% 107.1% 102.7% 109.1% 104.8% Year to Date 2012 2013 2014 2 4%4 3%1 8%8 0% 2012 2013 2014 1 4% 1 8% 2012 2013 2014 + 2 0%3 6%1 9%7 1% 2012 2013 2014 1 2% 1 4% 12 Month Avg 110.1% +4.6% 105.5% +3.5% Historical % of List Price Received by Month * % of List Price Received for all properties from March 2013 through February 2014. This is not the average of the individual figures above. Current as of March 13, 2014. All data from the San Francisco MLS. Powered by 10K Research and Marketing. | Click for Cover Page | 12 Single Family Condo/TIC/Coop Single Family Condo/TIC/Coop 95.0% 100.0% 105.0% 110.0% 115.0% 1-2005 1-2006 1-2007 1-2008 1-2009 1-2010 1-2011 1-2012 1-2013 1-2014 Single Family Condo/TIC/Coop 2012 2013 2014 + 2.4%+ 4.3%+ 1.8%+ 8.0% 2012 2013 2014 + 1.4% + 1.8% 2012 2013 2014 + 2.0%+ 3.6%+ 1.9%+ 7.1% 2012 2013 2014 + 1.2% + 1.4%
- 13. Housing Affordability Ratio Affordability Ratio Single Family Year-Over-Year Change Condo/TIC/ Coop Year-Over-Year Change Mar-2013 57 -20.8% 64 -21.0% Apr-2013 54 -20.6% 63 -14.9% May-2013 51 -25.0% 62 -17.3% Jun-2013 52 -23.5% 62 -16.2% Jul-2013 56 -20.0% 57 -26.9% Aug-2013 51 -27.1% 59 -20.3% Sep-2013 53 -29.3% 59 -16.9% Oct-2013 54 -18.2% 56 -22.2% Nov-2013 55 -19.1% 63 -11.3% Dec-2013 52 -21.2% 64 -19.0% Jan-2014 51 -29.2% 50 -28.6% Feb-2014 45 -31.8% 51 -27.1% 12-Month Avg* 52 -34.9% 69 -31.0% This index measures housing affordability for the region. An index of 120 means the median household income is 120% of what is necessary to qualify for the median-priced home under prevailing interest rates. A higher number means greater affordability. 81 79 66 70 45 51 February 2012 2013 2014 27 1%11 4%31 8%18 5% 2012 2013 2014 11 0% 2 5% 81 82 69 69 49 51 Year to Date 2012 2013 2014 26 1%15 9%29 0%14 8% 2012 2013 2014 9 5% + 6 5% 12 Month Avg 52 34.9% 69 31.0% Historical Housing Affordability Ratio by Month * Affordability Ratio for all properties from March 2013 through February 2014. This is not the average of the individual figures above. Current as of March 13, 2014. All data from the San Francisco MLS. Powered by 10K Research and Marketing. | Click for Cover Page | 13 Single Family Condo/TIC/Coop 30 40 50 60 70 80 90 1-2005 1-2006 1-2007 1-2008 1-2009 1-2010 1-2011 1-2012 1-2013 1-2014 Single Family Condo/TIC/Coop 2012 2013 2014 - 27.1%- 11.4%- 31.8%- 18.5% 2012 2013 2014 + 11.0% - 2.5% Single Family Condo/TIC/Coop 2012 2013 2014 - 26.1%- 15.9%- 29.0%- 14.8% 2012 2013 2014 + 9.5% + 6.5%
- 14. Months Supply of Inventory Months Supply Single Family Year-Over-Year Change Condo/TIC/ Coop Year-Over-Year Change Mar-2013 1.9 -32.1% 2.3 -34.3% Apr-2013 2.0 -25.9% 2.5 -24.2% May-2013 2.2 -15.4% 2.4 -27.3% Jun-2013 2.1 -16.0% 2.5 -19.4% Jul-2013 2.0 -16.7% 2.2 -21.4% Aug-2013 2.1 -8.7% 2.1 -19.2% Sep-2013 2.2 -21.4% 2.6 -13.3% Oct-2013 2.2 -12.0% 2.2 -21.4% Nov-2013 1.7 -15.0% 1.7 -26.1% Dec-2013 1.1 -21.4% 1.1 -31.3% Jan-2014 1.3 -13.3% 1.5 -21.1% Feb-2014 1.2 -29.4% 1.4 -36.4% 12-Month Avg* 1.9 -18.6% 2.0 -23.8% The inventory of homes for sale at the end of a given month, divided by the average monthly pending sales from the last 12 months. 2.7 3.6 1.7 2.2 1.2 1.4 February 2012 2013 2014 36 4%38 9%29 4%37 0% 2012 2013 2014 25 0% 30 8% 12 Month Avg 1.9 18.6% 2.0 23.8% Historical Months Supply of Inventory by Month * Months Supply for all properties from March 2013 through February 2014. This is not the average of the individual figures above. Current as of March 13, 2014. All data from the San Francisco MLS. Powered by 10K Research and Marketing. | Click for Cover Page | 14 Single Family Condo/TIC/Coop 0.0 2.0 4.0 6.0 8.0 10.0 1-2005 1-2006 1-2007 1-2008 1-2009 1-2010 1-2011 1-2012 1-2013 1-2014 Single Family Condo/TIC/Coop 2012 2013 2014 - 36.4%- 38.9%- 29.4%- 37.0% 2012 2013 2014 - 25.0% - 30.8%
- 15. All Properties Activity Overview Key metrics by report month and for year-to-date (YTD) starting from the first of the year. Key Metrics Historical Sparkbars 2-2013 2-2014 Percent Change YTD 2013 YTD 2014 Percent Change - 8.6% Pending Sales 366 411 + 12.3% 698 729 + 4.4% New Listings 527 433 - 17.8% 1,040 951 Sold Listings 324 368 + 13.6% 641 671 + 4.7% Median Sales Price $779,000 $975,000 + 25.2% $760,000 $951,000 + 25.1% + 27.0%$1,183,109Average Sales Price $990,478 $1,186,740 + 19.8% $931,841 2-2011 2-2012 2-2013 2-2014 2-2011 2-2012 2-2013 2-2014 2-2011 2-2012 2-2013 2-2014 2-2011 2-2012 2-2013 2-2014 43 - 15.7% -- -- Days on Market 46 39 - 15.2% 51 Active Listings 953 672 - 29.5% -- % of Properties Sold Over List Price 61.9% 72.0% + 16.3% 57.0% 57 63.3% + 11.1% + 1.8% 41 - 27.6% 106.6%% of List Price Received 105.6% 108.0% + 2.3% 104.7% Current as of March 13, 2014. All data from the San Francisco MLS. Powered by 10K Research and Marketing. | Click for Cover Page | 15 Months Supply 2.0 1.3 - 35.0% -- -- -- Affordability Ratio 54 41 - 23.5% 2-2011 2-2012 2-2013 2-2014 2-2011 2-2012 2-2013 2-2014 2-2011 2-2012 2-2013 2-2014 2-2011 2-2012 2-2013 2-2014 2-2011 2-2012 2-2013 2-2014 2-2011 2-2012 2-2013 2-2014 2-2011 2-2012 2-2013 2-2014
- 16. Activity by District SF District 1: Northwest (Sea Cliff, Lake, Jordan Park / Laurel Heights, Outer Richmond, Central Richmond, Inner Richmond, Lone Mountain) SF District 2: Central West (Outer Sunset, Central Sunset, Inner Sunset, Outer Parkside, Parkside, Inner Parkside, Golden Gate Heights) SF District 3: Southwest (Pine Lake Park, Lake Shore, Merced Manor, Stonestown, Lakeside, Merced Heights, Ingleside, Ingleside Heights, Oceanview) SF District 4: Twin Peaks W (Forest Hill (& Ext), W Portal, St Francis Wd, Balboa Terr, Mt Dav Manor, Ingleside Terr, Monterey Hts, Wstwd Pk & H'lnds, Shrwd Fst, Miraloma Pk, Dmnd Hts, Mdtwn Terr) SF District 5: Central (Haight Ashbury, Cole Vly / Prnssus Hts, Clarndn Hts, Corona Hts, Twin Pks, Glen Pk, Noe Vly, Eureka Vly / Dolores Hts, Mission Dolores, Duboce Trngl, Buena Vista / Ashbury Hts) SF District 6: Central North (Lower Pacific Heights, Anza Vista, Western Addition, North Panhandle, Alamo Square, Hayes Valley) SF District 7: North (Marina, Cow Hollow, Presidio Heights, Pacific Heights) SF District 8: Northeast (North Waterfront, North Beach, Russian Hill, Telegraph Hill, Nob Hill, Financial District / Barbary Coast, Downtown, Van Ness / Civic Center, Tenderloin) SF District 9: Central East (Yerba Buena, South Beach, South of Market, Mission Bay, Inner Mission, Potrero Hill, Central Waterfront / Dogpatch, Bernal Heights) SF District 10: Southeast (Outer Mission, Mission Terr, Excelsior, Portola, Bayview, Silver Terr, Hunters Pt, Candlestick Pt, Bayview Hts, Little Hollywood, Visitation Vly, Crocker Amazon) 2-2013 2-2014 + / – 2-2013 2-2014 + / – 2-2013 2-2014 + / – 2-2013 2-2014 + / – 2-2013 2-2014 + / – Single Family 1 SF District 1 35 15 -57.1% 10 12 +20.0% $1,031,250 $1,234,500 +19.7% 65 19 -71.5% 1.9 0.8 -57.5% Key metrics by report month for the districts of San Fransisco. Active Listings Sold Listings Median Sales Price Days on Market Months Supply 2 SF District 2 54 46 -14.8% 17 17 0.0% $800,000 $892,000 +11.5% 49 36 -26.8% 1.6 1.1 -30.8% 3 SF District 3 25 22 -12.0% 6 14 +133.3% $561,000 $700,250 +24.8% 34 51 +49.2% 1.7 1.3 -20.5% 4 SF District 4 36 23 -36.1% 21 19 -9.5% $950,000 $1,098,000 +15.6% 30 26 -11.6% 1.2 0.8 -31.3% 5 SF District 5 49 31 -36.7% 20 25 +25.0% $1,625,000 $2,300,000 +41.5% 29 25 -14.8% 1.5 1.0 -34.4% 6 SF District 6 9 1 -88.9% 2 9 +350.0% $2,675,000 $1,729,000 -35.4% 120 60 -50.4% 2.1 0.2 -88.6% 7 SF District 7 29 19 -34.5% 3 6 +100.0% $3,950,000 $4,987,500 +26.3% 65 24 -62.6% 2.9 1.7 -40.8% 8 SF District 8 8 5 -37.5% 1 4 +300.0% $3,050,000 $2,900,000 -4.9% 16 10 -35.9% 3.1 2.1 -34.2% 9 SF District 9 37 24 -35.1% 12 18 +50.0% $715,000 $1,252,500 +75.2% 58 45 -22.1% 1.9 1.0 -45.7% 10 SF District 10 96 88 -8.3% 37 28 -24.3% $558,500 $632,500 +13.2% 32 55 +70.6% 1.8 2.0 +10.0% Condo/TIC/Coop 1 SF District 1 24 21 -12.5% 14 9 -35.7% $590,000 $1,010,850 +71.3% 41 60 +46.2% 1.7 1.7 +3.6% 2 SF District 2 12 7 -41.7% 2 2 0.0% $963,000 $810,000 -15.9% 15 64 +341.4% 2.3 1.5 -33.9% 3 SF District 3 6 3 -50.0% 3 3 0.0% $320,088 $410,000 +28.1% 29 56 +90.9% 1.8 1.1 -35.2% 4 SF District 4 9 8 -11.1% 4 5 +25.0% $389,500 $599,000 +53.8% 77 16 -79.8% 1.8 1.5 -16.8% 5 SF District 5 77 60 -22.1% 37 32 -13.5% $910,000 $1,132,500 +24.5% 55 21 -61.1% 2.0 1.4 -30.8% 6 SF District 6 55 34 -38.2% 12 21 +75.0% $695,000 $715,000 +2.9% 35 68 +96.2% 2.1 1.1 -47.6% 7 SF District 7 79 33 -58.2% 24 15 -37.5% $1,007,500 $1,365,000 +35.5% 69 28 -59.2% 2.7 1.1 -60.7% 8 SF District 8 100 93 -7.0% 31 33 +6.5% $667,000 $910,000 +36.4% 44 47 +6.3% 2.1 2.0 -6.8% 9 SF District 9 177 124 -29.9% 63 91 +44.4% $812,000 $975,000 +20.1% 44 31 -29.3% 2.0 1.2 -38.1% 10 SF District 10 36 15 -58.3% 5 5 0.0% $366,500 $442,000 +20.6% 50 147 +196.4% 5.7 2.6 -54.8% Current as of March 13, 2014. All data from the San Francisco MLS. Powered by 10K Research and Marketing. | Click for Cover Page | 16Current as of March 13, 2014. All data from the San Francisco MLS. Powered by 10K Research and Marketing. | Click for Cover Page | 16