SlideShare a Scribd company logo
1 of 16
Download to read offline
March 2024 Monthly Snapshot
One-Year Change in One-Year Change in
Median Sales Price Single
Family
Median Sales Price
Condo/TIC/Coop
2
3
4
5
6
7
8
9
10
11
12
13
14
15
16
Current as of April 11, 2024. All data from the San Francisco Association of REALTORS® MLS. Report © 2024 ShowingTime Plus, LLC.
Condo/TIC/Coop Activity Overview
Inventory of Active Listings
% of Properties Sold Over List Price
% of List Price Received
Housing Affordability Ratio
All Properties Activity Overview
New Listings
Pending Sales
Sold Listings
Median Sales Price
Average Sales Price
Days on Market Until Sale
Activity by District
Monthly Indicators
+ 3.1% + 8.5% + 5.3%
One-Year Change in
U.S. existing-home sales improved for the second month in a row, jumping
9.5% to a seasonally adjusted annual rate of 4.38 million units, exceeding
economists’ expectations and marking the largest monthly gain in a year,
according to the National Association of REALTORS®(NAR). The rebound in
home sales comes amid fluctuating mortgage rates and elevated sales prices,
indicating there is plenty of buyer demand heading into the spring selling
season.
New Listings were up 2.9 percent for single family homes but decreased 0.6
percent for Condo/TIC/Coop properties. Pending Sales increased 29.8 percent
for single family homes and 11.9 percent for Condo/TIC/Coop properties.
The Median Sales Price was up 3.1 percent to $1,747,500 for single family
homes and 8.5 percent to $1,150,000 for Condo/TIC/Coop properties. Months
Supply of Inventory decreased 16.7 percent for single family units but was up
11.4 percent for Condo/TIC/Coop units.
The recent surge in home sales was likely due to a dip in mortgage rates in
December and an increase in housing supply nationwide. According to NAR,
total inventory grew 5.9% month-over-month and 10.3% year-over-year to 1.07
million units, for a 2.9 months’ supply at the current sales pace. Buyer demand
remains robust, and the limited supply of inventory helped push the median
existing-home sales price up 5.7% year-over-year to $384,500, the eighth
consecutive month of annual price increases.
Median Sales Price
All Property Types
Residential real estate activity in San Francisco County (Districts 1-10)
composed of single-family properties, townhomes and condominiums. Percent
changes are calculated using rounded figures.
Single Family Activity Overview
Months Supply of Inventory
For questions or more information, contact
communications@sfrealtors.com.
Single Family Activity Overview
Key metrics by report month and for year-to-date (YTD) starting from the first of the year.
Key Metrics Historical Sparkbars 3-2023 3-2024 Percent Change YTD 2023 YTD 2024 Percent Change
+ 13.0%
660
398 + 13.1%
$1,650,000 + 8.1%
+ 8.8%
Pending Sales 168 218 + 29.8% + 28.1%
381 488
New Listings 243 250 + 2.9% 584
Sold Listings 151 166 + 9.9% 352
Median Sales Price $1,695,000 $1,747,500 + 3.1% $1,526,500
37 0.0%
$2,189,916
-- --
Days on Market 32 27 - 15.6% 37
Avg. Sales Price $2,272,702 $2,304,876 + 1.4% $2,012,713
Active Listings 320 252 - 21.3% --
% of Properties Sold Over List Price 62.3% 68.7% + 10.3% 54.0%
27
62.6% + 15.9%
+ 2.5%
24 - 11.1%
108.0%
% of List Price Received 107.9% 110.1% + 2.0% 105.4%
Current as of April 11, 2024. All data from the San Francisco Association of REALTORS® MLS. Report © 2024 ShowingTime Plus, LLC. | 2
Months Supply 1.8 1.5 - 16.7% -- -- --
Affordability Ratio 25 23 - 8.0%
3-2021 3-2022 3-2023 3-2024
3-2021 3-2022 3-2023 3-2024
3-2021 3-2022 3-2023 3-2024
3-2021 3-2022 3-2023 3-2024
3-2021 3-2022 3-2023 3-2024
3-2021 3-2022 3-2023 3-2024
3-2021 3-2022 3-2023 3-2024
3-2021 3-2022 3-2023 3-2024
3-2021 3-2022 3-2023 3-2024
3-2021 3-2022 3-2023 3-2024
3-2021 3-2022 3-2023 3-2024
Condo/TIC/Coop Activity Overview
Key metrics by report month and for year-to-date (YTD) starting from the first of the year.
Key Metrics Historical Sparkbars 3-2023 3-2024 Percent Change YTD 2023 YTD 2024 Percent Change
+ 6.0%
Pending Sales 244 273 + 11.9% 542 636 + 17.3%
New Listings 362 360 - 0.6% 1,018 1,079
Sold Listings 248 189 - 23.8% 496 489 - 1.4%
Median Sales Price $1,060,000 $1,150,000 + 8.5% $1,060,000 $1,125,000 + 6.1%
+ 7.8%
59 - 7.8%
$1,341,195
-- --
Days on Market 58 49 - 15.5% 64
Avg. Sales Price $1,207,124 $1,285,116 + 6.5% $1,243,915
Active Listings 774 723 - 6.6% --
% of Properties Sold Over List Price 36.3% 36.0% - 0.8% 30.2%
44
31.5% + 4.3%
+ 0.4%
40 - 9.1%
99.9%
% of List Price Received 100.4% 101.2% + 0.8% 99.5%
Current as of April 11, 2024. All data from the San Francisco Association of REALTORS® MLS. Report © 2024 ShowingTime Plus, LLC. | 3
Months Supply 3.5 3.9 + 11.4% -- -- --
Affordability Ratio 44 39 - 11.4%
3-2021 3-2022 3-2023 3-2024
3-2021 3-2022 3-2023 3-2024
3-2021 3-2022 3-2023 3-2024
3-2021 3-2022 3-2023 3-2024
3-2021 3-2022 3-2023 3-2024
3-2021 3-2022 3-2023 3-2024
3-2021 3-2022 3-2023 3-2024
3-2021 3-2022 3-2023 3-2024
3-2021 3-2022 3-2023 3-2024
3-2021 3-2022 3-2023 3-2024
3-2021 3-2022 3-2023 3-2024
New Listings
New Listings
Single
Family
Year-Over-Year
Change
Condo/TIC/
Coop
Year-Over-Year
Change
Apr-2023 238 -27.7% 327 -39.7%
May-2023 277 -8.0% 320 -38.0%
Jun-2023 217 -31.8% 314 -30.4%
Jul-2023 190 -21.5% 243 -36.6%
Aug-2023 252 +5.4% 290 -6.1%
Sep-2023 373 +1.6% 553 -3.7%
Oct-2023 246 +1.7% 310 -18.0%
Nov-2023 102 -32.9% 154 +0.7%
Dec-2023 48 -33.3% 83 +5.1%
Jan-2024 184 +9.5% 347 +1.2%
Feb-2024 226 +30.6% 372 +18.8%
Mar-2024 250 +2.9% 360 -0.6%
12-Month Avg 217 -8.5% 306 -16.6%
Historical New Listings by Month
Current as of April 11, 2024. All data from the San Francisco Association of REALTORS® MLS. Report © 2024 ShowingTime Plus, LLC. | 4
A count of the properties that have been newly listed on the market in a given month.
342
615
243
362
250
360
Single Family Condo/TIC/Coop
March
0
200
400
600
800
1-2005 1-2006 1-2007 1-2008 1-2009 1-2010 1-2011 1-2012 1-2013 1-2014 1-2015 1-2016 1-2017 1-2018 1-2019 1-2020 1-2021 1-2022 1-2023 1-2024
Single Family Condo/TIC/Coop
858
1,622
584
1,018
660
1,079
Single Family Condo/TIC/Coop
Year to Date
2022 2023 2024
- 0.6%
- 41.1%
+ 2.9%
- 28.9% - 37.2%
+ 13.0%
- 31.9% + 6.0%
2022 2023 2024 2022 2023 2024 2022 2023 2024
+ 5.6% + 3.6% + 2.6%
+ 13.9%
Pending Sales
Pending Sales
Single
Family
Year-Over-Year
Change
Condo/TIC/
Coop
Year-Over-Year
Change
Apr-2023 186 -30.9% 234 -31.8%
May-2023 209 -16.1% 211 -36.4%
Jun-2023 193 -2.0% 194 -25.4%
Jul-2023 131 -27.6% 157 -29.3%
Aug-2023 148 -18.2% 176 -24.1%
Sep-2023 174 -7.9% 163 -23.5%
Oct-2023 211 +8.2% 187 -15.4%
Nov-2023 153 -7.8% 150 -6.3%
Dec-2023 94 -19.0% 137 +11.4%
Jan-2024 106 +21.8% 156 +26.8%
Feb-2024 164 +30.2% 207 +18.3%
Mar-2024 218 +29.8% 273 +11.9%
12-Month Avg 166 -6.5% 187 -15.2%
Historical Pending Sales by Month
Current as of April 11, 2024. All data from the San Francisco Association of REALTORS® MLS. Report © 2024 ShowingTime Plus, LLC. | 5
A count of the properties on which offers have been accepted in a given month.
287
437
168
244
218
273
Single Family Condo/TIC/Coop
March
0
100
200
300
400
500
600
1-2005 1-2006 1-2007 1-2008 1-2009 1-2010 1-2011 1-2012 1-2013 1-2014 1-2015 1-2016 1-2017 1-2018 1-2019 1-2020 1-2021 1-2022 1-2023 1-2024
Single Family Condo/TIC/Coop
646
975
381
542
488
636
Single Family Condo/TIC/Coop
Year to Date
2022 2023 2024
+ 11.9%
- 44.2%
+ 29.8%
- 41.5% - 44.4%
+ 28.1%
- 41.0% + 17.3%
2022 2023 2024 2022 2023 2024 2022 2023 2024
- 0.7% - 5.6% - 15.0%
- 7.8%
Sold Listings
Sold Listings
Single
Family
Year-Over-Year
Change
Condo/TIC/
Coop
Year-Over-Year
Change
Apr-2023 174 -32.3% 217 -43.2%
May-2023 189 -33.0% 232 -37.0%
Jun-2023 205 -17.7% 208 -32.7%
Jul-2023 159 -12.6% 166 -29.4%
Aug-2023 151 -20.5% 160 -32.5%
Sep-2023 145 -19.4% 170 -19.0%
Oct-2023 201 +4.7% 190 -15.2%
Nov-2023 193 +3.8% 154 -25.6%
Dec-2023 121 -21.4% 164 +11.6%
Jan-2024 91 -9.0% 116 +9.4%
Feb-2024 141 +39.6% 184 +29.6%
Mar-2024 166 +9.9% 189 -23.8%
12-Month Avg 161 -12.9% 179 -23.6%
Historical Sold Listings by Month
Current as of April 11, 2024. All data from the San Francisco Association of REALTORS® MLS. Report © 2024 ShowingTime Plus, LLC. | 6
A count of the actual sales that closed in a given month.
257
394
151
248
166
189
Single Family Condo/TIC/Coop
March
0
100
200
300
400
500
1-2005 1-2006 1-2007 1-2008 1-2009 1-2010 1-2011 1-2012 1-2013 1-2014 1-2015 1-2016 1-2017 1-2018 1-2019 1-2020 1-2021 1-2022 1-2023 1-2024
Single Family Condo/TIC/Coop
546
830
352
496
398
489
Single Family Condo/TIC/Coop
Year to Date
2022 2023 2024
- 23.8%
- 37.1%
+ 9.9%
- 41.2% - 40.2%
+ 13.1%
- 35.5% - 1.4%
2022 2023 2024 2022 2023 2024 2022 2023 2024
- 5.2% - 8.2% - 17.4%
- 13.8%
Median Sales Price
Median Sales Price
Single
Family
Year-Over-Year
Change
Condo/TIC/
Coop
Year-Over-Year
Change
Apr-2023 $1,560,500 -23.9% $1,175,000 -14.2%
May-2023 $1,650,000 -17.8% $1,062,500 -12.6%
Jun-2023 $1,600,000 -14.9% $1,117,500 -9.9%
Jul-2023 $1,450,000 -13.0% $1,135,000 -5.2%
Aug-2023 $1,575,000 -1.9% $1,084,193 +8.4%
Sep-2023 $1,580,000 -4.2% $1,050,000 -9.5%
Oct-2023 $1,650,000 -1.2% $1,155,000 -3.8%
Nov-2023 $1,527,000 +1.8% $1,115,053 -0.9%
Dec-2023 $1,450,000 -5.7% $995,000 +4.7%
Jan-2024 $1,575,000 +15.2% $1,087,500 +9.5%
Feb-2024 $1,575,000 +9.4% $1,115,000 -4.1%
Mar-2024 $1,747,500 +3.1% $1,150,000 +8.5%
12-Month Avg* $1,576,000 -7.3% $1,100,000 -6.4%
Historical Median Sales Price by Month
* Median Sales Price for all properties from April 2023 through March 2024. This is not the
average of the individual figures above.
Current as of April 11, 2024. All data from the San Francisco Association of REALTORS® MLS. Report © 2024 ShowingTime Plus, LLC. | 7
Point at which half of the sales sold for more and half sold for less, not accounting for seller concessions, in a given month.
$2,000,000
$1,206,750
$1,695,000
$1,060,000
$1,747,500
$1,150,000
Single Family Condo/TIC/Coop
March
$500,000
$750,000
$1,000,000
$1,250,000
$1,500,000
$1,750,000
$2,000,000
$2,250,000
1-2005 1-2006 1-2007 1-2008 1-2009 1-2010 1-2011 1-2012 1-2013 1-2014 1-2015 1-2016 1-2017 1-2018 1-2019 1-2020 1-2021 1-2022 1-2023 1-2024
Single Family Condo/TIC/Coop
$1,867,500
$1,200,000
$1,526,500
$1,060,000
$1,650,000
$1,125,000
Single Family Condo/TIC/Coop
Year to Date
2022 2023 2024
+ 8.5%
- 12.2%
+ 3.1%
- 15.3% - 11.7%
+ 8.1%
- 18.3% + 6.1%
2022 2023 2024 2022 2023 2024 2022 2023 2024
+ 15.9% + 13.2% + 2.1%
- 1.2%
Average Sales Price
Average Sales
Price
Single
Family
Year-Over-Year
Change
Condo/TIC/
Coop
Year-Over-Year
Change
Apr-2023 $2,209,070 -12.0% $1,370,225 -7.1%
May-2023 $2,141,045 -11.2% $1,171,111 -16.5%
Jun-2023 $2,009,398 -14.7% $1,296,055 -5.1%
Jul-2023 $1,835,021 -10.9% $1,213,203 -17.3%
Aug-2023 $2,141,891 +10.0% $1,211,809 +3.1%
Sep-2023 $2,012,607 +7.0% $1,342,704 -0.0%
Oct-2023 $2,312,677 +4.6% $1,265,490 -10.8%
Nov-2023 $2,014,207 +6.3% $1,241,516 -10.9%
Dec-2023 $1,973,556 +5.5% $1,166,449 +6.2%
Jan-2024 $2,245,947 +24.0% $1,438,048 +14.2%
Feb-2024 $2,018,412 +10.7% $1,337,737 +3.2%
Mar-2024 $2,304,876 +1.4% $1,285,116 +6.5%
12-Month Avg* $2,103,286 -1.9% $1,274,904 -5.3%
Historical Average Sales Price by Month
* Avg. Sales Price for all properties from April 2023 through March 2024. This is not the average
of the individual figures above.
Current as of April 11, 2024. All data from the San Francisco Association of REALTORS® MLS. Report © 2024 ShowingTime Plus, LLC. | 8
Average sales price for all closed sales, not accounting for seller concessions, in a given month.
$2,534,210
$1,411,860
$2,272,702
$1,207,124
$2,304,876
$1,285,116
Single Family Condo/TIC/Coop
March
$500,000
$1,000,000
$1,500,000
$2,000,000
$2,500,000
$3,000,000
1-2005 1-2006 1-2007 1-2008 1-2009 1-2010 1-2011 1-2012 1-2013 1-2014 1-2015 1-2016 1-2017 1-2018 1-2019 1-2020 1-2021 1-2022 1-2023 1-2024
Single Family Condo/TIC/Coop
$2,366,231
$1,385,259
$2,012,713
$1,243,915
$2,189,916
$1,341,195
Single Family Condo/TIC/Coop
Year to Date
2022 2023 2024
+ 6.5%
- 14.5%
+ 1.4%
- 10.3% - 10.2%
+ 8.8%
- 14.9% + 7.8%
2022 2023 2024 2022 2023 2024 2022 2023 2024
+ 14.6% + 10.0% + 4.9%
+ 3.1%
Days on Market Until Sale
Days on Market
Until Sale
Single
Family
Year-Over-Year
Change
Condo/TIC/
Coop
Year-Over-Year
Change
Apr-2023 31 +93.8% 56 +75.0%
May-2023 28 +33.3% 52 +40.5%
Jun-2023 26 +52.9% 50 +28.2%
Jul-2023 26 +23.8% 54 +10.2%
Aug-2023 36 +38.5% 57 +14.0%
Sep-2023 30 +7.1% 54 -6.9%
Oct-2023 23 -17.9% 47 +9.3%
Nov-2023 31 -11.4% 57 +11.8%
Dec-2023 40 +5.3% 77 +4.1%
Jan-2024 58 +16.0% 87 0.0%
Feb-2024 35 +6.1% 51 -13.6%
Mar-2024 27 -15.6% 49 -15.5%
12-Month Avg* 31 +18.1% 56 +16.7%
Historical Days on Market Until Sale by Month
* Days on Market for all properties from April 2023 through March 2024. This is not the average of
the individual figures above.
Current as of April 11, 2024. All data from the San Francisco Association of REALTORS® MLS. Report © 2024 ShowingTime Plus, LLC. | 9
Average number of days between when a property is listed and when an offer is accepted in a given month.
16
34
32
58
27
49
Single Family Condo/TIC/Coop
March
0
20
40
60
80
100
120
1-2005 1-2006 1-2007 1-2008 1-2009 1-2010 1-2011 1-2012 1-2013 1-2014 1-2015 1-2016 1-2017 1-2018 1-2019 1-2020 1-2021 1-2022 1-2023 1-2024
Single Family Condo/TIC/Coop
24
42
37
64
37
59
Single Family Condo/TIC/Coop
Year to Date
2022 2023 2024
- 15.5%
+ 70.6%
- 15.6%
+ 100.0% + 52.4%
0.0%
+ 54.2% - 7.8%
2022 2023 2024 2022 2023 2024 2022 2023 2024
- 38.5% - 25.0% - 30.0%
- 29.2%
Inventory of Active Listings
Inventory of Active
Listings
Single
Family
Year-Over-Year
Change
Condo/TIC/
Coop
Year-Over-Year
Change
Apr-2023 343 +2.1% 789 -29.0%
May-2023 357 +7.9% 807 -28.0%
Jun-2023 324 -13.6% 793 -28.1%
Jul-2023 315 -14.2% 765 -25.1%
Aug-2023 344 -2.3% 702 -21.7%
Sep-2023 484 -0.2% 980 -11.3%
Oct-2023 455 -4.0% 981 -10.6%
Nov-2023 340 -9.3% 817 -6.3%
Dec-2023 180 -16.7% 491 -6.1%
Jan-2024 219 -15.8% 604 -7.6%
Feb-2024 254 -10.6% 713 -1.8%
Mar-2024 252 -21.3% 723 -6.6%
12-Month Avg* 322 -7.4% 764 -16.7%
Historical Inventory of Active Listings by Month
* Active Listings for all properties from April 2023 through March 2024. This is not the average of
the individual figures above.
Current as of April 11, 2024. All data from the San Francisco Association of REALTORS® MLS. Report © 2024 ShowingTime Plus, LLC. | 10
The number of properties available for sale in active status at the end of a given month.
315
1,048
320
774
252
723
Single Family Condo/TIC/Coop
March
0
500
1,000
1,500
2,000
2,500
1-2005 1-2006 1-2007 1-2008 1-2009 1-2010 1-2011 1-2012 1-2013 1-2014 1-2015 1-2016 1-2017 1-2018 1-2019 1-2020 1-2021 1-2022 1-2023 1-2024
Single Family Condo/TIC/Coop
2022 2023 2024
- 6.6%
- 26.1%
- 21.3%
+ 1.6%
2022 2023 2024
- 14.2% - 8.8%
% of Properties Sold Over List Price
% of Properties
Sold Over List Price
Single
Family
Year-Over-Year
Change
Condo/TIC/
Coop
Year-Over-Year
Change
Apr-2023 62.1% -30.0% 32.7% -47.9%
May-2023 63.0% -27.5% 40.9% -26.0%
Jun-2023 69.8% -19.1% 37.5% -34.6%
Jul-2023 66.7% -15.1% 30.7% -22.5%
Aug-2023 64.2% -14.7% 31.3% -15.6%
Sep-2023 69.0% +2.7% 31.2% +0.6%
Oct-2023 67.7% +5.6% 34.2% -8.8%
Nov-2023 62.2% +8.2% 33.1% +8.9%
Dec-2023 54.5% +11.9% 22.1% +41.7%
Jan-2024 50.5% +14.8% 19.8% +4.8%
Feb-2024 63.1% +22.5% 34.2% +21.3%
Mar-2024 68.7% +10.3% 36.0% -0.8%
12-Month Avg 64.3% -10.1% 32.8% -22.3%
Historical % of Properties Sold Over List Price by Month
* % of Properties Sold Over List Price for all properties from April 2023 through March 2024. This
is not the average of the individual figures above.
Current as of April 11, 2024. All data from the San Francisco Association of REALTORS® MLS. Report © 2024 ShowingTime Plus, LLC. | 11
Percentage found when dividing the number of properties sold by properties sold over its original list price, not accounting for seller
concessions.
86.4%
58.1%
62.3%
36.3%
68.7%
36.0%
Single Family Condo/TIC/Coop
March
0.0%
20.0%
40.0%
60.0%
80.0%
100.0%
1-2005 1-2006 1-2007 1-2008 1-2009 1-2010 1-2011 1-2012 1-2013 1-2014 1-2015 1-2016 1-2017 1-2018 1-2019 1-2020 1-2021 1-2022 1-2023 1-2024
Single Family Condo/TIC/Coop
83.9%
53.9%
54.0%
30.2%
62.6%
31.5%
Single Family Condo/TIC/Coop
Year to Date
2022 2023 2024
- 0.8%
- 37.5%
+ 10.3%
- 27.9% - 44.0%
+ 15.9%
- 35.6% + 4.3%
2022 2023 2024 2022 2023 2024 2022 2023 2024
+ 17.1% + 23.6% + 53.6%
+ 35.4%
% of List Price Received
% of List Price
Received
Single
Family
Year-Over-Year
Change
Condo/TIC/
Coop
Year-Over-Year
Change
Apr-2023 107.1% -13.0% 99.9% -6.8%
May-2023 108.2% -9.5% 100.1% -5.5%
Jun-2023 108.6% -7.0% 100.6% -4.5%
Jul-2023 108.3% -2.4% 99.6% -1.9%
Aug-2023 107.2% -1.0% 99.5% -1.2%
Sep-2023 107.6% -0.8% 99.0% -1.6%
Oct-2023 107.9% +0.7% 99.7% -0.7%
Nov-2023 106.0% +1.0% 100.1% +0.9%
Dec-2023 104.3% +1.4% 99.0% +0.9%
Jan-2024 104.6% +1.4% 96.7% -1.2%
Feb-2024 107.9% +4.1% 100.5% +1.5%
Mar-2024 110.1% +2.0% 101.2% +0.8%
12-Month Avg* 107.5% -3.5% 99.8% -2.5%
Historical % of List Price Received by Month
* % of List Price Received for all properties from April 2023 through March 2024. This is not the
average of the individual figures above.
Current as of April 11, 2024. All data from the San Francisco Association of REALTORS® MLS. Report © 2024 ShowingTime Plus, LLC. | 12
Percentage found when dividing a property’s sales price by its most recent list price, then taking the average for all properties sold in a given
month, not accounting for seller concessions.
121.9%
106.4%
107.9%
100.4%
110.1%
101.2%
Single Family Condo/TIC/Coop
March
120.6%
105.1%
105.4%
99.5%
108.0%
99.9%
Single Family Condo/TIC/Coop
Year to Date
90.0%
100.0%
110.0%
120.0%
130.0%
1-2005 1-2006 1-2007 1-2008 1-2009 1-2010 1-2011 1-2012 1-2013 1-2014 1-2015 1-2016 1-2017 1-2018 1-2019 1-2020 1-2021 1-2022 1-2023 1-2024
Single Family Condo/TIC/Coop
2022 2023 2024
+ 0.8%
- 5.6%
+ 2.0%
- 11.5%
2022 2023 2024
+ 8.7% + 3.9%
2022 2023 2024
+ 0.4%
- 5.3%
+ 2.5%
- 12.6%
2022 2023 2024
+ 10.0% + 4.2%
Housing Affordability Ratio
Housing
Affordability Ratio
Single
Family
Year-Over-Year
Change
Condo/TIC/
Coop
Year-Over-Year
Change
Apr-2023 26 +23.8% 40 +8.1%
May-2023 25 +13.6% 43 +2.4%
Jun-2023 25 +8.7% 41 +2.5%
Jul-2023 27 0.0% 39 -9.3%
Aug-2023 24 -14.3% 40 -21.6%
Sep-2023 24 0.0% 41 +5.1%
Oct-2023 22 -4.3% 35 -5.4%
Nov-2023 25 -7.4% 38 -5.0%
Dec-2023 28 +3.7% 46 -6.1%
Jan-2024 26 -16.1% 42 -12.5%
Feb-2024 25 -10.7% 40 0.0%
Mar-2024 23 -8.0% 39 -11.4%
12-Month Avg* 25 -10.0% 40 -7.8%
Historical Housing Affordability Ratio by Month
* Affordability Ratio for all properties from April 2023 through March 2024. This is not the average
of the individual figures above.
Current as of April 11, 2024. All data from the San Francisco Association of REALTORS® MLS. Report © 2024 ShowingTime Plus, LLC. | 13
This index measures housing affordability for the region. For example, an index of 120 means the median household income is 120% of what is
necessary to qualify for the median-priced home under prevailing interest rates. A higher number means greater affordability.
24
45
25
44
23
39
Single Family Condo/TIC/Coop
March
20
40
60
80
100
1-2005 1-2006 1-2007 1-2008 1-2009 1-2010 1-2011 1-2012 1-2013 1-2014 1-2015 1-2016 1-2017 1-2018 1-2019 1-2020 1-2021 1-2022 1-2023 1-2024
Single Family Condo/TIC/Coop
2022 2023 2024
- 11.4%
- 2.2%
- 8.0%
+ 4.2%
2022 2023 2024
- 25.0% - 13.5%
25
45
27
44
24
40
Single Family Condo/TIC/Coop
Year to Date
2022 2023 2024
- 9.1%
- 2.2%
- 11.1%
+ 8.0%
2022 2023 2024
- 24.2% - 16.7%
Months Supply of Inventory
Months Supply of
Inventory
Single
Family
Year-Over-Year
Change
Condo/TIC/
Coop
Year-Over-Year
Change
Apr-2023 2.0 +42.9% 3.7 +15.6%
May-2023 2.1 +50.0% 4.0 +21.2%
Jun-2023 1.9 +18.8% 4.0 +17.6%
Jul-2023 1.9 +18.8% 4.0 +25.0%
Aug-2023 2.2 +37.5% 3.8 +31.0%
Sep-2023 3.1 +34.8% 5.4 +45.9%
Oct-2023 2.9 +26.1% 5.5 +41.0%
Nov-2023 2.1 +10.5% 4.6 +39.4%
Dec-2023 1.1 0.0% 2.7 +35.0%
Jan-2024 1.4 +7.7% 3.3 +22.2%
Feb-2024 1.6 +6.7% 3.9 +25.8%
Mar-2024 1.5 -16.7% 3.9 +11.4%
12-Month Avg* 2.0 +21.7% 4.1 +27.7%
Historical Months Supply of Inventory by Month
* Months Supply for all properties from April 2023 through March 2024. This is not the average of
the individual figures above.
Current as of April 11, 2024. All data from the San Francisco Association of REALTORS® MLS. Report © 2024 ShowingTime Plus, LLC. | 14
The inventory of homes for sale at the end of a given month, divided by the average monthly pending sales from the last 12 months.
1.3
2.9
1.8
3.5
1.5
3.9
Single Family Condo/TIC/Coop
March
0.0
2.0
4.0
6.0
8.0
10.0
12.0
1-2005 1-2006 1-2007 1-2008 1-2009 1-2010 1-2011 1-2012 1-2013 1-2014 1-2015 1-2016 1-2017 1-2018 1-2019 1-2020 1-2021 1-2022 1-2023 1-2024
Single Family Condo/TIC/Coop
2022 2023 2024
+ 11.4%
+ 20.7%
- 16.7%
+ 38.5%
2022 2023 2024
- 18.8% - 27.5%
All Properties Activity Overview
Key metrics by report month and for year-to-date (YTD) starting from the first of the year.
Key Metrics Historical Sparkbars 3-2023 3-2024 Percent Change YTD 2023 YTD 2024 Percent Change
+ 8.3%
Pending Sales 422 499 + 18.2% 938 1,142 + 21.7%
New Listings 611 617 + 1.0% 1,624 1,759
Sold Listings 409 361 - 11.7% 861 901 + 4.6%
Median Sales Price $1,315,000 $1,385,000 + 5.3% $1,275,000 $1,350,000 + 5.9%
+ 9.9%
49 - 7.5%
$1,714,014
-- --
Days on Market 48 39 - 18.8% 53
Avg. Sales Price $1,606,682 $1,752,469 + 9.1% $1,559,326
Active Listings 1,114 991 - 11.0% --
% of Properties Sold Over List Price 45.7% 51.5% + 12.7% 40.1%
30
45.7% + 14.0%
+ 1.6%
26 - 13.3%
103.5%
% of List Price Received 103.1% 105.3% + 2.1% 101.9%
Current as of April 11, 2024. All data from the San Francisco Association of REALTORS® MLS. Report © 2024 ShowingTime Plus, LLC. | 15
Months Supply 2.8 2.8 0.0% -- -- --
Affordability Ratio 29 26 - 10.3%
3-2021 3-2022 3-2023 3-2024
3-2021 3-2022 3-2023 3-2024
3-2021 3-2022 3-2023 3-2024
3-2021 3-2022 3-2023 3-2024
3-2021 3-2022 3-2023 3-2024
3-2021 3-2022 3-2023 3-2024
3-2021 3-2022 3-2023 3-2024
3-2021 3-2022 3-2023 3-2024
3-2021 3-2022 3-2023 3-2024
3-2021 3-2022 3-2023 3-2024
3-2021 3-2022 3-2023 3-2024
Activity by District
SF District 1: Northwest (Sea Cliff, Lake, Jordan Park / Laurel Heights, Outer Richmond, Central Richmond, Inner Richmond, Lone Mountain)
SF District 2: Central West (Outer Sunset, Central Sunset, Inner Sunset, Outer Parkside, Parkside, Inner Parkside, Golden Gate Heights)
SF District 3: Southwest (Pine Lake Park, Lake Shore, Merced Manor, Stonestown, Lakeside, Merced Heights, Ingleside, Ingleside Heights, Oceanview)
SF District 4: Twin Peaks W (Forest Hill (& Ext), W Portal, St Francis Wd, Balboa Terr, Mt Dav Manor, Ingleside Terr, Monterey Hts, Wstwd Pk & H'lnds, Shrwd Fst, Miraloma Pk, Dmnd Hts, Mdtwn Terr)
SF District 5: Central (Haight Ashbury, Cole Vly / Prnssus Hts, Clarndn Hts, Corona Hts, Twin Pks, Glen Pk, Noe Vly, Eureka Vly / Dolores Hts, Mission Dolores, Duboce Trngl, Buena Vista / Ashbury Hts)
SF District 6: Central North (Lower Pacific Heights, Anza Vista, Western Addition, North Panhandle, Alamo Square, Hayes Valley)
SF District 7: North (Marina, Cow Hollow, Presidio Heights, Pacific Heights)
SF District 8: Northeast (North Waterfront, North Beach, Russian Hill, Telegraph Hill, Nob Hill, Financial District / Barbary Coast, Downtown, Van Ness / Civic Center, Tenderloin)
SF District 9: Central East (Yerba Buena, South Beach, South of Market, Mission Bay, Inner Mission, Potrero Hill, Central Waterfront / Dogpatch, Bernal Heights)
SF District 10: Southeast (Outer Mission, Mission Terr, Excelsior, Portola, Bayview, Silver Terr, Hunters Pt, Candlestick Pt, Bayview Hts, Little Hollywood, Visitation Vly, Crocker Amazon)
3-2023 3-2024 + / – 3-2023 3-2024 + / – 3-2023 3-2024 + / – 3-2023 3-2024 + / – 3-2023 3-2024 + / –
Single Family
1 SF District 1 19 21 +10.5% 15 19 +26.7% $2,705,000 $2,020,000 -25.3% 25 26 +4.0% 1.3 1.3 0.0%
2 SF District 2 40 27 -32.5% 25 29 +16.0% $1,600,000 $1,550,000 -3.1% 28 22 -21.4% 1.1 0.9 -18.2%
3 SF District 3 19 13 -31.6% 13 13 0.0% $1,215,000 $1,550,000 +27.6% 34 26 -23.5% 1.6 1.1 -31.3%
4 SF District 4 22 23 +4.5% 23 23 0.0% $1,900,000 $1,950,000 +2.6% 28 17 -39.3% 0.9 1.0 +11.1%
5 SF District 5 48 37 -22.9% 19 27 +42.1% $2,600,000 $2,620,000 +0.8% 30 41 +36.7% 1.9 1.7 -10.5%
6 SF District 6 8 2 -75.0% 0 3 -- $0 $3,950,000 -- 0 22 -- 3.6 0.6 -83.3%
7 SF District 7 42 40 -4.8% 6 11 +83.3% $4,429,000 $4,351,000 -1.8% 57 22 -61.4% 6.5 4.2 -35.4%
8 SF District 8 12 6 -50.0% 2 5 +150.0% $6,025,000 $1,298,000 -78.5% 189 24 -87.3% 4.4 2.6 -40.9%
9 SF District 9 37 30 -18.9% 19 13 -31.6% $1,625,000 $1,695,000 +4.3% 29 26 -10.3% 2.1 1.8 -14.3%
10 SF District 10 73 53 -27.4% 29 23 -20.7% $1,170,000 $1,100,000 -6.0% 32 37 +15.6% 2.0 1.7 -15.0%
Condo/TIC/Coop
1 SF District 1 24 20 -16.7% 16 4 -75.0% $1,090,000 $1,382,000 +26.8% 28 33 +17.9% 2.0 2.3 +15.0%
2 SF District 2 12 8 -33.3% 7 5 -28.6% $925,000 $1,440,000 +55.7% 28 41 +46.4% 3.3 2.5 -24.2%
3 SF District 3 6 3 -50.0% 4 2 -50.0% $577,500 $678,000 +17.4% 35 16 -54.3% 2.1 1.6 -23.8%
4 SF District 4 15 8 -46.7% 2 3 +50.0% $735,000 $823,500 +12.0% 34 71 +108.8% 6.2 2.0 -67.7%
5 SF District 5 75 59 -21.3% 44 33 -25.0% $1,420,000 $1,352,000 -4.8% 35 25 -28.6% 1.8 1.9 +5.6%
6 SF District 6 69 46 -33.3% 28 13 -53.6% $1,470,000 $1,130,000 -23.1% 42 37 -11.9% 2.8 2.5 -10.7%
7 SF District 7 66 63 -4.5% 20 20 0.0% $1,338,000 $1,899,000 +41.9% 39 43 +10.3% 2.9 3.1 +6.9%
8 SF District 8 175 188 +7.4% 43 38 -11.6% $960,000 $1,250,000 +30.2% 72 54 -25.0% 4.7 5.0 +6.4%
9 SF District 9 305 293 -3.9% 77 67 -13.0% $978,000 $995,000 +1.7% 66 62 -6.1% 4.4 5.1 +15.9%
10 SF District 10 27 35 +29.6% 7 4 -42.9% $698,000 $401,500 -42.5% 248 82 -66.9% 5.1 7.5 +47.1%
Key metrics by report month for the districts of San Francisco.
Current as of April 11, 2024. All data from the San Francisco Association of REALTORS® MLS. Report © 2024 ShowingTime Plus, LLC. | 16
Active Listings Sold Listings Median Sales Price Days on Market Months Supply

More Related Content

Similar to San Francisco Market Update - March 2024

Similar to San Francisco Market Update - March 2024 (20)

San Francisco market report April 2020
San Francisco market report April 2020San Francisco market report April 2020
San Francisco market report April 2020
 
San Francisco Market Report February 2023
San Francisco Market Report February 2023San Francisco Market Report February 2023
San Francisco Market Report February 2023
 
San Francisco May 2023 Market Report.pdf
San Francisco May 2023 Market Report.pdfSan Francisco May 2023 Market Report.pdf
San Francisco May 2023 Market Report.pdf
 
San Francisco Market Focus April 2017
San Francisco Market Focus April 2017San Francisco Market Focus April 2017
San Francisco Market Focus April 2017
 
San Francisco Real Estate Housing Market December 2016
San Francisco Real Estate Housing Market December 2016San Francisco Real Estate Housing Market December 2016
San Francisco Real Estate Housing Market December 2016
 
San Francisco Market Focus Report Jan 2020
San Francisco Market Focus Report Jan 2020San Francisco Market Focus Report Jan 2020
San Francisco Market Focus Report Jan 2020
 
San Francisco market report August 2020
San Francisco market report August 2020San Francisco market report August 2020
San Francisco market report August 2020
 
San Francisco Market Report August 2021
San Francisco Market Report August 2021San Francisco Market Report August 2021
San Francisco Market Report August 2021
 
San Francisco Market Report January 2023.pdf
San Francisco Market Report January 2023.pdfSan Francisco Market Report January 2023.pdf
San Francisco Market Report January 2023.pdf
 
San Francisco June 2023 Market Report.pdf
San Francisco June 2023 Market Report.pdfSan Francisco June 2023 Market Report.pdf
San Francisco June 2023 Market Report.pdf
 
San Francisco market focus report December 2019
San Francisco market focus report December 2019San Francisco market focus report December 2019
San Francisco market focus report December 2019
 
San Francisco Market Report June 2021
San Francisco Market Report June 2021San Francisco Market Report June 2021
San Francisco Market Report June 2021
 
San Francisco market report July 2020
San Francisco market report July 2020San Francisco market report July 2020
San Francisco market report July 2020
 
San Francisco Market Focus Report May
San Francisco Market Focus Report MaySan Francisco Market Focus Report May
San Francisco Market Focus Report May
 
San Francisco market report June 2020
San Francisco market report June 2020San Francisco market report June 2020
San Francisco market report June 2020
 
San Francisco Market Report for March 2020
San Francisco Market Report for March 2020San Francisco Market Report for March 2020
San Francisco Market Report for March 2020
 
San Francisco Market Report January 2021
San Francisco Market Report January 2021San Francisco Market Report January 2021
San Francisco Market Report January 2021
 
San Francisco Market Report May 2021
San Francisco Market Report May 2021San Francisco Market Report May 2021
San Francisco Market Report May 2021
 
San Francisco Market Report December 2020
San Francisco Market Report December 2020San Francisco Market Report December 2020
San Francisco Market Report December 2020
 
San Francisco December 2023 Market Report
San Francisco December 2023 Market ReportSan Francisco December 2023 Market Report
San Francisco December 2023 Market Report
 

More from Ronny Budiutama

More from Ronny Budiutama (19)

2023 Annual San Francisco Housing Market
2023 Annual San Francisco Housing Market2023 Annual San Francisco Housing Market
2023 Annual San Francisco Housing Market
 
October 2023 Report: San Francisco Real Estate Market Insights
October 2023 Report: San Francisco Real Estate Market InsightsOctober 2023 Report: San Francisco Real Estate Market Insights
October 2023 Report: San Francisco Real Estate Market Insights
 
CA Weekly MLS Market Data Report - August 2023
CA Weekly MLS Market Data Report - August 2023CA Weekly MLS Market Data Report - August 2023
CA Weekly MLS Market Data Report - August 2023
 
San Francisco Market Report July 2023.pdf
San Francisco Market Report July 2023.pdfSan Francisco Market Report July 2023.pdf
San Francisco Market Report July 2023.pdf
 
Annual Report on the San Francisco County Housing Market.pdf
Annual Report on the San Francisco County Housing Market.pdfAnnual Report on the San Francisco County Housing Market.pdf
Annual Report on the San Francisco County Housing Market.pdf
 
San Francisco Market Report December 2022.pdf
San Francisco Market Report December 2022.pdfSan Francisco Market Report December 2022.pdf
San Francisco Market Report December 2022.pdf
 
San Francisco Market Report November 2022.pdf
San Francisco Market Report November 2022.pdfSan Francisco Market Report November 2022.pdf
San Francisco Market Report November 2022.pdf
 
San Francisco Market Report October 2022.pdf
San Francisco Market Report October 2022.pdfSan Francisco Market Report October 2022.pdf
San Francisco Market Report October 2022.pdf
 
San Francisco Market Report September 2022.pdf
San Francisco Market Report September 2022.pdfSan Francisco Market Report September 2022.pdf
San Francisco Market Report September 2022.pdf
 
San Francisco Market Report August 2022.pdf
San Francisco Market Report August 2022.pdfSan Francisco Market Report August 2022.pdf
San Francisco Market Report August 2022.pdf
 
San Francisco Market Report July 2022.pdf
San Francisco Market Report July 2022.pdfSan Francisco Market Report July 2022.pdf
San Francisco Market Report July 2022.pdf
 
San Francisco Market Report June 2022.pdf
San Francisco Market Report June 2022.pdfSan Francisco Market Report June 2022.pdf
San Francisco Market Report June 2022.pdf
 
San Francisco Market Report May 2022.
San Francisco Market Report May 2022.San Francisco Market Report May 2022.
San Francisco Market Report May 2022.
 
San Francisco Market Report April 2022.pdf
San Francisco Market Report April 2022.pdfSan Francisco Market Report April 2022.pdf
San Francisco Market Report April 2022.pdf
 
San Francisco Market Report February 2022
San Francisco Market Report February 2022San Francisco Market Report February 2022
San Francisco Market Report February 2022
 
San Francisco Market Report January 2022
San Francisco Market Report January 2022San Francisco Market Report January 2022
San Francisco Market Report January 2022
 
San Francisco Market Report December 2021
San Francisco Market Report December 2021San Francisco Market Report December 2021
San Francisco Market Report December 2021
 
San Francisco Market Report November 2021
San Francisco Market Report November 2021San Francisco Market Report November 2021
San Francisco Market Report November 2021
 
San Francisco Market Report October 2021
San Francisco Market Report October 2021San Francisco Market Report October 2021
San Francisco Market Report October 2021
 

Recently uploaded

FGM Gloria Tuzla Istanbul - Listing Turkey
FGM Gloria Tuzla Istanbul - Listing TurkeyFGM Gloria Tuzla Istanbul - Listing Turkey
FGM Gloria Tuzla Istanbul - Listing Turkey
Listing Turkey
 
Property Rental Cumbria North West Guide
Property Rental Cumbria North West GuideProperty Rental Cumbria North West Guide
Property Rental Cumbria North West Guide
AskXX.com
 

Recently uploaded (20)

Edenic Parth Kiona Hinjewadi | A Return To Better Living
Edenic Parth Kiona Hinjewadi | A Return To Better LivingEdenic Parth Kiona Hinjewadi | A Return To Better Living
Edenic Parth Kiona Hinjewadi | A Return To Better Living
 
Mahindra Kanakpura Road Bangalore.pdf.pdf
Mahindra Kanakpura Road Bangalore.pdf.pdfMahindra Kanakpura Road Bangalore.pdf.pdf
Mahindra Kanakpura Road Bangalore.pdf.pdf
 
Uk Property Rental Market Guide by region 2024
Uk Property Rental Market Guide by region 2024Uk Property Rental Market Guide by region 2024
Uk Property Rental Market Guide by region 2024
 
Purvanchal Skyline Vista Noida Expressway Sector 94
Purvanchal Skyline Vista Noida Expressway Sector 94Purvanchal Skyline Vista Noida Expressway Sector 94
Purvanchal Skyline Vista Noida Expressway Sector 94
 
Top^Clinic ^%[+27785538335__Safe*Abortion Pills For Sale In Ebony park tembisa
Top^Clinic ^%[+27785538335__Safe*Abortion Pills For Sale In Ebony park tembisaTop^Clinic ^%[+27785538335__Safe*Abortion Pills For Sale In Ebony park tembisa
Top^Clinic ^%[+27785538335__Safe*Abortion Pills For Sale In Ebony park tembisa
 
SVN Live 5.20.24 Weekly Property Broadcast
SVN Live 5.20.24 Weekly Property BroadcastSVN Live 5.20.24 Weekly Property Broadcast
SVN Live 5.20.24 Weekly Property Broadcast
 
FGM Gloria Tuzla Istanbul - Listing Turkey
FGM Gloria Tuzla Istanbul - Listing TurkeyFGM Gloria Tuzla Istanbul - Listing Turkey
FGM Gloria Tuzla Istanbul - Listing Turkey
 
Diego Marynberg: Mastering the Real Estate and Finance Landscape
Diego Marynberg: Mastering the Real Estate and Finance LandscapeDiego Marynberg: Mastering the Real Estate and Finance Landscape
Diego Marynberg: Mastering the Real Estate and Finance Landscape
 
Why Sell With Urban Cool KC - Listing Presentation
Why Sell With Urban Cool KC - Listing PresentationWhy Sell With Urban Cool KC - Listing Presentation
Why Sell With Urban Cool KC - Listing Presentation
 
Experion Sector 99Noida E-Brochure.pdf.pdf
Experion Sector 99Noida E-Brochure.pdf.pdfExperion Sector 99Noida E-Brochure.pdf.pdf
Experion Sector 99Noida E-Brochure.pdf.pdf
 
Ashiana Vatsalya Senior Living Mahindra World City, Chennai
Ashiana Vatsalya Senior Living Mahindra World City, ChennaiAshiana Vatsalya Senior Living Mahindra World City, Chennai
Ashiana Vatsalya Senior Living Mahindra World City, Chennai
 
Listing Turkey - TURKSTAT Corporate - 2024 April
Listing Turkey - TURKSTAT Corporate - 2024 AprilListing Turkey - TURKSTAT Corporate - 2024 April
Listing Turkey - TURKSTAT Corporate - 2024 April
 
VTP Dhanori Pune Residential Apartment Brochure.pdf
VTP Dhanori Pune Residential Apartment Brochure.pdfVTP Dhanori Pune Residential Apartment Brochure.pdf
VTP Dhanori Pune Residential Apartment Brochure.pdf
 
indiafirstgreenfieldsmartcitydholeraPPT.pptx
indiafirstgreenfieldsmartcitydholeraPPT.pptxindiafirstgreenfieldsmartcitydholeraPPT.pptx
indiafirstgreenfieldsmartcitydholeraPPT.pptx
 
Merlin-Ventana-Apartments-Baner-Pune-Brochure
Merlin-Ventana-Apartments-Baner-Pune-BrochureMerlin-Ventana-Apartments-Baner-Pune-Brochure
Merlin-Ventana-Apartments-Baner-Pune-Brochure
 
Ashiana Amarah Kid Centric Homes, Gurgaon
Ashiana Amarah Kid Centric Homes, GurgaonAshiana Amarah Kid Centric Homes, Gurgaon
Ashiana Amarah Kid Centric Homes, Gurgaon
 
Majestique-The-Crown-7-Loves-Chowk-Pune-Brochure
Majestique-The-Crown-7-Loves-Chowk-Pune-BrochureMajestique-The-Crown-7-Loves-Chowk-Pune-Brochure
Majestique-The-Crown-7-Loves-Chowk-Pune-Brochure
 
MI NOVA 6+6 LED SURGICAL LIGHTS Morbros India
MI NOVA 6+6 LED SURGICAL LIGHTS Morbros IndiaMI NOVA 6+6 LED SURGICAL LIGHTS Morbros India
MI NOVA 6+6 LED SURGICAL LIGHTS Morbros India
 
Aishwaryam Codename Fashion At Tathawade, Pune - PDF.pdf
Aishwaryam Codename Fashion At Tathawade, Pune - PDF.pdfAishwaryam Codename Fashion At Tathawade, Pune - PDF.pdf
Aishwaryam Codename Fashion At Tathawade, Pune - PDF.pdf
 
Property Rental Cumbria North West Guide
Property Rental Cumbria North West GuideProperty Rental Cumbria North West Guide
Property Rental Cumbria North West Guide
 

San Francisco Market Update - March 2024

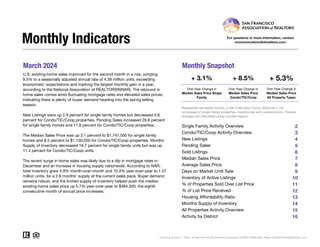
  • 1. March 2024 Monthly Snapshot One-Year Change in One-Year Change in Median Sales Price Single Family Median Sales Price Condo/TIC/Coop 2 3 4 5 6 7 8 9 10 11 12 13 14 15 16 Current as of April 11, 2024. All data from the San Francisco Association of REALTORS® MLS. Report © 2024 ShowingTime Plus, LLC. Condo/TIC/Coop Activity Overview Inventory of Active Listings % of Properties Sold Over List Price % of List Price Received Housing Affordability Ratio All Properties Activity Overview New Listings Pending Sales Sold Listings Median Sales Price Average Sales Price Days on Market Until Sale Activity by District Monthly Indicators + 3.1% + 8.5% + 5.3% One-Year Change in U.S. existing-home sales improved for the second month in a row, jumping 9.5% to a seasonally adjusted annual rate of 4.38 million units, exceeding economists’ expectations and marking the largest monthly gain in a year, according to the National Association of REALTORS®(NAR). The rebound in home sales comes amid fluctuating mortgage rates and elevated sales prices, indicating there is plenty of buyer demand heading into the spring selling season. New Listings were up 2.9 percent for single family homes but decreased 0.6 percent for Condo/TIC/Coop properties. Pending Sales increased 29.8 percent for single family homes and 11.9 percent for Condo/TIC/Coop properties. The Median Sales Price was up 3.1 percent to $1,747,500 for single family homes and 8.5 percent to $1,150,000 for Condo/TIC/Coop properties. Months Supply of Inventory decreased 16.7 percent for single family units but was up 11.4 percent for Condo/TIC/Coop units. The recent surge in home sales was likely due to a dip in mortgage rates in December and an increase in housing supply nationwide. According to NAR, total inventory grew 5.9% month-over-month and 10.3% year-over-year to 1.07 million units, for a 2.9 months’ supply at the current sales pace. Buyer demand remains robust, and the limited supply of inventory helped push the median existing-home sales price up 5.7% year-over-year to $384,500, the eighth consecutive month of annual price increases. Median Sales Price All Property Types Residential real estate activity in San Francisco County (Districts 1-10) composed of single-family properties, townhomes and condominiums. Percent changes are calculated using rounded figures. Single Family Activity Overview Months Supply of Inventory For questions or more information, contact communications@sfrealtors.com.
  • 2. Single Family Activity Overview Key metrics by report month and for year-to-date (YTD) starting from the first of the year. Key Metrics Historical Sparkbars 3-2023 3-2024 Percent Change YTD 2023 YTD 2024 Percent Change + 13.0% 660 398 + 13.1% $1,650,000 + 8.1% + 8.8% Pending Sales 168 218 + 29.8% + 28.1% 381 488 New Listings 243 250 + 2.9% 584 Sold Listings 151 166 + 9.9% 352 Median Sales Price $1,695,000 $1,747,500 + 3.1% $1,526,500 37 0.0% $2,189,916 -- -- Days on Market 32 27 - 15.6% 37 Avg. Sales Price $2,272,702 $2,304,876 + 1.4% $2,012,713 Active Listings 320 252 - 21.3% -- % of Properties Sold Over List Price 62.3% 68.7% + 10.3% 54.0% 27 62.6% + 15.9% + 2.5% 24 - 11.1% 108.0% % of List Price Received 107.9% 110.1% + 2.0% 105.4% Current as of April 11, 2024. All data from the San Francisco Association of REALTORS® MLS. Report © 2024 ShowingTime Plus, LLC. | 2 Months Supply 1.8 1.5 - 16.7% -- -- -- Affordability Ratio 25 23 - 8.0% 3-2021 3-2022 3-2023 3-2024 3-2021 3-2022 3-2023 3-2024 3-2021 3-2022 3-2023 3-2024 3-2021 3-2022 3-2023 3-2024 3-2021 3-2022 3-2023 3-2024 3-2021 3-2022 3-2023 3-2024 3-2021 3-2022 3-2023 3-2024 3-2021 3-2022 3-2023 3-2024 3-2021 3-2022 3-2023 3-2024 3-2021 3-2022 3-2023 3-2024 3-2021 3-2022 3-2023 3-2024
  • 3. Condo/TIC/Coop Activity Overview Key metrics by report month and for year-to-date (YTD) starting from the first of the year. Key Metrics Historical Sparkbars 3-2023 3-2024 Percent Change YTD 2023 YTD 2024 Percent Change + 6.0% Pending Sales 244 273 + 11.9% 542 636 + 17.3% New Listings 362 360 - 0.6% 1,018 1,079 Sold Listings 248 189 - 23.8% 496 489 - 1.4% Median Sales Price $1,060,000 $1,150,000 + 8.5% $1,060,000 $1,125,000 + 6.1% + 7.8% 59 - 7.8% $1,341,195 -- -- Days on Market 58 49 - 15.5% 64 Avg. Sales Price $1,207,124 $1,285,116 + 6.5% $1,243,915 Active Listings 774 723 - 6.6% -- % of Properties Sold Over List Price 36.3% 36.0% - 0.8% 30.2% 44 31.5% + 4.3% + 0.4% 40 - 9.1% 99.9% % of List Price Received 100.4% 101.2% + 0.8% 99.5% Current as of April 11, 2024. All data from the San Francisco Association of REALTORS® MLS. Report © 2024 ShowingTime Plus, LLC. | 3 Months Supply 3.5 3.9 + 11.4% -- -- -- Affordability Ratio 44 39 - 11.4% 3-2021 3-2022 3-2023 3-2024 3-2021 3-2022 3-2023 3-2024 3-2021 3-2022 3-2023 3-2024 3-2021 3-2022 3-2023 3-2024 3-2021 3-2022 3-2023 3-2024 3-2021 3-2022 3-2023 3-2024 3-2021 3-2022 3-2023 3-2024 3-2021 3-2022 3-2023 3-2024 3-2021 3-2022 3-2023 3-2024 3-2021 3-2022 3-2023 3-2024 3-2021 3-2022 3-2023 3-2024
  • 4. New Listings New Listings Single Family Year-Over-Year Change Condo/TIC/ Coop Year-Over-Year Change Apr-2023 238 -27.7% 327 -39.7% May-2023 277 -8.0% 320 -38.0% Jun-2023 217 -31.8% 314 -30.4% Jul-2023 190 -21.5% 243 -36.6% Aug-2023 252 +5.4% 290 -6.1% Sep-2023 373 +1.6% 553 -3.7% Oct-2023 246 +1.7% 310 -18.0% Nov-2023 102 -32.9% 154 +0.7% Dec-2023 48 -33.3% 83 +5.1% Jan-2024 184 +9.5% 347 +1.2% Feb-2024 226 +30.6% 372 +18.8% Mar-2024 250 +2.9% 360 -0.6% 12-Month Avg 217 -8.5% 306 -16.6% Historical New Listings by Month Current as of April 11, 2024. All data from the San Francisco Association of REALTORS® MLS. Report © 2024 ShowingTime Plus, LLC. | 4 A count of the properties that have been newly listed on the market in a given month. 342 615 243 362 250 360 Single Family Condo/TIC/Coop March 0 200 400 600 800 1-2005 1-2006 1-2007 1-2008 1-2009 1-2010 1-2011 1-2012 1-2013 1-2014 1-2015 1-2016 1-2017 1-2018 1-2019 1-2020 1-2021 1-2022 1-2023 1-2024 Single Family Condo/TIC/Coop 858 1,622 584 1,018 660 1,079 Single Family Condo/TIC/Coop Year to Date 2022 2023 2024 - 0.6% - 41.1% + 2.9% - 28.9% - 37.2% + 13.0% - 31.9% + 6.0% 2022 2023 2024 2022 2023 2024 2022 2023 2024 + 5.6% + 3.6% + 2.6% + 13.9%
  • 5. Pending Sales Pending Sales Single Family Year-Over-Year Change Condo/TIC/ Coop Year-Over-Year Change Apr-2023 186 -30.9% 234 -31.8% May-2023 209 -16.1% 211 -36.4% Jun-2023 193 -2.0% 194 -25.4% Jul-2023 131 -27.6% 157 -29.3% Aug-2023 148 -18.2% 176 -24.1% Sep-2023 174 -7.9% 163 -23.5% Oct-2023 211 +8.2% 187 -15.4% Nov-2023 153 -7.8% 150 -6.3% Dec-2023 94 -19.0% 137 +11.4% Jan-2024 106 +21.8% 156 +26.8% Feb-2024 164 +30.2% 207 +18.3% Mar-2024 218 +29.8% 273 +11.9% 12-Month Avg 166 -6.5% 187 -15.2% Historical Pending Sales by Month Current as of April 11, 2024. All data from the San Francisco Association of REALTORS® MLS. Report © 2024 ShowingTime Plus, LLC. | 5 A count of the properties on which offers have been accepted in a given month. 287 437 168 244 218 273 Single Family Condo/TIC/Coop March 0 100 200 300 400 500 600 1-2005 1-2006 1-2007 1-2008 1-2009 1-2010 1-2011 1-2012 1-2013 1-2014 1-2015 1-2016 1-2017 1-2018 1-2019 1-2020 1-2021 1-2022 1-2023 1-2024 Single Family Condo/TIC/Coop 646 975 381 542 488 636 Single Family Condo/TIC/Coop Year to Date 2022 2023 2024 + 11.9% - 44.2% + 29.8% - 41.5% - 44.4% + 28.1% - 41.0% + 17.3% 2022 2023 2024 2022 2023 2024 2022 2023 2024 - 0.7% - 5.6% - 15.0% - 7.8%
  • 6. Sold Listings Sold Listings Single Family Year-Over-Year Change Condo/TIC/ Coop Year-Over-Year Change Apr-2023 174 -32.3% 217 -43.2% May-2023 189 -33.0% 232 -37.0% Jun-2023 205 -17.7% 208 -32.7% Jul-2023 159 -12.6% 166 -29.4% Aug-2023 151 -20.5% 160 -32.5% Sep-2023 145 -19.4% 170 -19.0% Oct-2023 201 +4.7% 190 -15.2% Nov-2023 193 +3.8% 154 -25.6% Dec-2023 121 -21.4% 164 +11.6% Jan-2024 91 -9.0% 116 +9.4% Feb-2024 141 +39.6% 184 +29.6% Mar-2024 166 +9.9% 189 -23.8% 12-Month Avg 161 -12.9% 179 -23.6% Historical Sold Listings by Month Current as of April 11, 2024. All data from the San Francisco Association of REALTORS® MLS. Report © 2024 ShowingTime Plus, LLC. | 6 A count of the actual sales that closed in a given month. 257 394 151 248 166 189 Single Family Condo/TIC/Coop March 0 100 200 300 400 500 1-2005 1-2006 1-2007 1-2008 1-2009 1-2010 1-2011 1-2012 1-2013 1-2014 1-2015 1-2016 1-2017 1-2018 1-2019 1-2020 1-2021 1-2022 1-2023 1-2024 Single Family Condo/TIC/Coop 546 830 352 496 398 489 Single Family Condo/TIC/Coop Year to Date 2022 2023 2024 - 23.8% - 37.1% + 9.9% - 41.2% - 40.2% + 13.1% - 35.5% - 1.4% 2022 2023 2024 2022 2023 2024 2022 2023 2024 - 5.2% - 8.2% - 17.4% - 13.8%
  • 7. Median Sales Price Median Sales Price Single Family Year-Over-Year Change Condo/TIC/ Coop Year-Over-Year Change Apr-2023 $1,560,500 -23.9% $1,175,000 -14.2% May-2023 $1,650,000 -17.8% $1,062,500 -12.6% Jun-2023 $1,600,000 -14.9% $1,117,500 -9.9% Jul-2023 $1,450,000 -13.0% $1,135,000 -5.2% Aug-2023 $1,575,000 -1.9% $1,084,193 +8.4% Sep-2023 $1,580,000 -4.2% $1,050,000 -9.5% Oct-2023 $1,650,000 -1.2% $1,155,000 -3.8% Nov-2023 $1,527,000 +1.8% $1,115,053 -0.9% Dec-2023 $1,450,000 -5.7% $995,000 +4.7% Jan-2024 $1,575,000 +15.2% $1,087,500 +9.5% Feb-2024 $1,575,000 +9.4% $1,115,000 -4.1% Mar-2024 $1,747,500 +3.1% $1,150,000 +8.5% 12-Month Avg* $1,576,000 -7.3% $1,100,000 -6.4% Historical Median Sales Price by Month * Median Sales Price for all properties from April 2023 through March 2024. This is not the average of the individual figures above. Current as of April 11, 2024. All data from the San Francisco Association of REALTORS® MLS. Report © 2024 ShowingTime Plus, LLC. | 7 Point at which half of the sales sold for more and half sold for less, not accounting for seller concessions, in a given month. $2,000,000 $1,206,750 $1,695,000 $1,060,000 $1,747,500 $1,150,000 Single Family Condo/TIC/Coop March $500,000 $750,000 $1,000,000 $1,250,000 $1,500,000 $1,750,000 $2,000,000 $2,250,000 1-2005 1-2006 1-2007 1-2008 1-2009 1-2010 1-2011 1-2012 1-2013 1-2014 1-2015 1-2016 1-2017 1-2018 1-2019 1-2020 1-2021 1-2022 1-2023 1-2024 Single Family Condo/TIC/Coop $1,867,500 $1,200,000 $1,526,500 $1,060,000 $1,650,000 $1,125,000 Single Family Condo/TIC/Coop Year to Date 2022 2023 2024 + 8.5% - 12.2% + 3.1% - 15.3% - 11.7% + 8.1% - 18.3% + 6.1% 2022 2023 2024 2022 2023 2024 2022 2023 2024 + 15.9% + 13.2% + 2.1% - 1.2%
  • 8. Average Sales Price Average Sales Price Single Family Year-Over-Year Change Condo/TIC/ Coop Year-Over-Year Change Apr-2023 $2,209,070 -12.0% $1,370,225 -7.1% May-2023 $2,141,045 -11.2% $1,171,111 -16.5% Jun-2023 $2,009,398 -14.7% $1,296,055 -5.1% Jul-2023 $1,835,021 -10.9% $1,213,203 -17.3% Aug-2023 $2,141,891 +10.0% $1,211,809 +3.1% Sep-2023 $2,012,607 +7.0% $1,342,704 -0.0% Oct-2023 $2,312,677 +4.6% $1,265,490 -10.8% Nov-2023 $2,014,207 +6.3% $1,241,516 -10.9% Dec-2023 $1,973,556 +5.5% $1,166,449 +6.2% Jan-2024 $2,245,947 +24.0% $1,438,048 +14.2% Feb-2024 $2,018,412 +10.7% $1,337,737 +3.2% Mar-2024 $2,304,876 +1.4% $1,285,116 +6.5% 12-Month Avg* $2,103,286 -1.9% $1,274,904 -5.3% Historical Average Sales Price by Month * Avg. Sales Price for all properties from April 2023 through March 2024. This is not the average of the individual figures above. Current as of April 11, 2024. All data from the San Francisco Association of REALTORS® MLS. Report © 2024 ShowingTime Plus, LLC. | 8 Average sales price for all closed sales, not accounting for seller concessions, in a given month. $2,534,210 $1,411,860 $2,272,702 $1,207,124 $2,304,876 $1,285,116 Single Family Condo/TIC/Coop March $500,000 $1,000,000 $1,500,000 $2,000,000 $2,500,000 $3,000,000 1-2005 1-2006 1-2007 1-2008 1-2009 1-2010 1-2011 1-2012 1-2013 1-2014 1-2015 1-2016 1-2017 1-2018 1-2019 1-2020 1-2021 1-2022 1-2023 1-2024 Single Family Condo/TIC/Coop $2,366,231 $1,385,259 $2,012,713 $1,243,915 $2,189,916 $1,341,195 Single Family Condo/TIC/Coop Year to Date 2022 2023 2024 + 6.5% - 14.5% + 1.4% - 10.3% - 10.2% + 8.8% - 14.9% + 7.8% 2022 2023 2024 2022 2023 2024 2022 2023 2024 + 14.6% + 10.0% + 4.9% + 3.1%
  • 9. Days on Market Until Sale Days on Market Until Sale Single Family Year-Over-Year Change Condo/TIC/ Coop Year-Over-Year Change Apr-2023 31 +93.8% 56 +75.0% May-2023 28 +33.3% 52 +40.5% Jun-2023 26 +52.9% 50 +28.2% Jul-2023 26 +23.8% 54 +10.2% Aug-2023 36 +38.5% 57 +14.0% Sep-2023 30 +7.1% 54 -6.9% Oct-2023 23 -17.9% 47 +9.3% Nov-2023 31 -11.4% 57 +11.8% Dec-2023 40 +5.3% 77 +4.1% Jan-2024 58 +16.0% 87 0.0% Feb-2024 35 +6.1% 51 -13.6% Mar-2024 27 -15.6% 49 -15.5% 12-Month Avg* 31 +18.1% 56 +16.7% Historical Days on Market Until Sale by Month * Days on Market for all properties from April 2023 through March 2024. This is not the average of the individual figures above. Current as of April 11, 2024. All data from the San Francisco Association of REALTORS® MLS. Report © 2024 ShowingTime Plus, LLC. | 9 Average number of days between when a property is listed and when an offer is accepted in a given month. 16 34 32 58 27 49 Single Family Condo/TIC/Coop March 0 20 40 60 80 100 120 1-2005 1-2006 1-2007 1-2008 1-2009 1-2010 1-2011 1-2012 1-2013 1-2014 1-2015 1-2016 1-2017 1-2018 1-2019 1-2020 1-2021 1-2022 1-2023 1-2024 Single Family Condo/TIC/Coop 24 42 37 64 37 59 Single Family Condo/TIC/Coop Year to Date 2022 2023 2024 - 15.5% + 70.6% - 15.6% + 100.0% + 52.4% 0.0% + 54.2% - 7.8% 2022 2023 2024 2022 2023 2024 2022 2023 2024 - 38.5% - 25.0% - 30.0% - 29.2%
  • 10. Inventory of Active Listings Inventory of Active Listings Single Family Year-Over-Year Change Condo/TIC/ Coop Year-Over-Year Change Apr-2023 343 +2.1% 789 -29.0% May-2023 357 +7.9% 807 -28.0% Jun-2023 324 -13.6% 793 -28.1% Jul-2023 315 -14.2% 765 -25.1% Aug-2023 344 -2.3% 702 -21.7% Sep-2023 484 -0.2% 980 -11.3% Oct-2023 455 -4.0% 981 -10.6% Nov-2023 340 -9.3% 817 -6.3% Dec-2023 180 -16.7% 491 -6.1% Jan-2024 219 -15.8% 604 -7.6% Feb-2024 254 -10.6% 713 -1.8% Mar-2024 252 -21.3% 723 -6.6% 12-Month Avg* 322 -7.4% 764 -16.7% Historical Inventory of Active Listings by Month * Active Listings for all properties from April 2023 through March 2024. This is not the average of the individual figures above. Current as of April 11, 2024. All data from the San Francisco Association of REALTORS® MLS. Report © 2024 ShowingTime Plus, LLC. | 10 The number of properties available for sale in active status at the end of a given month. 315 1,048 320 774 252 723 Single Family Condo/TIC/Coop March 0 500 1,000 1,500 2,000 2,500 1-2005 1-2006 1-2007 1-2008 1-2009 1-2010 1-2011 1-2012 1-2013 1-2014 1-2015 1-2016 1-2017 1-2018 1-2019 1-2020 1-2021 1-2022 1-2023 1-2024 Single Family Condo/TIC/Coop 2022 2023 2024 - 6.6% - 26.1% - 21.3% + 1.6% 2022 2023 2024 - 14.2% - 8.8%
  • 11. % of Properties Sold Over List Price % of Properties Sold Over List Price Single Family Year-Over-Year Change Condo/TIC/ Coop Year-Over-Year Change Apr-2023 62.1% -30.0% 32.7% -47.9% May-2023 63.0% -27.5% 40.9% -26.0% Jun-2023 69.8% -19.1% 37.5% -34.6% Jul-2023 66.7% -15.1% 30.7% -22.5% Aug-2023 64.2% -14.7% 31.3% -15.6% Sep-2023 69.0% +2.7% 31.2% +0.6% Oct-2023 67.7% +5.6% 34.2% -8.8% Nov-2023 62.2% +8.2% 33.1% +8.9% Dec-2023 54.5% +11.9% 22.1% +41.7% Jan-2024 50.5% +14.8% 19.8% +4.8% Feb-2024 63.1% +22.5% 34.2% +21.3% Mar-2024 68.7% +10.3% 36.0% -0.8% 12-Month Avg 64.3% -10.1% 32.8% -22.3% Historical % of Properties Sold Over List Price by Month * % of Properties Sold Over List Price for all properties from April 2023 through March 2024. This is not the average of the individual figures above. Current as of April 11, 2024. All data from the San Francisco Association of REALTORS® MLS. Report © 2024 ShowingTime Plus, LLC. | 11 Percentage found when dividing the number of properties sold by properties sold over its original list price, not accounting for seller concessions. 86.4% 58.1% 62.3% 36.3% 68.7% 36.0% Single Family Condo/TIC/Coop March 0.0% 20.0% 40.0% 60.0% 80.0% 100.0% 1-2005 1-2006 1-2007 1-2008 1-2009 1-2010 1-2011 1-2012 1-2013 1-2014 1-2015 1-2016 1-2017 1-2018 1-2019 1-2020 1-2021 1-2022 1-2023 1-2024 Single Family Condo/TIC/Coop 83.9% 53.9% 54.0% 30.2% 62.6% 31.5% Single Family Condo/TIC/Coop Year to Date 2022 2023 2024 - 0.8% - 37.5% + 10.3% - 27.9% - 44.0% + 15.9% - 35.6% + 4.3% 2022 2023 2024 2022 2023 2024 2022 2023 2024 + 17.1% + 23.6% + 53.6% + 35.4%
  • 12. % of List Price Received % of List Price Received Single Family Year-Over-Year Change Condo/TIC/ Coop Year-Over-Year Change Apr-2023 107.1% -13.0% 99.9% -6.8% May-2023 108.2% -9.5% 100.1% -5.5% Jun-2023 108.6% -7.0% 100.6% -4.5% Jul-2023 108.3% -2.4% 99.6% -1.9% Aug-2023 107.2% -1.0% 99.5% -1.2% Sep-2023 107.6% -0.8% 99.0% -1.6% Oct-2023 107.9% +0.7% 99.7% -0.7% Nov-2023 106.0% +1.0% 100.1% +0.9% Dec-2023 104.3% +1.4% 99.0% +0.9% Jan-2024 104.6% +1.4% 96.7% -1.2% Feb-2024 107.9% +4.1% 100.5% +1.5% Mar-2024 110.1% +2.0% 101.2% +0.8% 12-Month Avg* 107.5% -3.5% 99.8% -2.5% Historical % of List Price Received by Month * % of List Price Received for all properties from April 2023 through March 2024. This is not the average of the individual figures above. Current as of April 11, 2024. All data from the San Francisco Association of REALTORS® MLS. Report © 2024 ShowingTime Plus, LLC. | 12 Percentage found when dividing a property’s sales price by its most recent list price, then taking the average for all properties sold in a given month, not accounting for seller concessions. 121.9% 106.4% 107.9% 100.4% 110.1% 101.2% Single Family Condo/TIC/Coop March 120.6% 105.1% 105.4% 99.5% 108.0% 99.9% Single Family Condo/TIC/Coop Year to Date 90.0% 100.0% 110.0% 120.0% 130.0% 1-2005 1-2006 1-2007 1-2008 1-2009 1-2010 1-2011 1-2012 1-2013 1-2014 1-2015 1-2016 1-2017 1-2018 1-2019 1-2020 1-2021 1-2022 1-2023 1-2024 Single Family Condo/TIC/Coop 2022 2023 2024 + 0.8% - 5.6% + 2.0% - 11.5% 2022 2023 2024 + 8.7% + 3.9% 2022 2023 2024 + 0.4% - 5.3% + 2.5% - 12.6% 2022 2023 2024 + 10.0% + 4.2%
  • 13. Housing Affordability Ratio Housing Affordability Ratio Single Family Year-Over-Year Change Condo/TIC/ Coop Year-Over-Year Change Apr-2023 26 +23.8% 40 +8.1% May-2023 25 +13.6% 43 +2.4% Jun-2023 25 +8.7% 41 +2.5% Jul-2023 27 0.0% 39 -9.3% Aug-2023 24 -14.3% 40 -21.6% Sep-2023 24 0.0% 41 +5.1% Oct-2023 22 -4.3% 35 -5.4% Nov-2023 25 -7.4% 38 -5.0% Dec-2023 28 +3.7% 46 -6.1% Jan-2024 26 -16.1% 42 -12.5% Feb-2024 25 -10.7% 40 0.0% Mar-2024 23 -8.0% 39 -11.4% 12-Month Avg* 25 -10.0% 40 -7.8% Historical Housing Affordability Ratio by Month * Affordability Ratio for all properties from April 2023 through March 2024. This is not the average of the individual figures above. Current as of April 11, 2024. All data from the San Francisco Association of REALTORS® MLS. Report © 2024 ShowingTime Plus, LLC. | 13 This index measures housing affordability for the region. For example, an index of 120 means the median household income is 120% of what is necessary to qualify for the median-priced home under prevailing interest rates. A higher number means greater affordability. 24 45 25 44 23 39 Single Family Condo/TIC/Coop March 20 40 60 80 100 1-2005 1-2006 1-2007 1-2008 1-2009 1-2010 1-2011 1-2012 1-2013 1-2014 1-2015 1-2016 1-2017 1-2018 1-2019 1-2020 1-2021 1-2022 1-2023 1-2024 Single Family Condo/TIC/Coop 2022 2023 2024 - 11.4% - 2.2% - 8.0% + 4.2% 2022 2023 2024 - 25.0% - 13.5% 25 45 27 44 24 40 Single Family Condo/TIC/Coop Year to Date 2022 2023 2024 - 9.1% - 2.2% - 11.1% + 8.0% 2022 2023 2024 - 24.2% - 16.7%
  • 14. Months Supply of Inventory Months Supply of Inventory Single Family Year-Over-Year Change Condo/TIC/ Coop Year-Over-Year Change Apr-2023 2.0 +42.9% 3.7 +15.6% May-2023 2.1 +50.0% 4.0 +21.2% Jun-2023 1.9 +18.8% 4.0 +17.6% Jul-2023 1.9 +18.8% 4.0 +25.0% Aug-2023 2.2 +37.5% 3.8 +31.0% Sep-2023 3.1 +34.8% 5.4 +45.9% Oct-2023 2.9 +26.1% 5.5 +41.0% Nov-2023 2.1 +10.5% 4.6 +39.4% Dec-2023 1.1 0.0% 2.7 +35.0% Jan-2024 1.4 +7.7% 3.3 +22.2% Feb-2024 1.6 +6.7% 3.9 +25.8% Mar-2024 1.5 -16.7% 3.9 +11.4% 12-Month Avg* 2.0 +21.7% 4.1 +27.7% Historical Months Supply of Inventory by Month * Months Supply for all properties from April 2023 through March 2024. This is not the average of the individual figures above. Current as of April 11, 2024. All data from the San Francisco Association of REALTORS® MLS. Report © 2024 ShowingTime Plus, LLC. | 14 The inventory of homes for sale at the end of a given month, divided by the average monthly pending sales from the last 12 months. 1.3 2.9 1.8 3.5 1.5 3.9 Single Family Condo/TIC/Coop March 0.0 2.0 4.0 6.0 8.0 10.0 12.0 1-2005 1-2006 1-2007 1-2008 1-2009 1-2010 1-2011 1-2012 1-2013 1-2014 1-2015 1-2016 1-2017 1-2018 1-2019 1-2020 1-2021 1-2022 1-2023 1-2024 Single Family Condo/TIC/Coop 2022 2023 2024 + 11.4% + 20.7% - 16.7% + 38.5% 2022 2023 2024 - 18.8% - 27.5%
  • 15. All Properties Activity Overview Key metrics by report month and for year-to-date (YTD) starting from the first of the year. Key Metrics Historical Sparkbars 3-2023 3-2024 Percent Change YTD 2023 YTD 2024 Percent Change + 8.3% Pending Sales 422 499 + 18.2% 938 1,142 + 21.7% New Listings 611 617 + 1.0% 1,624 1,759 Sold Listings 409 361 - 11.7% 861 901 + 4.6% Median Sales Price $1,315,000 $1,385,000 + 5.3% $1,275,000 $1,350,000 + 5.9% + 9.9% 49 - 7.5% $1,714,014 -- -- Days on Market 48 39 - 18.8% 53 Avg. Sales Price $1,606,682 $1,752,469 + 9.1% $1,559,326 Active Listings 1,114 991 - 11.0% -- % of Properties Sold Over List Price 45.7% 51.5% + 12.7% 40.1% 30 45.7% + 14.0% + 1.6% 26 - 13.3% 103.5% % of List Price Received 103.1% 105.3% + 2.1% 101.9% Current as of April 11, 2024. All data from the San Francisco Association of REALTORS® MLS. Report © 2024 ShowingTime Plus, LLC. | 15 Months Supply 2.8 2.8 0.0% -- -- -- Affordability Ratio 29 26 - 10.3% 3-2021 3-2022 3-2023 3-2024 3-2021 3-2022 3-2023 3-2024 3-2021 3-2022 3-2023 3-2024 3-2021 3-2022 3-2023 3-2024 3-2021 3-2022 3-2023 3-2024 3-2021 3-2022 3-2023 3-2024 3-2021 3-2022 3-2023 3-2024 3-2021 3-2022 3-2023 3-2024 3-2021 3-2022 3-2023 3-2024 3-2021 3-2022 3-2023 3-2024 3-2021 3-2022 3-2023 3-2024
  • 16. Activity by District SF District 1: Northwest (Sea Cliff, Lake, Jordan Park / Laurel Heights, Outer Richmond, Central Richmond, Inner Richmond, Lone Mountain) SF District 2: Central West (Outer Sunset, Central Sunset, Inner Sunset, Outer Parkside, Parkside, Inner Parkside, Golden Gate Heights) SF District 3: Southwest (Pine Lake Park, Lake Shore, Merced Manor, Stonestown, Lakeside, Merced Heights, Ingleside, Ingleside Heights, Oceanview) SF District 4: Twin Peaks W (Forest Hill (& Ext), W Portal, St Francis Wd, Balboa Terr, Mt Dav Manor, Ingleside Terr, Monterey Hts, Wstwd Pk & H'lnds, Shrwd Fst, Miraloma Pk, Dmnd Hts, Mdtwn Terr) SF District 5: Central (Haight Ashbury, Cole Vly / Prnssus Hts, Clarndn Hts, Corona Hts, Twin Pks, Glen Pk, Noe Vly, Eureka Vly / Dolores Hts, Mission Dolores, Duboce Trngl, Buena Vista / Ashbury Hts) SF District 6: Central North (Lower Pacific Heights, Anza Vista, Western Addition, North Panhandle, Alamo Square, Hayes Valley) SF District 7: North (Marina, Cow Hollow, Presidio Heights, Pacific Heights) SF District 8: Northeast (North Waterfront, North Beach, Russian Hill, Telegraph Hill, Nob Hill, Financial District / Barbary Coast, Downtown, Van Ness / Civic Center, Tenderloin) SF District 9: Central East (Yerba Buena, South Beach, South of Market, Mission Bay, Inner Mission, Potrero Hill, Central Waterfront / Dogpatch, Bernal Heights) SF District 10: Southeast (Outer Mission, Mission Terr, Excelsior, Portola, Bayview, Silver Terr, Hunters Pt, Candlestick Pt, Bayview Hts, Little Hollywood, Visitation Vly, Crocker Amazon) 3-2023 3-2024 + / – 3-2023 3-2024 + / – 3-2023 3-2024 + / – 3-2023 3-2024 + / – 3-2023 3-2024 + / – Single Family 1 SF District 1 19 21 +10.5% 15 19 +26.7% $2,705,000 $2,020,000 -25.3% 25 26 +4.0% 1.3 1.3 0.0% 2 SF District 2 40 27 -32.5% 25 29 +16.0% $1,600,000 $1,550,000 -3.1% 28 22 -21.4% 1.1 0.9 -18.2% 3 SF District 3 19 13 -31.6% 13 13 0.0% $1,215,000 $1,550,000 +27.6% 34 26 -23.5% 1.6 1.1 -31.3% 4 SF District 4 22 23 +4.5% 23 23 0.0% $1,900,000 $1,950,000 +2.6% 28 17 -39.3% 0.9 1.0 +11.1% 5 SF District 5 48 37 -22.9% 19 27 +42.1% $2,600,000 $2,620,000 +0.8% 30 41 +36.7% 1.9 1.7 -10.5% 6 SF District 6 8 2 -75.0% 0 3 -- $0 $3,950,000 -- 0 22 -- 3.6 0.6 -83.3% 7 SF District 7 42 40 -4.8% 6 11 +83.3% $4,429,000 $4,351,000 -1.8% 57 22 -61.4% 6.5 4.2 -35.4% 8 SF District 8 12 6 -50.0% 2 5 +150.0% $6,025,000 $1,298,000 -78.5% 189 24 -87.3% 4.4 2.6 -40.9% 9 SF District 9 37 30 -18.9% 19 13 -31.6% $1,625,000 $1,695,000 +4.3% 29 26 -10.3% 2.1 1.8 -14.3% 10 SF District 10 73 53 -27.4% 29 23 -20.7% $1,170,000 $1,100,000 -6.0% 32 37 +15.6% 2.0 1.7 -15.0% Condo/TIC/Coop 1 SF District 1 24 20 -16.7% 16 4 -75.0% $1,090,000 $1,382,000 +26.8% 28 33 +17.9% 2.0 2.3 +15.0% 2 SF District 2 12 8 -33.3% 7 5 -28.6% $925,000 $1,440,000 +55.7% 28 41 +46.4% 3.3 2.5 -24.2% 3 SF District 3 6 3 -50.0% 4 2 -50.0% $577,500 $678,000 +17.4% 35 16 -54.3% 2.1 1.6 -23.8% 4 SF District 4 15 8 -46.7% 2 3 +50.0% $735,000 $823,500 +12.0% 34 71 +108.8% 6.2 2.0 -67.7% 5 SF District 5 75 59 -21.3% 44 33 -25.0% $1,420,000 $1,352,000 -4.8% 35 25 -28.6% 1.8 1.9 +5.6% 6 SF District 6 69 46 -33.3% 28 13 -53.6% $1,470,000 $1,130,000 -23.1% 42 37 -11.9% 2.8 2.5 -10.7% 7 SF District 7 66 63 -4.5% 20 20 0.0% $1,338,000 $1,899,000 +41.9% 39 43 +10.3% 2.9 3.1 +6.9% 8 SF District 8 175 188 +7.4% 43 38 -11.6% $960,000 $1,250,000 +30.2% 72 54 -25.0% 4.7 5.0 +6.4% 9 SF District 9 305 293 -3.9% 77 67 -13.0% $978,000 $995,000 +1.7% 66 62 -6.1% 4.4 5.1 +15.9% 10 SF District 10 27 35 +29.6% 7 4 -42.9% $698,000 $401,500 -42.5% 248 82 -66.9% 5.1 7.5 +47.1% Key metrics by report month for the districts of San Francisco. Current as of April 11, 2024. All data from the San Francisco Association of REALTORS® MLS. Report © 2024 ShowingTime Plus, LLC. | 16 Active Listings Sold Listings Median Sales Price Days on Market Months Supply