Download to read offline

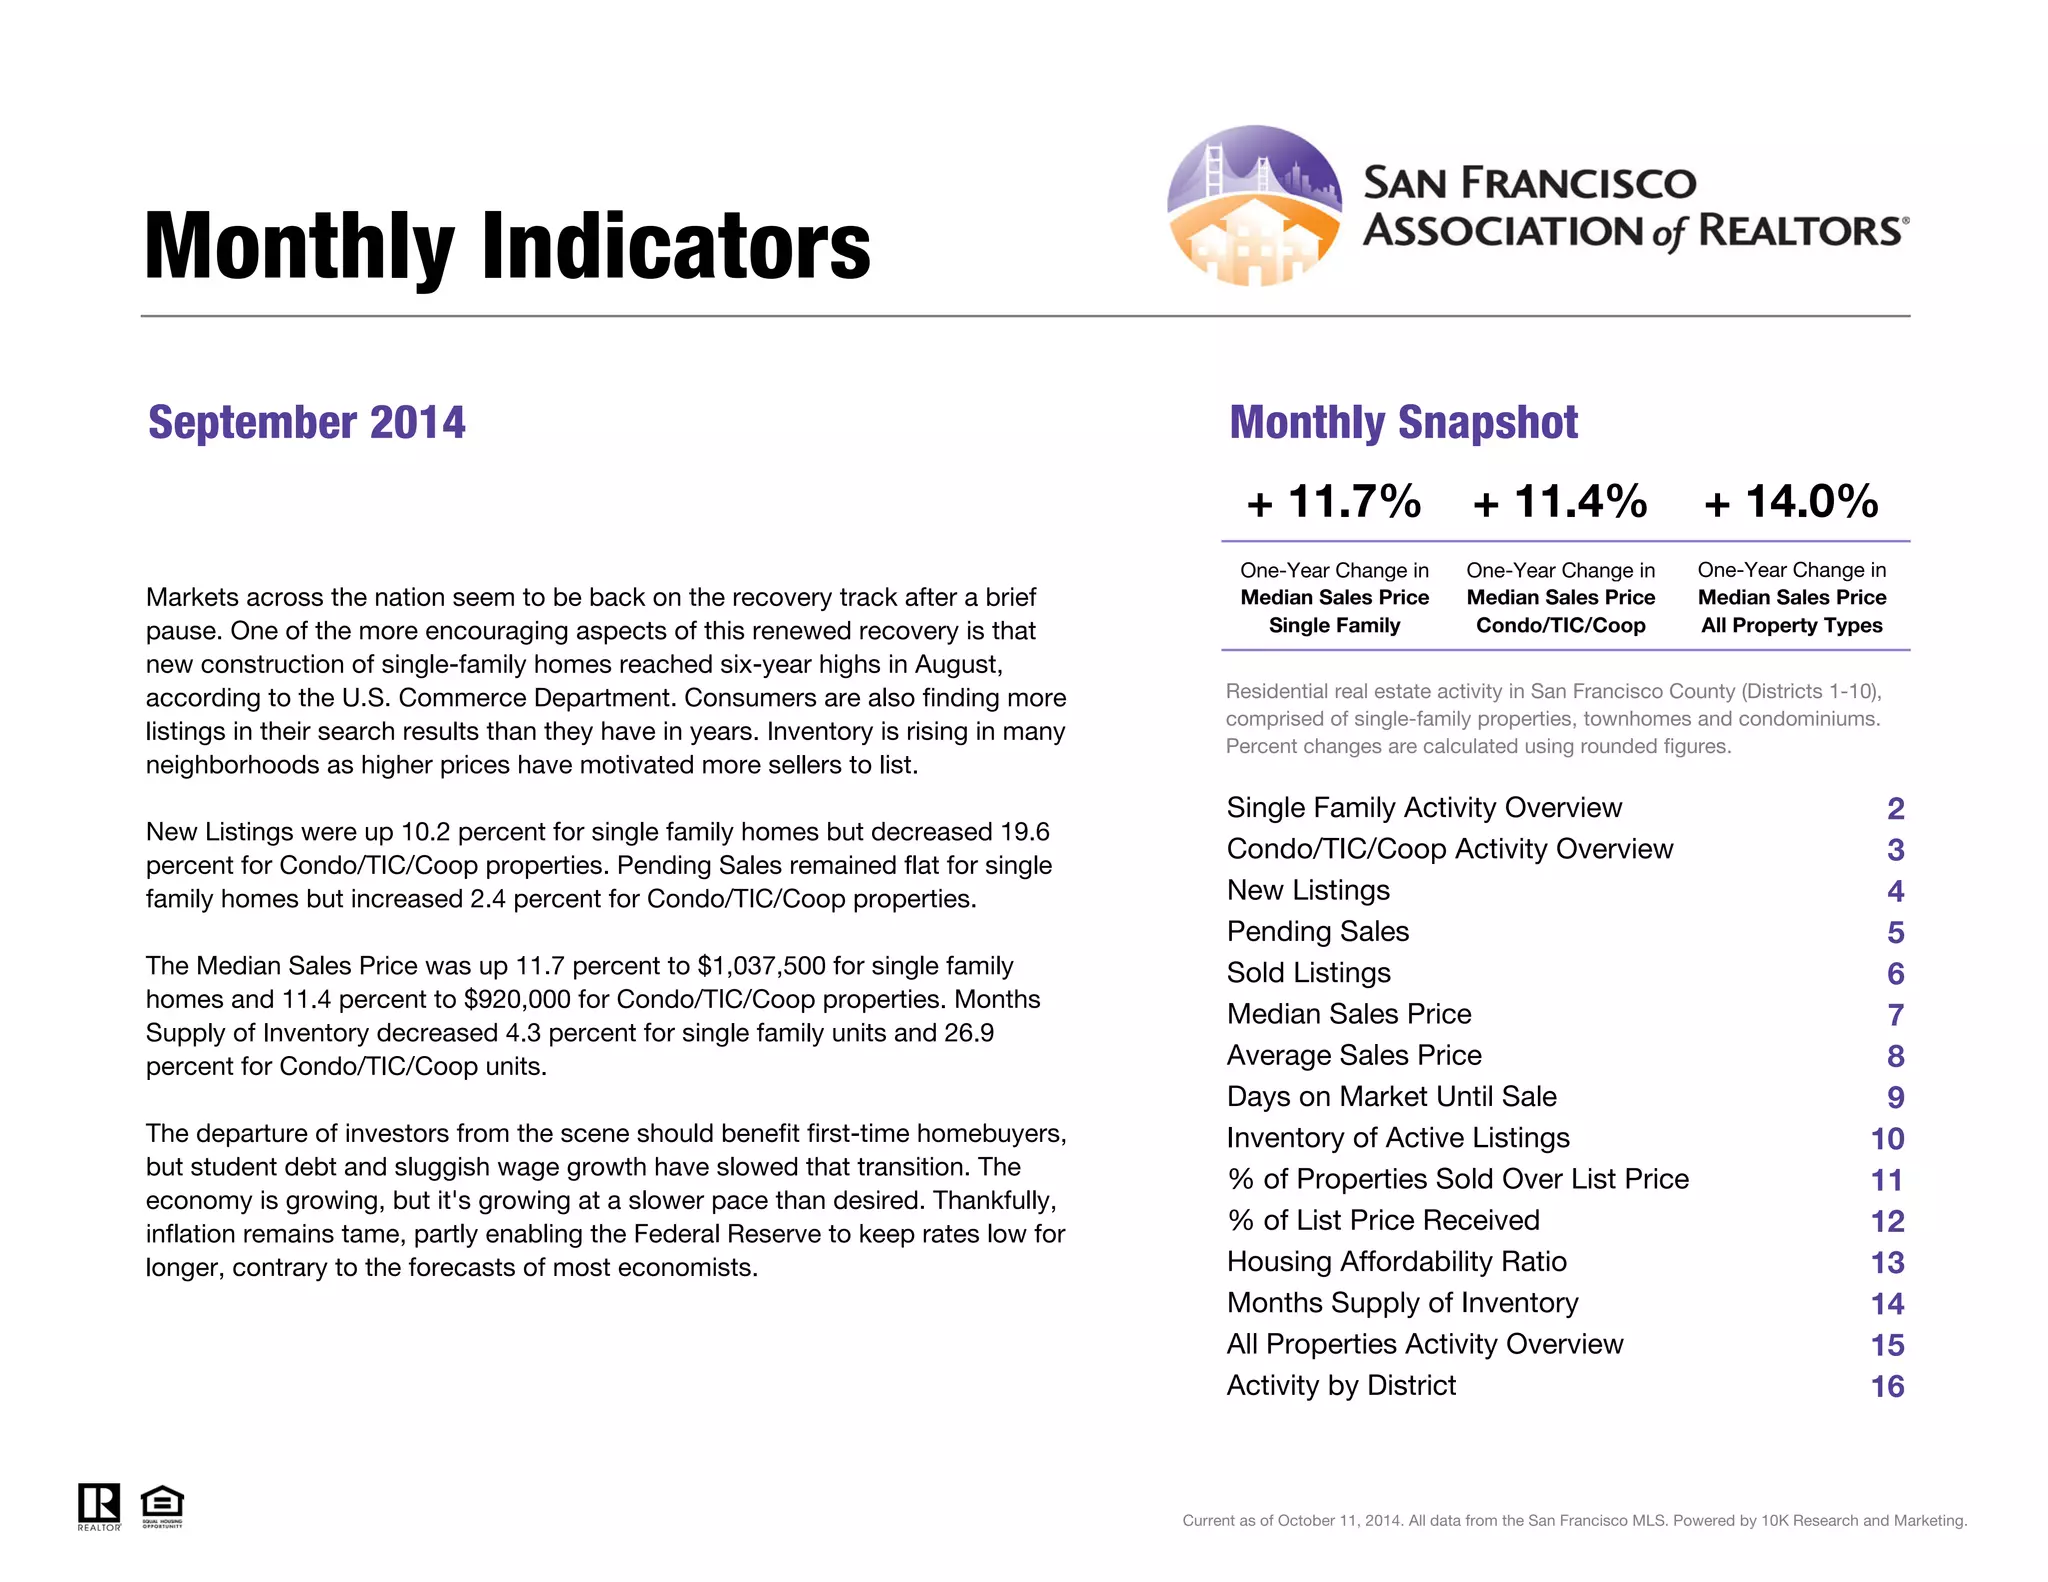
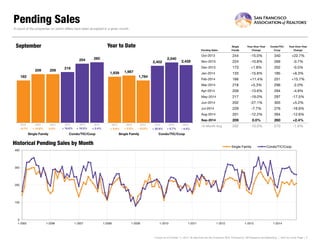
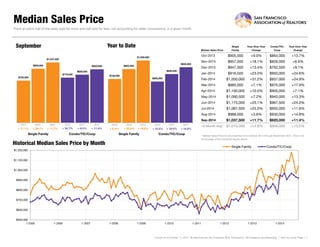
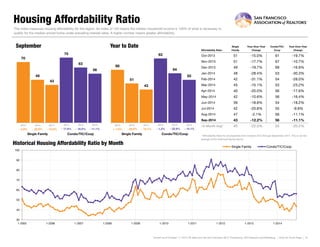
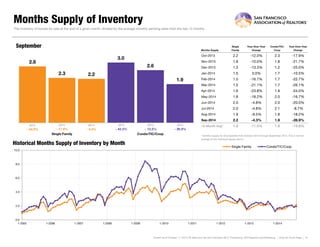

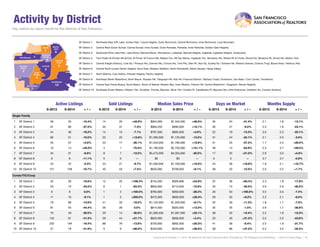

This document provides a monthly snapshot of residential real estate activity in San Francisco County for September 2014. It finds that the median sales price for single family homes increased 11.7% compared to the previous year, while the median sales price for condos increased 11.4%. Overall real estate markets appear to be continuing their recovery, with new construction reaching six-year highs and rising inventory providing more options for buyers. However, factors like student debt and wage growth are slowing the transition to homeownership for some.


