In 2015, the national residential real estate market performed well overall with healthy supply and demand driven by low interest rates and improved employment. Housing markets have shown resilience to recent interest rate increases. The San Francisco residential real estate market saw increases in median home prices in 2015, with single family home prices up 12% and condo prices up 18.7% compared to 2014. Both new listings and pending sales declined in December 2015 compared to the previous year.
Residential real estate activity in San Francisco saw decreases in new listings and pending sales in January 2016 compared to the previous year. The median sales price increased 19.0% year-over-year for single family homes and 17.8% for condos. Inventory decreased for single family homes but increased for condos. Overall, the real estate market remained strong with continued price increases and steady activity levels.
The document summarizes residential real estate activity in San Francisco County for July 2016. It reports that the median sales price increased 6.4% year-over-year for single family homes and 1.0% for condos. New listings were down 23.0% for single family homes and 26.5% for condos year-over-year. Pending sales decreased 20.1% for single family homes but increased 0.4% for condos. Low housing supply has prevented further sales growth despite low mortgage rates and unemployment, as inventory constraints are limiting buyer options and contributing to price increases.
Residential real estate activity in San Francisco decreased in August 2016. New listings and pending sales declined for both single family homes and condos/co-ops compared to the previous year. The median sales price increased slightly for single family homes but decreased for condos/co-ops. Low inventory continued to be a challenge, putting upward pressure on home prices.
The document is a monthly snapshot report of residential real estate activity in San Francisco County for November 2015. It provides key metrics and comparisons to prior months and years for single family homes and condo/co-op properties. The report shows that housing demand remains healthy and home sales are projected to have their best year since 2006. However, low inventory levels and rising interest rates may constrain further large price increases in 2016. Median sales prices in November 2015 were up 15% for single family homes and 10.3% for condos compared to a year ago.
- Residential real estate activity in San Francisco saw a 26.5% year-over-year increase in the median sales price of single family homes to $1,410,000 in February 2016, though the median price of condos decreased 0.5% to $1,095,000.
- Inventory levels decreased for single family properties but increased for condos, while new listings were down 18.5% and 9.1% respectively and pending sales decreased for single family but increased for condos.
- Low inventory continues to be a key issue, constraining further growth in sales activity despite strong demand, low interest rates, and economic growth.
Residential real estate activity in San Francisco saw increases in median sales prices in May 2015 compared to the previous year. The median sales price for single family homes rose 28.4% to $1,400,000, while the median price for condos rose 19.7% to $1,125,000. New listings and pending sales declined compared to the previous year, falling 22.9% and 4.2% respectively for single family homes.
- The median sales price for single family homes increased 6.2% year-over-year to $1,115,000, while the median sales price for condos increased 17.4% to $1,100,000.
- New listings decreased for both single family homes and condos compared to February 2014. Pending sales also decreased for both property types compared to the previous year.
- The number of sold properties decreased for both single family homes and condos in February 2015 versus February 2014.
Halfway through 2016, the San Francisco residential real estate market is performing as expected, with sales and prices up in most areas while inventory remains low. Specifically:
- Median sales prices increased 3.8% for single-family homes and 7% for condos over the past year.
- New listings were down 21% for single-family but up 13% for condos. Pending sales fell 1% for single-family and 16% for condos.
- Months of supply decreased 5% for single-family but increased 58% for condos, indicating the inventory issue is more pronounced in the condo market.
The document provides detailed data on housing activity and market metrics in San
Residential real estate activity in San Francisco saw increases in median sales prices in October 2015 compared to the previous year. The median sales price for single family homes rose 8.4% to $1,290,000, while the median price for condos increased 15.7% to $1,105,000. New listings were down slightly while pending sales remained flat for single family homes and decreased for condos. Inventory levels decreased for single family but increased for condos.
Residential real estate activity in San Francisco saw increases in the first half of 2015 compared to the same period last year. The median sales price for single-family homes rose 10.7% to $1,301,000, while condos rose 15.2% to $1,100,000. New listings declined for both segments, down 19.1% for single-family and 26.2% for condos. Pending sales rose 10.5% for single-family but fell 9.1% for condos. Inventory levels decreased across the board, dropping over 25% for both single-family and condo units.
- Residential real estate activity in San Francisco saw median home sale prices increase 5.4% year-over-year for single family homes but decrease 2.6% for condos from September 2015 to September 2016.
- New listings were down slightly while pending sales decreased more significantly, and months of inventory increased, indicating a softening market.
- Demand has remained high through 2016 due to factors like millennials buying homes and low interest rates, but lower inventory and months of supply point to a cooling real estate market.
The document provides a monthly snapshot of residential real estate activity in San Francisco for January 2015. Key metrics are presented for single family homes and condos/co-ops. The median sales price increased 5.4% for single family homes but decreased 2.4% for condos/co-ops compared to January 2014. New listings and pending sales declined year-over-year for both categories in January 2015. The months supply of inventory decreased for both single family homes and condos/co-ops compared to the previous year.
The monthly snapshot report summarizes real estate activity in San Francisco for September 2015. Median home prices rose 14.6% for single family homes and 17.5% for condos year-over-year. New listings fell 21.7% for single family but rose 1.3% for condos. Pending sales were down for both. The report concludes that the housing market remains healthy with continued job growth and low interest rates.
- Home prices rose significantly in San Francisco year-over-year in August 2015, with median sales prices up 26.6% for single family homes and 12.4% for condos.
- Residential real estate activity decreased from the previous year, with new listings down 16.0% for single family homes and 21.6% for condos, and pending sales down 3.9% and 10.5% respectively.
- The report analyzed various housing market metrics and found that while activity was lower than the previous year, prices remained substantially higher, indicating the market remains strong despite less inventory.
Residential real estate activity in San Francisco remained strong in November 2016, with certain metrics showing year-over-year increases. The median sales price of single-family homes rose 8.1% compared to November 2015, though the median price for condos fell 7.2%. New listings were down 21.7% for single-family homes and 31.3% for condos year-over-year. Pending sales rose 17.7% for single-family homes and 10.9% for condos. The housing market outlook remains uncertain following the presidential election.
The real estate market in San Francisco remained strong in April 2016, with several key metrics showing year-over-year increases. The median sales price rose 7.1% for single family homes to $1,400,000, and increased 6.6% for condos to $1,149,000. Meanwhile, new listings declined slightly while inventory levels were up. Overall the market conditions were described as predictable with low interest rates and steady price increases in desirable areas.
The document provides residential real estate statistics for San Francisco for April 2015. It summarizes that new listings decreased 14.1% for single family homes and 15.8% for condos from the previous year. Median sales prices increased substantially, up 20.6% for single family homes to $1,326,500 and 21.7% for condos to $1,101,000. Months of inventory decreased for both single family homes and condos compared to the previous year.
Residential real estate activity in San Francisco saw increases in median sales prices and pending sales in March 2015 compared to the previous year. The median sales price for single family homes rose 27.6% to $1,250,000, while the median price for condos increased 14% to $1,100,000. Pending sales for single family homes were up 6%, though pending sales for condos fell slightly by 0.7%. New listings declined for both single family homes and condos. Overall the real estate market in San Francisco remained strong with higher prices and sales activity despite reductions in inventory.
San Francisco Real Estate Market Report August 2014Ronny Budiutama
- Residential real estate activity in San Francisco saw a 4.4% increase in the median sales price for single family homes and a 14.8% increase for condos from the previous year in August 2014.
- New listings were down 28.3% for single family homes and 36.7% for condos compared to August 2013, while pending sales decreased 14.4% and 14.2% respectively.
- Sustained job growth, lower mortgage rates, and a slow rise in home inventory have helped drive increased housing demand despite some monthly fluctuations in the market.
San Francisco Real Estate Housing Market January 2017Ronny Budiutama
- Residential real estate activity in San Francisco saw an increase in the median sales price of single family homes of 7.1% in January 2017 compared to January 2016, but a decrease of 5.7% for condominiums.
- New listings were down 24.6% for single family homes and 7.5% for condominiums in January 2017 versus January 2016.
- Pending sales decreased 9.1% for single family homes but increased 0.7% for condominiums in January 2017 compared to January 2016.
Residential real estate activity in San Francisco decreased in October 2016 compared to the previous year. The median sales price increased 11% for single family homes but only 4.5% for condos. New listings and pending sales declined over 22% and 15% respectively for single family properties, and 16% and 14% for condos. Inventory levels rose for both market segments as demand softened amid low housing supply.
The document provides a monthly snapshot of real estate activity in San Francisco for July 2015. Some key points:
- Median home sale prices increased 18.8% year-over-year for single family homes and 6.3% for condos.
- New property listings declined 17.7% for single family homes and 32.9% for condos compared to the previous year.
- Pending home sales decreased 9.7% for single family homes and 13.5% for condos over the same period.
- The housing market showed signs of stability and strength despite a continued low national homeownership rate near 50-year lows.
The document provides a monthly snapshot of real estate activity in San Francisco for August 2017. It summarizes that median home sale prices increased 10.4% for single family homes and 10.8% for condos from the previous year. New listings and pending sales decreased compared to the previous year, while months of inventory available also decreased. The prevailing housing trends from the summer were expected to continue as economic factors have remained stable in recent years.
This document provides a monthly snapshot of residential real estate activity in San Francisco County for September 2014. It finds that the median sales price for single family homes increased 11.7% compared to the previous year, while the median sales price for condos increased 11.4%. Overall real estate markets appear to be continuing their recovery, with new construction reaching six-year highs and rising inventory providing more options for buyers. However, factors like student debt and wage growth are slowing the transition to homeownership for some.
San Francisco Real Estate Housing Market December 2016Ronny Budiutama
The document provides a monthly snapshot of residential real estate activity in San Francisco County for December 2016. Some key highlights include:
- Median sales prices for single family homes increased 8.9% year-over-year while median prices for condos decreased 8.3%.
- New listings and pending sales were down significantly year-over-year for both single family homes and condos.
- Months of inventory decreased while average and median sales prices generally increased, suggesting an ongoing seller's market with high demand and low supply.
The document provides a monthly snapshot of residential real estate activity in San Francisco for January 2018. Key points include:
- New listings were down 18.1% for single family homes and 19.1% for condos compared to January 2017.
- Pending sales decreased 7.5% for single family but increased 21.5% for condos compared to last year.
- Median sales prices rose 6.4% for single family homes to $1,330,000 and 9.5% for condos to $1,095,000 over the same period.
The document provides a monthly snapshot of residential real estate activity in San Francisco for August 2018. It summarizes key metrics like median sales prices, inventory levels, new and pending listings, and sales for both single family homes and condominiums/co-ops. The data shows increases in median sales prices and pending sales for condos/co-ops from the previous year, while new and sold listings, as well as median prices decreased for single family homes compared to August 2017.
August 2015 Greater Boston Real Estate Market Trends ReportUnit Realty Group
The document provides an overview of housing market indicators for the Greater Boston region in August 2015. Key points include:
- Closed home sales increased 13.5% year-over-year for single-family homes and 4.6% for condominiums.
- The median sales price was up 2.0% to $499,900 for single-family homes and 9.8% to $460,000 for condominiums.
- Inventory levels decreased with months supply of inventory down 23.3% for single-family homes and 17.5% for condominiums.
This document describes Pablo, his family, and their characteristics. Pablo is 11 years old and lives in Emperador. He has a sister named Marta, and his parents are Guillermo and Nuria. The family also includes Pablo's Aunt Carmen. The document provides details about each family member such as their names, appearances, abilities and occupations.
Manter uma boa higiene oral é importante para crianças e adultos, mas as crianças precisam de ajuda dos pais para lavar os dentes corretamente. Os pais devem usar escovas de dentes adequadas à idade da criança, mostrar-lhes como lavar os dentes e fazê-lo com elas até os 3 anos de idade. É importante lavar os dentes de manhã e à noite, especialmente à noite para remover bactérias que se acumulam durante o sono.
This document provides an overview of the course materials and assignments for PSY 220 Positive Psychology. It includes summaries of topics covered in each of the 9 weeks such as subjective well-being, relationships, goals, character strengths, and optimism. Students are asked to complete discussion posts, papers, and an action plan presentation applying concepts from the course to analyze real world examples and their own lives. The goal is for students to learn about positive psychology and ways to increase well-being.
Slideshare es un servicio para compartir presentaciones en formato PowerPoint, permitiendo a los usuarios subir, ver y comentar presentaciones de otros, así como crear grupos de trabajo y eventos, funcionando como una red social para presentaciones.
This document contains a list of categories and corresponding URLs for products available at the sports fan shop website www.sports-fan-shop.net. The categories include baseball, basketball, football, and soccer equipment, apparel, and merchandise. Specific products listed include balls, bats, gloves, uniforms, hats, memorabilia, footwear and more for each of the four sports.
El documento describe los conceptos de sistemas, subsistemas y sus interrelaciones. Un sistema se define como un conjunto de elementos que interactúan entre sí para lograr un objetivo. Los sistemas pueden estar compuestos de subsistemas, que son sistemas más pequeños dentro de sistemas mayores. La definición de fronteras entre sistemas es difícil dado el continuo intercambio de energía e información entre un sistema y su entorno.
PowerPoint es una herramienta que permite crear presentaciones mediante diapositivas ordenadas, donde se puede agregar texto, imágenes, efectos y transiciones. Las presentaciones deben ser claras y enfocadas para mantener la atención del público, por lo que no se recomienda abusar de efectos o sonidos.
Este documento presenta una introducción a los árboles como estructura de datos, incluyendo definiciones de árboles binarios, recorridos de árboles binarios, árboles de búsqueda como árboles lexicográficos y árboles hilvanados, y transformaciones de árboles generales en binarios. También cubre conceptos como grado de un nodo, nivel de un nodo, nodos hoja y rama, y árboles completos.
The document provides a monthly snapshot of real estate activity in San Francisco for March 2016. Some key highlights include:
- Median home sale prices increased 8.4% year-over-year for single family homes but were flat for condos.
- New listings and pending sales decreased compared to previous months and year-ago levels across both single family homes and condos.
- Inventory levels remained flat for single family but increased 22.2% for condos, suggesting the market may be slowing.
- The report concludes that demand remains but low inventory could limit further sales growth in the year ahead if supply does not increase.
The monthly real estate snapshot report summarizes residential real estate activity in San Francisco for May 2016. Key metrics showed that new listings were down 10.8% for single family homes and 4.2% for condos from the previous year. Pending sales increased 18.2% for single family but decreased 3.4% for condos. Median sales prices were down slightly at 1.4% for single family homes and 1.1% for condos from the previous year. Inventory levels increased while demand remained high, putting pressure on housing supply.
The document provides a monthly snapshot of real estate activity in San Francisco for June 2017. Some key points:
- Median sales prices for single-family homes increased 10.8% year-over-year while median prices for condos decreased 2.6%.
- New listings were down 18.1% for single family homes and 36% for condos compared to the previous year. Pending sales rose for both single family homes and condos.
- Inventory levels decreased significantly with months of supply dropping 30.4% for single family homes and 40% for condos.
The document provides a monthly snapshot of residential real estate activity in San Francisco for August 2017. It summarizes that median sales prices increased 10.4% for single family homes and 10.8% for condos year-over-year. New listings and pending sales decreased compared to last August, while months of inventory decreased. The prevailing housing trends from the summer were expected to continue as the fundamentals of the local economy remain stable.
The document is a monthly real estate snapshot for San Francisco County that provides key metrics and year-over-year comparisons. It reports that in May 2017:
- Median home prices rose 12% for single-family homes and 10.9% for condos from a year ago.
- New listings declined 7.4% for single-family homes and 18.4% for condos from a year ago.
- Inventory levels decreased with months supply of inventory falling 24% for single-family homes and 25% for condos from a year ago.
- Housing market activity in San Francisco increased in March 2014 compared to the previous year. The median sales price for single family homes rose 8.5% and condos increased 16.7% from March 2013 levels.
- New listings and pending sales were down compared to the previous year while months of inventory decreased, indicating a strong seller's market with low availability and high demand.
- The local economy is improving, fueling further growth in the housing market as consumer confidence, spending and employment are up.
- Housing market activity in San Francisco increased in October 2014 compared to the previous year. The median sales price for single family homes rose 34.4% and condos rose 10%.
- New listings were down for both single family (-16.2%) and condos (-3.4%) compared to the previous year. Pending sales increased for single family homes by 8.2% but decreased for condos by 12.6%.
- Inventory levels decreased for both single family homes and condos compared to the previous year.
The document provides a monthly snapshot of residential real estate activity in San Francisco for July 2018. Some key points:
- Median home sale prices increased 17.9% year-over-year for single family homes and 1.4% for condos.
- New listings were down 14.2% for single family and 32.8% for condos compared to the previous year. Pending sales also decreased for single family but increased for condos.
- Inventory levels decreased while prices rose, suggesting the market remains favorable for sellers despite some signs of a potential slowdown in demand.
The document is a monthly real estate snapshot for San Francisco County that provides key metrics and year-over-year comparisons. It summarizes that:
- Median home sale prices increased 9.9% for single family homes and 8.0% for condos year-over-year.
- New listings were down 22.2% for single family and 12.0% for condos compared to the previous year.
- Inventory levels decreased with months supply down 31.0% for single family homes and 20.0% for condos.
The monthly snapshot report provides key housing market metrics for San Francisco County. In February 2017:
- New listings were down 36.1% for single family homes and 23.7% for condos from the previous year.
- Median sales prices were down 7.6% for single family homes but up 10.3% for condos compared to February 2016.
- Inventory decreased 25% for single family homes and 4.3% for condos, while pending sales rose slightly for single family and fell for condos.
The report indicates the local housing market remains very competitive with low inventory and high demand, particularly in the single family home segment.
- Residential real estate activity in San Francisco County saw a 0.2% decrease in the median sales price for single family homes but a 4.6% increase for condo/TIC/Coop properties in March 2017 compared to the previous year.
- New listings were down 18.3% for single family homes and 25.7% for condo/TIC/Coop properties, while pending sales increased 6.7% and 27.4% respectively.
- Months supply of inventory decreased 33.3% for single family units and 18.5% for condo/TIC/Coop units in March 2017.
The document provides housing market statistics for San Francisco County for June 2014. Median home sale prices increased 27.8% for single family homes and 25% for condos over the previous year. New property listings declined 17.1% for single family homes and 18.7% for condos compared to June 2013. Pending home sales decreased 29.1% for single family properties but rose 4.1% for condos. Interest rates were generally lower than a year prior and housing demand was picking up in higher price tiers while inventory levels rose slowly in some areas.
San Francisco Market Focus Report September 2018Ronny Budiutama
- Housing prices in San Francisco increased substantially in September 2018 compared to the previous year, with median single family home prices up 14.2% and condo prices up 6.4%.
- Several key housing metrics showed declines in September, including new listings, pending sales, and sold listings for both single family homes and condos/co-ops.
- While prices remain high, factors like rising interest rates and stagnant wages could lead to declining housing demand and sales in the future.
Similar to San Francisco Market Focus December 2015 (13)
The document provides a monthly snapshot of real estate activity in San Francisco for January 2024. It summarizes that median home sale prices increased 15.2% year-over-year for single family homes and 8.7% for condos. Pending home sales increased 32.2% for single family homes and 47.2% for condos. Inventory decreased for single family homes but increased for condos compared to the previous year.
The document provides housing market statistics for San Francisco County for December 2023. It shows that existing home sales in the US rose slightly from the previous month but were down 7.3% from the same period last year. In San Francisco, new listings were down 37.5% for single family homes and 3.8% for condos from the previous year. The median sales price fell 5.7% for single family homes but rose 4.9% for condos compared to December 2022. Inventory remained low overall amid continued affordability challenges for buyers.
- New listings were down 35.9% for single family homes and 1.3% for condo/TIC/Coop properties in November 2023 compared to the previous year.
- The median sales price increased 2.3% to $1,535,000 for single family homes but remained flat at $1,125,000 for condo/TIC/Coop properties in November 2023 year-over-year.
- Inventory remains at historically low levels nationwide, keeping pressure on home prices which have continued to rise despite a slowdown in home sales.
The document provides an annual report on the San Francisco County housing market in 2023. It summarizes that pending home sales decreased 25.6% while sold listings decreased 27.4% compared to 2022. Housing inventory declined 19.7% and median home prices fell 9.1% year-over-year. The report reviews housing market statistics by property type, bedroom count, square footage, and area of San Francisco County.
October 2023 Report: San Francisco Real Estate Market InsightsRonny Budiutama
Residential real estate activity in San Francisco declined in October 2023 compared to the previous year. The median sales price for single family homes fell 1.2% year-over-year to $1,650,000, while the median price for condos dropped 1.3% to $1,185,000. New listings were down for both single family (-1.6%) and condos (-17.2%), while pending sales rose for single family homes (+16.9%) but fell for condos (-4.1%). Inventory remained low, rising 2.7% from the prior month but falling 8.1% from a year ago.
CA Weekly MLS Market Data Report - August 2023Ronny Budiutama
This Power BI report contains various charts and graphs analyzing real estate market trends in different regions of California from 2020 to 2023. It shows metrics for existing single family home closed sales, pending sales, median listing prices, and sales by price segment. Closed sales are broken down by week, year, region and price point with year-over-year comparisons. Pending sales and listings are also shown at the state level and by region and price point. The report provides high-level insights into housing demand, pricing, and sales volume trends over time for existing single family homes in California.
- Residential real estate activity in San Francisco saw declines in July 2023, with new listings down 23.2% for single family homes and 37.7% for condos from the previous year. Pending sales also decreased nearly 20% and 18.5% respectively.
- The median sales price dropped 13% for single family homes to $1,450,000, and 3.1% for condos to $1,159,500 compared to July 2022. Months of inventory increased over 6% for single family and nearly 16% for condos.
- Higher mortgage rates have limited buyer activity while also discouraging homeowners from listing due to not wanting to give up their lower rates, contributing to
- Existing home sales fell 3.4% nationwide in May 2023 compared to the previous month and were down 23% from May 2022 as higher mortgage rates reduced buyer affordability.
- New listings were down 9.0% for single family homes and 36.8% for condos from May 2022 levels, while pending sales decreased 12.0% and 27.7% respectively.
- Median sales prices declined sharply, falling 17.8% for single family homes to $1,650,000 and 7.7% for condos to $1,121,500 compared to May 2022.
- Residential real estate activity in San Francisco County saw declines across key metrics in June 2023 compared to the previous year. The median sales price for single family homes declined 14.6% year-over-year to $1,605,000, while the median price for condos fell 8.9% to $1,130,000. New listings dropped 32.6% for single family homes and 29.5% for condos. Pending sales rose slightly for single family but declined 9.2% for condos. Months of inventory increased for both property types. Nationwide, housing inventory rose 3.8% but remained low while median home prices fell 3.1% annually.
- Residential real estate activity in San Francisco saw declines across key metrics in March 2023 compared to the previous year. New listings were down 29.5% for single family homes and 41.6% for condos. Pending sales decreased 36.9% and 36.4% respectively. The median sales price dropped 15.1% and 10.5% respectively.
- Residential real estate activity in San Francisco saw significant declines in February 2023 compared to the previous year. New listings were down 40.3% for single family homes and 40.7% for condos. Pending sales decreased 39.5% and 25.8% respectively. The median sales price dropped 25.4% for single family homes and 6.3% for condos.
- Residential real estate activity in San Francisco decreased significantly in January 2023 compared to January 2022. New listings and pending sales were down 28.5% and 33.1% respectively for single family homes, and down 28.6% and 40.6% for condo/co-op properties. Median sales prices decreased as well, down 16% for single family homes and 6.5% for condo/co-op properties.
Annual Report on the San Francisco County Housing Market.pdfRonny Budiutama
This annual report summarizes housing market trends in San Francisco County in 2022. Some key points:
- Home sales and new listings declined significantly (over 25%) in 2022 from record highs in 2021, as mortgage rates rose sharply reducing affordability.
- Median home prices increased slightly (0.8%) countywide to $1,450,000, though prices decreased for single family homes and condos.
- Inventory remained very low, with only 653 active listings at the end of the year despite a 28.6% decline in new listings.
- The hot housing market that defined 2021 cooled considerably in 2022 as affordability challenges took hold, though demand remained robust in more
San Francisco Market Report December 2022.pdfRonny Budiutama
In 2022, rising inflation, interest rates, and home prices slowed the US housing market. Pending and existing home sales declined significantly year-over-year in December. In San Francisco, median home prices fell 7.5% for single family homes and 26.5% for condos from December 2021 to December 2022, as higher mortgage rates reduced buyer demand and purchasing power. New listings, pending sales, and closed sales all declined substantially from 2021 levels. Economists predict further price softening and slowing sales in 2023 if inventory remains limited and rates stay high.
San Francisco Market Report November 2022.pdfRonny Budiutama
Residential real estate activity in San Francisco saw declines in November 2022 compared to the previous year. The median sales price for single-family homes decreased 20.2% year-over-year to $1,500,000, while the median price for condos fell 8.9% to $1,148,000. New listings were down 12.3% for single-family properties and 41.9% for condos. Pending sales declined 31.7% for single-family homes and 49.2% for condos. With mortgage rates over double what they were a year ago, housing affordability remains a challenge and fewer buyers and sellers are participating in the market.
- Residential real estate activity in San Francisco declined in October 2022, with new listings, pending sales, and sold listings all decreasing between 24-39% year-over-year for both single family homes and condos.
- The median sales price decreased 7.2% for single family homes to $1,675,000 and 3.8% for condos to $1,200,000 compared to October 2021.
- Months supply of inventory increased over last year for both property types, up 15.8% for single family and 5.7% for condos, as high mortgage rates and inflation dampened homebuyer demand.
San Francisco Market Report September 2022.pdfRonny Budiutama
The real estate market in San Francisco continues to slow in September 2022 as interest rates rise and homebuyer budgets are squeezed. Key metrics show a year-over-year decrease for both single family homes and condos, including new listings down 13.2% and 19.8%, pending sales down 38.2% and 28.8%, and median sales prices down 5.7% and 2.5% respectively. Inventory remains lower than normal but is expected to rise as the market shifts in the coming months.
- Real estate activity in San Francisco County declined in August 2022 compared to the previous year according to the report. Key metrics such as new listings, pending sales, and median sales prices decreased for both single family homes and condo/co-op properties.
- New listings were down 13.7% for single family homes and 20.4% for condos. Pending sales decreased 25.2% and 29.1% respectively. Median sales prices declined 12.0% for single family homes and 14.1% for condos.
- Higher interest rates, inflation, and recession fears have discouraged buyers and sellers, leading to fewer transactions and declining prices compared to the strong market in previous years.
AVRUPA KONUTLARI ESENTEPE - ENGLISH - Listing TurkeyListing Turkey
Looking for a new home in Istanbul? Look no further than Avrupa Konutlari Esentepe! Our beautifully designed homes provide the perfect blend of luxury and comfort, making them the perfect choice for anyone looking for a high-quality home in the city.
With a wide range of apartment types available, from 1+1 to 4+1, we have something to suit every need and budget. Each apartment is designed with attention to detail and features spacious and bright living areas, making them the perfect place to relax and unwind after a long day.
One of the things that sets Avrupa Konutlari Esentepe apart from other developments is our focus on creating a community that is both comfortable and convenient. Our homes are surrounded by lush green spaces, perfect for enjoying a peaceful stroll or having a picnic with friends and family. Additionally, our complex includes a variety of social and recreational amenities, such as swimming pools, sports fields, and playgrounds, making it easy for residents to stay active and socialize with their neighbors.
https://listingturkey.com/property/avrupa-konutlari-esentepe/
BEST FARMLAND FOR SALE | FARM PLOTS NEAR BANGALORE | KANAKAPURA | CHICKKABALP...knox groups real estate
welcome to knox groups real estate company in Bangalore. best farm land for sale near Bangalore and madhugiri . Managed farmland near Kanakapura and Chickkabalapur get know more details about the projects .Knox groups is a leading real estate company dedicated to helping individuals and businesses navigate the dynamic real estate market. With our extensive knowledge, experience, and commitment to excellence, we deliver exceptional results for our clients. Discover the perfect foundation for your agricultural aspirations with KNOX Groups' prime farm lands. These aren't just plots; they're the fertile grounds where vibrant crops flourish, livestock thrives, and unique agricultural ventures come to life. At KNOX, we go beyond selling land we curate sustainable ecosystems, ensuring that your journey toward agricultural success is seamless and prosperous.
Living in an UBER World - June '24 Sales MeetingTom Blefko
June 2024 Lancaster County Sales Meeting for Berkshire Hathaway HomeServices Homesale Realty covering the following topics: 1. VA Suspends Buyer Agent Payment Plan (article), 2. Frequently Used Terms in title, 3. Zillow Showcase Overview, 4. QuickBuy commission promotion, 5. Documenting Cooperative Compensation, 6. NAR's Code of Ethics - Mass Media Solicitations, 7. Is it really cheaper to rent? 8. Do's and Don't's when Terminating the Agreement of Sale, 9. Living in an UBER World
Kumar Codename Fireworks at Hadapsar Link Road, Pune - PDF.pdfmonikasharma630
Codename Fireworks developed by Kumar Properties is a new residential development that offers 2/3 BHK premium residences with easy access to proposed ring road, airport, metro station.
For More Details:
Visit Here: kumar.developerprojects.com
The SVN® organization shares a portion of their new weekly listings via their SVN Live® Weekly Property Broadcast. Visit https://svn.com/svn-live/ if you would like to attend our weekly call, which we open up to the brokerage community.
Anilesh Ahuja Pioneering a Paradigm Shift in Real Estate Success.pptxneilahuja668
Anilesh Ahuja journey is a testament to the power of vision, resilience, and unwavering determination. As a visionary leader, he continues to inspire and empower others to dream big and challenge the status quo. His legacy extends far beyond the realm of real estate, leaving an indelible mark on the industry and the world at large.
Stark Builders: Where Quality Meets Craftsmanship!shuilykhatunnil
At Stark Builders our vision is to redefine the renovation experience by combining both stunning design and high quality construction skills. We believe that by delivering both these key aspects together we are able to achieve incredible results for our clients and ensure every project reflects their vision and enhances their lifestyle.
Although we are not all related by blood we have created a team of highly professional and hardworking individuals who share the common goal of delivering beautiful and functional renovated spaces. Our tight nit team are able to work together in a way where we pour our passion into each and every project as we have a love for what we do. Building is our life.
Deed 3754 S Honeysuckle Mesa AZ 85212 owner Shawn Freeman - Pamela Brown Nota...
San Francisco Market Focus December 2015
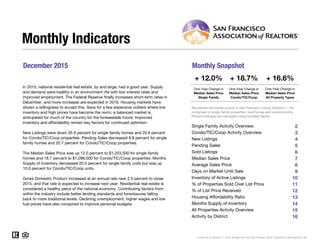
1. December 2015 Monthly Snapshot
One-Year Change in One-Year Change in
Median Sales Price
Single Family
Median Sales Price
Condo/TIC/Coop
2
3
4
5
6
7
8
9
10
11
12
13
14
15
16
Monthly Indicators
+ 12.0% + 18.7% + 16.6%
One-Year Change in
In 2015, national residential real estate, by and large, had a good year. Supply
and demand were healthy in an environment rife with low interest rates and
improved employment. The Federal Reserve finally increased short-term rates in
December, and more increases are expected in 2016. Housing markets have
shown a willingness to accept this. Save for a few expensive outliers where low
inventory and high prices have become the norm, a balanced market is
anticipated for much of the country for the foreseeable future. Improved
inventory and affordability remain key factors for continued optimism.
New Listings were down 35.9 percent for single family homes and 20.9 percent
for Condo/TIC/Coop properties. Pending Sales decreased 8.8 percent for single
family homes and 20.7 percent for Condo/TIC/Coop properties.
The Median Sales Price was up 12.0 percent to $1,203,500 for single family
homes and 18.7 percent to $1,098,000 for Condo/TIC/Coop properties. Months
Supply of Inventory decreased 20.0 percent for single family units but was up
10.0 percent for Condo/TIC/Coop units.
Gross Domestic Product increased at an annual rate near 2.0 percent to close
2015, and that rate is expected to increase next year. Residential real estate is
considered a healthy piece of the national economy. Contributing factors from
within the industry include better lending standards and foreclosures falling
back to more traditional levels. Declining unemployment, higher wages and low
fuel prices have also conspired to improve personal budgets.
Median Sales Price
All Property Types
Residential real estate activity in San Francisco County (Districts 1-10),
comprised of single-family properties, townhomes and condominiums.
Percent changes are calculated using rounded figures.
Single Family Activity Overview
Months Supply of Inventory
Current as of January 11, 2016. All data from the San Francisco MLS. Powered by ShowingTime 10K.
Condo/TIC/Coop Activity Overview
Inventory of Active Listings
% of Properties Sold Over List Price
% of List Price Received
Housing Affordability Ratio
All Properties Activity Overview
New Listings
Pending Sales
Sold Listings
Median Sales Price
Average Sales Price
Days on Market Until Sale
Activity by District
2. Single Family Activity Overview
Key metrics by report month and for year-to-date (YTD) starting from the first of the year.
Key Metrics Historical Sparkbars 12-2014 12-2015 Percent Change YTD 2014 YTD 2015 Percent Change
Current as of January 11, 2016. All data from the San Francisco MLS. Powered by ShowingTime 10K. | 2
Months Supply 1.0 0.8 - 20.0% -- -- --
Affordability Ratio 43 40 - 7.0%
% of List Price Received 109.0% 112.4% + 3.1% 112.3%
43
82.4% + 3.0%
+ 2.8%
39 - 9.3%
115.4%
% of Properties Sold Over List Price 73.8% 79.8% + 8.1% 80.0%
Active Listings 208 146 - 29.8% --
Avg. Sales Price $1,343,423 $1,516,568 + 12.9% $1,444,673
Days on Market 38 33 - 13.2% 31 27 - 12.9%
$1,637,788
-- --
Median Sales Price $1,075,000 $1,203,500 + 12.0% $1,070,500
Sold Listings 195 198 + 1.5% 2,405
New Listings 78 50 - 35.9% 2,723
Pending Sales 136 124 - 8.8% - 3.2%2,392 2,316
- 1.6%2,679
2,290 - 4.8%
$1,250,000 + 16.8%
+ 13.4%
12-2012 12-2013 12-2014 12-2015
12-2012 12-2013 12-2014 12-2015
12-2012 12-2013 12-2014 12-2015
12-2012 12-2013 12-2014 12-2015
12-2012 12-2013 12-2014 12-2015
12-2012 12-2013 12-2014 12-2015
12-2012 12-2013 12-2014 12-2015
12-2012 12-2013 12-2014 12-2015
12-2012 12-2013 12-2014 12-2015
12-2012 12-2013 12-2014 12-2015
12-2012 12-2013 12-2014 12-2015
3. Condo/TIC/Coop Activity Overview
Key metrics by report month and for year-to-date (YTD) starting from the first of the year.
Key Metrics Historical Sparkbars 12-2014 12-2015 Percent Change YTD 2014 YTD 2015 Percent Change
Current as of January 11, 2016. All data from the San Francisco MLS. Powered by ShowingTime 10K. | 3
Months Supply 1.0 1.1 + 10.0% -- -- --
Affordability Ratio 58 51 - 12.1%
% of List Price Received 103.5% 104.4% + 0.9% 106.9%
57
70.5% + 4.3%
+ 1.7%
51 - 10.5%
108.7%
% of Properties Sold Over List Price 55.5% 60.1% + 8.3% 67.6%
Active Listings 276 260 - 5.8% --
Avg. Sales Price $1,144,474 $1,252,661 + 9.5% $1,096,071
Days on Market 47 44 - 6.4% 36
$1,095,000 + 16.4%
+ 13.4%
32 - 11.1%
$1,242,745
-- --
Sold Listings 227 271 + 19.4% 3,149 2,868 - 8.9%
Median Sales Price $925,000 $1,098,000 + 18.7% $940,875
- 5.2%
Pending Sales 208 165 - 20.7% 3,161 2,916 - 7.8%
New Listings 110 87 - 20.9% 3,653 3,464
12-2012 12-2013 12-2014 12-2015
12-2012 12-2013 12-2014 12-2015
12-2012 12-2013 12-2014 12-2015
12-2012 12-2013 12-2014 12-2015
12-2012 12-2013 12-2014 12-2015
12-2012 12-2013 12-2014 12-2015
12-2012 12-2013 12-2014 12-2015
12-2012 12-2013 12-2014 12-2015
12-2012 12-2013 12-2014 12-2015
12-2012 12-2013 12-2014 12-2015
12-2012 12-2013 12-2014 12-2015
4. New Listings
New Listings
Single
Family
Year-Over-Year
Change
Condo/TIC/
Coop
Year-Over-Year
Change
Jan-2015 199 -2.0% 266 -20.4%
Feb-2015 238 +22.7% 296 -2.6%
Mar-2015 251 +6.4% 332 +9.9%
Apr-2015 250 +3.7% 354 -3.5%
May-2015 259 -5.8% 335 -6.2%
Jun-2015 252 -9.0% 312 -13.1%
Jul-2015 255 -4.1% 288 -19.1%
Aug-2015 233 +3.6% 283 +3.7%
Sep-2015 319 -8.9% 435 +11.8%
Oct-2015 249 -0.4% 307 -8.4%
Nov-2015 124 -3.1% 169 +1.2%
Dec-2015 50 -35.9% 87 -20.9%
12-Month Avg 223 -1.6% 289 -5.2%
Historical New Listings by Month
Current as of January 11, 2016. All data from the San Francisco MLS. Powered by ShowingTime 10K. | 4
A count of the properties that have been newly listed on the market in a given month.
110 112
78
110
50
87
Single Family Condo/TIC/Coop
December
0
100
200
300
400
500
600
700
1-2005 1-2006 1-2007 1-2008 1-2009 1-2010 1-2011 1-2012 1-2013 1-2014 1-2015
Single Family Condo/TIC/Coop
2,974
3,879
2,723
3,653
2,679
3,464
Single Family Condo/TIC/Coop
Year to Date
2013 2014 2015
- 20.9%- 1.8%- 35.9%- 29.1% - 5.8%- 1.6%- 8.4% - 5.2%
2013 2014 2015 2013 2014 2015 2013 2014 2015
+ 7.8% + 0.1% + 8.1%- 0.9%
5. Pending Sales
Pending Sales
Single
Family
Year-Over-Year
Change
Condo/TIC/
Coop
Year-Over-Year
Change
Jan-2015 109 -17.4% 149 -18.6%
Feb-2015 138 -16.4% 213 -15.1%
Mar-2015 232 +6.9% 292 -1.0%
Apr-2015 226 +9.2% 281 -4.1%
May-2015 209 -2.3% 292 -1.4%
Jun-2015 219 +9.5% 294 -4.2%
Jul-2015 210 -7.5% 254 -7.6%
Aug-2015 205 +0.5% 233 -12.4%
Sep-2015 200 -6.1% 221 -17.5%
Oct-2015 265 -0.7% 284 -5.6%
Nov-2015 179 -14.8% 238 +9.2%
Dec-2015 124 -8.8% 165 -20.7%
12-Month Avg 193 -3.2% 243 -7.8%
Historical Pending Sales by Month
A count of the properties on which offers have been accepted in a given month.
Current as of January 11, 2016. All data from the San Francisco MLS. Powered by ShowingTime 10K. | 5
171
202
136
208
124
165
Single Family Condo/TIC/Coop
December
0
100
200
300
400
1-2005 1-2006 1-2007 1-2008 1-2009 1-2010 1-2011 1-2012 1-2013 1-2014 1-2015
Single Family Condo/TIC/Coop
2,622
3,350
2,392
3,161
2,316
2,916
Single Family Condo/TIC/Coop
Year to Date
2013 2014 2015
- 20.7%+ 3.0%- 8.8%- 20.5% - 5.6%- 3.2%- 8.8% - 7.8%
2013 2014 2015 2013 2014 2015 2013 2014 2015
+ 0.6% - 0.9% + 6.2%- 0.5%
6. Sold Listings
Sold Listings
Single
Family
Year-Over-Year
Change
Condo/TIC/
Coop
Year-Over-Year
Change
Jan-2015 110 -17.3% 158 -11.2%
Feb-2015 129 -17.8% 161 -27.5%
Mar-2015 189 +6.8% 264 -1.5%
Apr-2015 218 +5.8% 288 -11.7%
May-2015 205 -10.9% 286 -3.1%
Jun-2015 217 +13.0% 291 +1.7%
Jul-2015 236 +3.5% 272 -1.8%
Aug-2015 198 -6.2% 228 -20.6%
Sep-2015 164 -16.8% 180 -27.4%
Oct-2015 242 -12.9% 266 -16.6%
Nov-2015 184 -8.5% 203 -6.0%
Dec-2015 198 +1.5% 271 +19.4%
12-Month Avg 191 -4.8% 239 -8.9%
Historical Sold Listings by Month
A count of the actual sales that closed in a given month.
Current as of January 11, 2016. All data from the San Francisco MLS. Powered by ShowingTime 10K. | 6
214
246
195
227
198
271
Single Family Condo/TIC/Coop
December
0
100
200
300
400
1-2005 1-2006 1-2007 1-2008 1-2009 1-2010 1-2011 1-2012 1-2013 1-2014 1-2015
Single Family Condo/TIC/Coop
2,659
3,333
2,405
3,149
2,290
2,868
Single Family Condo/TIC/Coop
Year to Date
2013 2014 2015
+ 19.4%- 7.7%+ 1.5%- 8.9% - 5.5%- 4.8%- 9.6% - 8.9%
2013 2014 2015 2013 2014 2015 2013 2014 2015
+ 2.4% + 0.9% + 5.2%- 2.0%
7. Median Sales Price
Median Sales Price
Single
Family
Year-Over-Year
Change
Condo/TIC/
Coop
Year-Over-Year
Change
Jan-2015 $975,000 +5.4% $899,500 -5.3%
Feb-2015 $1,115,000 +6.2% $1,100,000 +17.4%
Mar-2015 $1,250,000 +28.2% $1,100,000 +14.0%
Apr-2015 $1,307,500 +18.9% $1,077,500 +19.1%
May-2015 $1,400,000 +28.4% $1,112,500 +18.4%
Jun-2015 $1,300,000 +10.6% $1,100,000 +15.2%
Jul-2015 $1,280,000 +18.4% $1,033,509 +8.8%
Aug-2015 $1,225,444 +26.6% $1,047,500 +12.6%
Sep-2015 $1,155,000 +11.6% $1,045,000 +14.2%
Oct-2015 $1,280,000 +7.6% $1,100,000 +15.2%
Nov-2015 $1,285,000 +14.1% $1,125,000 +10.3%
Dec-2015 $1,203,500 +12.0% $1,098,000 +18.7%
12-Month Avg* $1,250,000 +16.8% $1,095,000 +16.4%
Historical Median Sales Price by Month
Point at which half of the sales sold for more and half sold for less, not accounting for seller concessions, in a given month.
* Median Sales Price for all properties from January 2015 through December 2015. This is not the
average of the individual figures above.
Current as of January 11, 2016. All data from the San Francisco MLS. Powered by ShowingTime 10K. | 7
$942,500
$762,500
$1,075,000
$925,000
$1,203,500
$1,098,000
Single Family Condo/TIC/Coop
December
$400,000
$600,000
$800,000
$1,000,000
$1,200,000
$1,400,000
$1,600,000
1-2005 1-2006 1-2007 1-2008 1-2009 1-2010 1-2011 1-2012 1-2013 1-2014 1-2015
Single Family Condo/TIC/Coop
$910,000
$820,000
$1,070,500
$940,875
$1,250,000
$1,095,000
Single Family Condo/TIC/Coop
Year to Date
2013 2014 2015
+ 18.7%+ 21.3%+ 12.0%+ 14.1% + 14.7%+ 16.8%+ 17.6% + 16.4%
2013 2014 2015 2013 2014 2015 2013 2014 2015
+ 12.9% + 19.7% + 15.8%+ 9.1%
8. Average Sales Price
Avg. Sales Price
Single
Family
Year-Over-Year
Change
Condo/TIC/
Coop
Year-Over-Year
Change
Jan-2015 $1,279,424 +3.3% $1,094,504 -1.3%
Feb-2015 $1,550,286 +6.0% $1,204,301 +21.1%
Mar-2015 $1,748,561 +25.6% $1,300,064 +22.7%
Apr-2015 $1,765,744 +16.8% $1,317,148 +18.4%
May-2015 $1,839,795 +26.1% $1,329,588 +14.6%
Jun-2015 $1,788,117 +11.9% $1,298,673 +11.4%
Jul-2015 $1,657,986 +17.9% $1,214,478 +11.0%
Aug-2015 $1,505,629 +13.5% $1,161,445 +6.4%
Sep-2015 $1,390,736 +5.6% $1,168,669 +15.1%
Oct-2015 $1,632,146 -2.3% $1,184,400 +11.0%
Nov-2015 $1,720,012 +17.7% $1,264,078 +12.7%
Dec-2015 $1,516,568 +12.9% $1,252,661 +9.5%
12-Month Avg* $1,637,788 +13.4% $1,242,745 +13.4%
Historical Average Sales Price by Month
Average sales price for all closed sales, not accounting for seller concessions, in a given month.
* Avg. Sales Price for all properties from January 2015 through December 2015. This is not the
average of the individual figures above.
Current as of January 11, 2016. All data from the San Francisco MLS. Powered by ShowingTime 10K. | 8
$1,365,930
$1,020,083
$1,343,423
$1,144,474
$1,516,568
$1,252,661
Single Family Condo/TIC/Coop
December
$600,000
$800,000
$1,000,000
$1,200,000
$1,400,000
$1,600,000
$1,800,000
$2,000,000
1-2005 1-2006 1-2007 1-2008 1-2009 1-2010 1-2011 1-2012 1-2013 1-2014 1-2015
Single Family Condo/TIC/Coop
$1,292,103
$962,220
$1,444,673
$1,096,071
$1,637,788
$1,242,745
Single Family Condo/TIC/Coop
Year to Date
2013 2014 2015
+ 9.5%+ 12.2%+ 12.9%- 1.6% + 13.9%+ 13.4%+ 11.8% + 13.4%
2013 2014 2015 2013 2014 2015 2013 2014 2015
- 1.4% + 17.0% + 17.6%+ 19.3%
9. Days on Market Until Sale
Days on Market
Single
Family
Year-Over-Year
Change
Condo/TIC/
Coop
Year-Over-Year
Change
Jan-2015 43 +7.5% 49 -2.0%
Feb-2015 28 -26.3% 29 -23.7%
Mar-2015 24 -25.0% 28 -9.7%
Apr-2015 23 -34.3% 31 0.0%
May-2015 23 -4.2% 28 0.0%
Jun-2015 27 0.0% 26 -21.2%
Jul-2015 25 -16.7% 29 -12.1%
Aug-2015 28 +3.7% 29 -12.1%
Sep-2015 27 +3.8% 34 -8.1%
Oct-2015 25 -16.7% 26 -29.7%
Nov-2015 27 -12.9% 35 -7.9%
Dec-2015 33 -13.2% 44 -6.4%
12-Month Avg* 27 -12.8% 32 -11.3%
Historical Days on Market Until Sale by Month
Average number of days between when a property is listed and when an offer is accepted in a given month.
* Days on Market for all properties from January 2015 through December 2015. This is not the
average of the individual figures above.
Current as of January 11, 2016. All data from the San Francisco MLS. Powered by ShowingTime 10K. | 9
41
44
38
47
33
44
Single Family Condo/TIC/Coop
December
20
40
60
80
100
120
1-2005 1-2006 1-2007 1-2008 1-2009 1-2010 1-2011 1-2012 1-2013 1-2014 1-2015
Single Family Condo/TIC/Coop
35
40
31
36
27
32
Single Family Condo/TIC/Coop
Year to Date
2013 2014 2015
- 6.4%+ 6.8%- 13.2%- 7.3% - 10.0%- 12.9%- 11.4% - 11.1%
2013 2014 2015 2013 2014 2015 2013 2014 2015
- 14.6% - 32.7% - 35.5%- 27.9%
10. Inventory of Active Listings
Active Listings
Single
Family
Year-Over-Year
Change
Condo/TIC/
Coop
Year-Over-Year
Change
Jan-2015 280 -10.8% 376 -17.7%
Feb-2015 360 +12.1% 435 -10.5%
Mar-2015 359 +10.1% 449 -3.9%
Apr-2015 356 +6.0% 491 -4.8%
May-2015 384 +2.4% 497 -10.1%
Jun-2015 388 -7.8% 473 -17.3%
Jul-2015 396 -6.6% 470 -19.9%
Aug-2015 378 -4.5% 469 -10.0%
Sep-2015 461 -6.3% 645 +10.4%
Oct-2015 408 -4.7% 606 +7.4%
Nov-2015 297 -6.6% 461 0.0%
Dec-2015 146 -29.8% 260 -5.8%
12-Month Avg* 351 -3.3% 469 -6.8%
Historical Inventory of Active Listings by Month
The number of properties available for sale in active status at the end of a given month.
* Active Listings for all properties from January 2015 through December 2015. This is not the
average of the individual figures above.
Current as of January 11, 2016. All data from the San Francisco MLS. Powered by ShowingTime 10K. | 10
267
332
208
276
146
260
Single Family Condo/TIC/Coop
December
0
250
500
750
1,000
1,250
1,500
1-2005 1-2006 1-2007 1-2008 1-2009 1-2010 1-2011 1-2012 1-2013 1-2014 1-2015
Single Family Condo/TIC/Coop
2013 2014 2015
- 5.8%- 16.9%- 29.8%- 22.1%
2013 2014 2015
- 16.3% - 18.8%
11. % of Properties Sold Over List Price
% of Properties
Sold Over List Price
Single
Family
Year-Over-Year
Change
Condo/TIC/
Coop
Year-Over-Year
Change
Jan-2015 64.5% -1.4% 58.2% +32.0%
Feb-2015 82.2% +8.4% 65.8% -4.5%
Mar-2015 76.7% -1.7% 68.6% -4.2%
Apr-2015 83.5% -2.8% 71.2% +1.9%
May-2015 83.4% -4.1% 76.6% +0.4%
Jun-2015 86.6% +9.3% 74.2% +7.2%
Jul-2015 84.3% -2.0% 73.9% +3.4%
Aug-2015 89.4% +10.9% 72.4% +4.5%
Sep-2015 88.4% +14.5% 72.2% +8.6%
Oct-2015 83.1% +0.8% 76.3% +10.1%
Nov-2015 78.3% -2.1% 70.0% +4.3%
Dec-2015 79.8% +8.1% 60.1% +8.3%
12-Month Avg 82.4% +3.0% 70.5% +4.3%
Historical % of Properties Sold Over List Price by Month
Percentage found when dividing the number of properties sold by properties sold over its original list price, not accounting for seller
concessions.
* % of Properties Sold Over List Price for all properties from January 2015 through December
2015. This is not the average of the individual figures above.
Current as of January 11, 2016. All data from the San Francisco MLS. Powered by ShowingTime 10K. | 11
64.5%
54.1%
73.8%
55.5%
79.8%
60.1%
Single Family Condo/TIC/Coop
December
0.0%
20.0%
40.0%
60.0%
80.0%
100.0%
1-2005 1-2006 1-2007 1-2008 1-2009 1-2010 1-2011 1-2012 1-2013 1-2014 1-2015
Single Family Condo/TIC/Coop
76.0%
64.6%
80.0%
67.6%
82.4%
70.5%
Single Family Condo/TIC/Coop
Year to Date
2013 2014 2015
+ 8.3%+ 2.6%+ 8.1%+ 14.4% + 4.6%+ 3.0%+ 5.3% + 4.3%
2013 2014 2015 2013 2014 2015 2013 2014 2015
+ 4.5% + 28.2% + 42.0%+ 17.1%
12. % of List Price Received
% of List Price
Received
Single
Family
Year-Over-Year
Change
Condo/TIC/
Coop
Year-Over-Year
Change
Jan-2015 107.9% +0.2% 104.9% +1.8%
Feb-2015 114.5% +3.9% 108.1% +1.8%
Mar-2015 113.7% +1.7% 109.6% +1.2%
Apr-2015 116.8% +1.5% 109.3% +1.0%
May-2015 118.4% +2.3% 111.7% +2.4%
Jun-2015 117.2% +3.0% 110.1% +1.7%
Jul-2015 117.8% +3.2% 109.2% +1.0%
Aug-2015 117.3% +5.5% 108.8% +2.3%
Sep-2015 117.7% +5.5% 108.8% +3.4%
Oct-2015 114.5% +1.3% 109.3% +2.2%
Nov-2015 112.6% +1.2% 107.7% +1.2%
Dec-2015 112.4% +3.1% 104.4% +0.9%
12-Month Avg* 115.4% +2.8% 108.7% +1.7%
Historical % of List Price Received by Month
Percentage found when dividing a property’s sales price by its most recent list price, then taking the average for all properties sold in a given
month, not accounting for seller concessions.
* % of List Price Received for all properties from January 2015 through December 2015. This is
not the average of the individual figures above.
Current as of January 11, 2016. All data from the San Francisco MLS. Powered by ShowingTime 10K. | 12
106.8%
103.4%
109.0%
103.5%
112.4%
104.4%
Single Family Condo/TIC/Coop
December
109.8%
105.3%
112.3%
106.9%
115.4%
108.7%
Single Family Condo/TIC/Coop
Year to Date
95.0%
100.0%
105.0%
110.0%
115.0%
120.0%
1-2005 1-2006 1-2007 1-2008 1-2009 1-2010 1-2011 1-2012 1-2013 1-2014 1-2015
Single Family Condo/TIC/Coop
2013 2014 2015
+ 0.9%+ 0.1%+ 3.1%+ 2.1%
2013 2014 2015
+ 2.1% + 1.8%
2013 2014 2015
+ 1.7%+ 1.5%+ 2.8%+ 2.3%
2013 2014 2015
+ 5.2% + 3.7%
13. Housing Affordability Ratio
Affordability Ratio
Single
Family
Year-Over-Year
Change
Condo/TIC/
Coop
Year-Over-Year
Change
Jan-2015 51 +8.5% 63 +18.9%
Feb-2015 44 +4.8% 52 -3.7%
Mar-2015 39 -15.2% 52 -1.9%
Apr-2015 38 -5.0% 53 -5.4%
May-2015 35 -16.7% 52 -7.1%
Jun-2015 37 -5.1% 51 -7.3%
Jul-2015 37 -11.9% 54 -1.8%
Aug-2015 39 -17.0% 53 -5.4%
Sep-2015 42 -4.5% 54 -5.3%
Oct-2015 38 -2.6% 51 -7.3%
Nov-2015 38 -7.3% 50 -3.8%
Dec-2015 40 -7.0% 51 -12.1%
12-Month Avg* 40 -5.9% 43 -7.1%
Historical Housing Affordability Ratio by Month
This index measures housing affordability for the region. An index of 120 means the median household income is 120% of what is necessary to
qualify for the median-priced home under prevailing interest rates. A higher number means greater affordability.
* Affordability Ratio for all properties from January 2015 through December 2015. This is not the
average of the individual figures above.
Current as of January 11, 2016. All data from the San Francisco MLS. Powered by ShowingTime 10K. | 13
49
69
43
58
40
51
Single Family Condo/TIC/Coop
December
30
40
50
60
70
80
90
100
1-2005 1-2006 1-2007 1-2008 1-2009 1-2010 1-2011 1-2012 1-2013 1-2014 1-2015
Single Family Condo/TIC/Coop
2013 2014 2015
- 12.1%- 15.9%- 7.0%- 12.2%
2013 2014 2015
- 19.7% - 16.9%
51
65
43
57
39
51
Single Family Condo/TIC/Coop
Year to Date
2013 2014 2015
- 10.5%- 12.3%- 9.3%- 15.7%
2013 2014 2015
- 23.9% - 20.7%
14. Months Supply of Inventory
Months Supply
Single
Family
Year-Over-Year
Change
Condo/TIC/
Coop
Year-Over-Year
Change
Jan-2015 1.4 -6.7% 1.4 -12.5%
Feb-2015 1.8 +20.0% 1.7 0.0%
Mar-2015 1.8 +20.0% 1.7 0.0%
Apr-2015 1.8 +12.5% 1.9 +5.6%
May-2015 1.9 +5.6% 1.9 -5.0%
Jun-2015 1.9 -9.5% 1.9 -9.5%
Jul-2015 2.0 -4.8% 1.9 -13.6%
Aug-2015 1.9 -5.0% 1.9 0.0%
Sep-2015 2.3 -4.2% 2.6 +18.2%
Oct-2015 2.1 0.0% 2.5 +19.0%
Nov-2015 1.5 -6.3% 1.9 +5.6%
Dec-2015 0.8 -20.0% 1.1 +10.0%
12-Month Avg* 1.8 +1.7% 1.9 +1.3%
Historical Months Supply of Inventory by Month
The inventory of homes for sale at the end of a given month, divided by the average monthly pending sales from the last 12 months.
* Months Supply for all properties from January 2015 through December 2015. This is not the
average of the individual figures above.
Current as of January 11, 2016. All data from the San Francisco MLS. Powered by ShowingTime 10K. | 14
1.2 1.2
1.0 1.0
0.8
1.1
Single Family Condo/TIC/Coop
December
0.0
2.0
4.0
6.0
8.0
10.0
1-2005 1-2006 1-2007 1-2008 1-2009 1-2010 1-2011 1-2012 1-2013 1-2014 1-2015
Single Family Condo/TIC/Coop
2013 2014 2015
+ 10.0%- 16.7%- 20.0%- 16.7%
2013 2014 2015
- 14.3% - 25.0%
15. All Properties Activity Overview
Key metrics by report month and for year-to-date (YTD) starting from the first of the year.
Key Metrics Historical Sparkbars 12-2014 12-2015 Percent Change YTD 2014 YTD 2015 Percent Change
Current as of January 11, 2016. All data from the San Francisco MLS. Powered by ShowingTime 10K. | 15
Months Supply 1.0 0.9 - 10.0% -- -- --
Affordability Ratio 44 42 - 4.5%
% of List Price Received 106.1% 107.8% + 1.6% 109.2%
43
75.8% + 3.8%
+ 2.3%
40 - 7.0%
111.7%
% of Properties Sold Over List Price 64.0% 68.4% + 6.9% 73.0%
Active Listings 484 406 - 16.1% --
Avg. Sales Price $1,236,406 $1,364,076 + 10.3% $1,247,015
Days on Market 43 39 - 9.3% 34
$1,150,000 + 15.7%
+ 13.7%
30 - 11.8%
$1,418,133
-- --
Sold Listings 422 469 + 11.1% 5,554 5,158 - 7.1%
Median Sales Price $973,750 $1,135,000 + 16.6% $994,000
- 3.7%
Pending Sales 344 289 - 16.0% 5,553 5,232 - 5.8%
New Listings 188 137 - 27.1% 6,376 6,143
12-2012 12-2013 12-2014 12-2015
12-2012 12-2013 12-2014 12-2015
12-2012 12-2013 12-2014 12-2015
12-2012 12-2013 12-2014 12-2015
12-2012 12-2013 12-2014 12-2015
12-2012 12-2013 12-2014 12-2015
12-2012 12-2013 12-2014 12-2015
12-2012 12-2013 12-2014 12-2015
12-2012 12-2013 12-2014 12-2015
12-2012 12-2013 12-2014 12-2015
12-2012 12-2013 12-2014 12-2015
16. Activity by District
SF District 1: Northwest (Sea Cliff, Lake, Jordan Park / Laurel Heights, Outer Richmond, Central Richmond, Inner Richmond, Lone Mountain)
SF District 2: Central West (Outer Sunset, Central Sunset, Inner Sunset, Outer Parkside, Parkside, Inner Parkside, Golden Gate Heights)
SF District 3: Southwest (Pine Lake Park, Lake Shore, Merced Manor, Stonestown, Lakeside, Merced Heights, Ingleside, Ingleside Heights, Oceanview)
SF District 4: Twin Peaks W (Forest Hill (& Ext), W Portal, St Francis Wd, Balboa Terr, Mt Dav Manor, Ingleside Terr, Monterey Hts, Wstwd Pk & H'lnds, Shrwd Fst, Miraloma Pk, Dmnd Hts, Mdtwn Terr)
SF District 5: Central (Haight Ashbury, Cole Vly / Prnssus Hts, Clarndn Hts, Corona Hts, Twin Pks, Glen Pk, Noe Vly, Eureka Vly / Dolores Hts, Mission Dolores, Duboce Trngl, Buena Vista / Ashbury Hts)
SF District 6: Central North (Lower Pacific Heights, Anza Vista, Western Addition, North Panhandle, Alamo Square, Hayes Valley)
SF District 7: North (Marina, Cow Hollow, Presidio Heights, Pacific Heights)
SF District 8: Northeast (North Waterfront, North Beach, Russian Hill, Telegraph Hill, Nob Hill, Financial District / Barbary Coast, Downtown, Van Ness / Civic Center, Tenderloin)
SF District 9: Central East (Yerba Buena, South Beach, South of Market, Mission Bay, Inner Mission, Potrero Hill, Central Waterfront / Dogpatch, Bernal Heights)
SF District 10: Southeast (Outer Mission, Mission Terr, Excelsior, Portola, Bayview, Silver Terr, Hunters Pt, Candlestick Pt, Bayview Hts, Little Hollywood, Visitation Vly, Crocker Amazon)
12-2014 12-2015 + / – 12-2014 12-2015 + / – 12-2014 12-2015 + / – 12-2014 12-2015 + / – 12-2014 12-2015 + / –
Single Family
1 SF District 1 13 10 -23.1% 12 10 -16.7% $1,479,000 $1,355,000 -8.4% 51 34 -33.3% 0.7 0.6 -14.3%
2 SF District 2 19 21 +10.5% 44 42 -4.5% $916,500 $1,165,000 +27.1% 38 31 -18.4% 0.5 0.6 +20.0%
3 SF District 3 15 10 -33.3% 13 19 +46.2% $730,000 $1,055,000 +44.5% 54 33 -38.9% 1.0 0.7 -30.0%
4 SF District 4 30 14 -53.3% 30 30 0.0% $1,250,000 $1,332,500 +6.6% 28 29 +3.6% 1.2 0.5 -58.3%
5 SF District 5 16 6 -62.5% 24 24 0.0% $1,660,000 $1,900,000 +14.5% 40 36 -10.0% 0.6 0.2 -66.7%
6 SF District 6 4 2 -50.0% 6 0 -100.0% $3,275,000 $0 -100.0% 37 0 -100.0% 1.1 0.6 -45.5%
7 SF District 7 15 14 -6.7% 8 7 -12.5% $3,487,500 $3,800,000 +9.0% 68 50 -26.5% 1.6 1.8 +12.5%
8 SF District 8 3 5 +66.7% 2 2 0.0% $1,840,000 $6,268,000 +240.7% 66 36 -45.5% 1.4 2.2 +57.1%
9 SF District 9 25 11 -56.0% 12 25 +108.3% $1,215,000 $1,317,500 +8.4% 28 26 -7.1% 1.3 0.5 -61.5%
10 SF District 10 68 53 -22.1% 44 39 -11.4% $690,000 $860,000 +24.6% 33 37 +12.1% 1.5 1.3 -13.3%
Condo/TIC/Coop
1 SF District 1 13 17 +30.8% 10 20 +100.0% $712,500 $1,002,500 +40.7% 39 53 +35.9% 1.0 1.3 +30.0%
2 SF District 2 4 10 +150.0% 0 5 -- $0 $1,000,000 -- 0 73 -- 0.9 2.4 +166.7%
3 SF District 3 4 5 +25.0% 4 4 0.0% $560,000 $1,155,087 +106.3% 23 87 +278.3% 1.3 1.0 -23.1%
4 SF District 4 3 4 +33.3% 4 4 0.0% $515,000 $680,269 +32.1% 66 39 -40.9% 0.6 1.0 +66.7%
5 SF District 5 37 21 -43.2% 25 47 +88.0% $1,010,000 $1,265,555 +25.3% 48 37 -22.9% 1.0 0.5 -50.0%
6 SF District 6 29 30 +3.4% 31 28 -9.7% $915,000 $1,095,000 +19.7% 43 48 +11.6% 1.1 1.2 +9.1%
7 SF District 7 26 11 -57.7% 26 20 -23.1% $1,374,500 $1,225,000 -10.9% 42 30 -28.6% 1.0 0.5 -50.0%
8 SF District 8 47 43 -8.5% 49 47 -4.1% $870,000 $978,000 +12.4% 56 41 -26.8% 1.1 1.1 0.0%
9 SF District 9 98 105 +7.1% 75 91 +21.3% $895,000 $1,100,000 +22.9% 41 42 +2.4% 1.0 1.2 +20.0%
10 SF District 10 15 14 -6.7% 3 5 +66.7% $513,000 $541,000 +5.5% 129 78 -39.5% 3.2 2.2 -31.3%
Key metrics by report month for the districts of San Fransisco.
Current as of January 11, 2016. All data from the San Francisco MLS. Powered by ShowingTime 10K. | 16
Active Listings Sold Listings Median Sales Price Days on Market Months Supply