Download to read offline
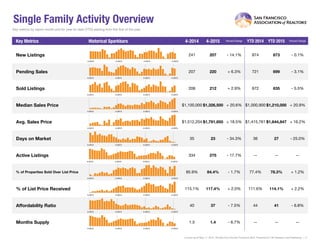
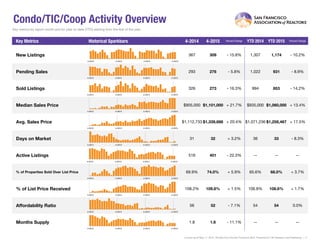
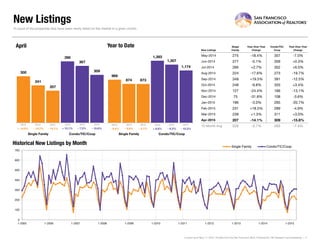
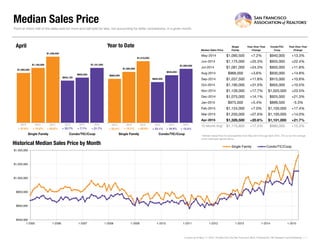
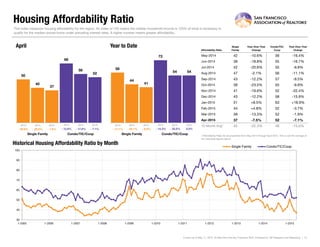
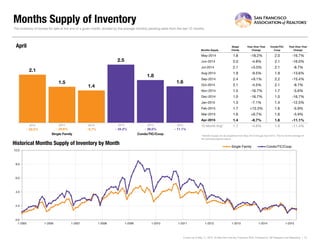
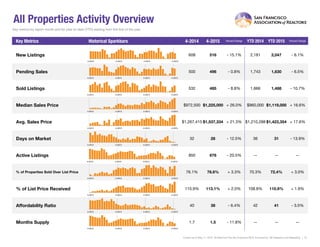

The document provides residential real estate statistics for San Francisco for April 2015. It summarizes that new listings decreased 14.1% for single family homes and 15.8% for condos from the previous year. Median sales prices increased substantially, up 20.6% for single family homes to $1,326,500 and 21.7% for condos to $1,101,000. Months of inventory decreased for both single family homes and condos compared to the previous year.


