Download to read offline


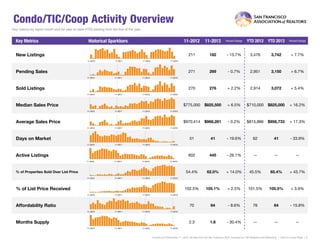
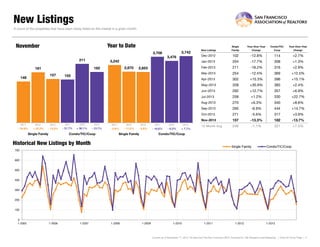
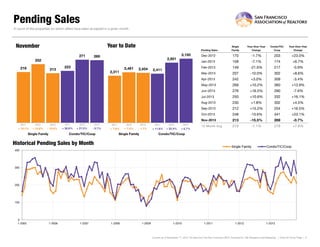
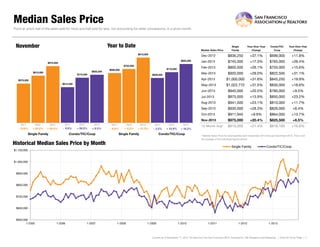

Residential real estate activity in San Francisco County saw encouraging signs in November 2013, though some metrics moderated from multiyear highs. New listings and pending sales decreased month-over-month for both single family homes and condos/co-ops. However, median sales prices continued rising sharply with a 20.4% increase for single family homes and 6.5% for condos/co-ops compared to November 2012. Strong economic data and job growth are supporting the housing recovery. Watch for further tapering of the Federal Reserve's stimulus program in March 2014.


