Download as PDF, PPTX
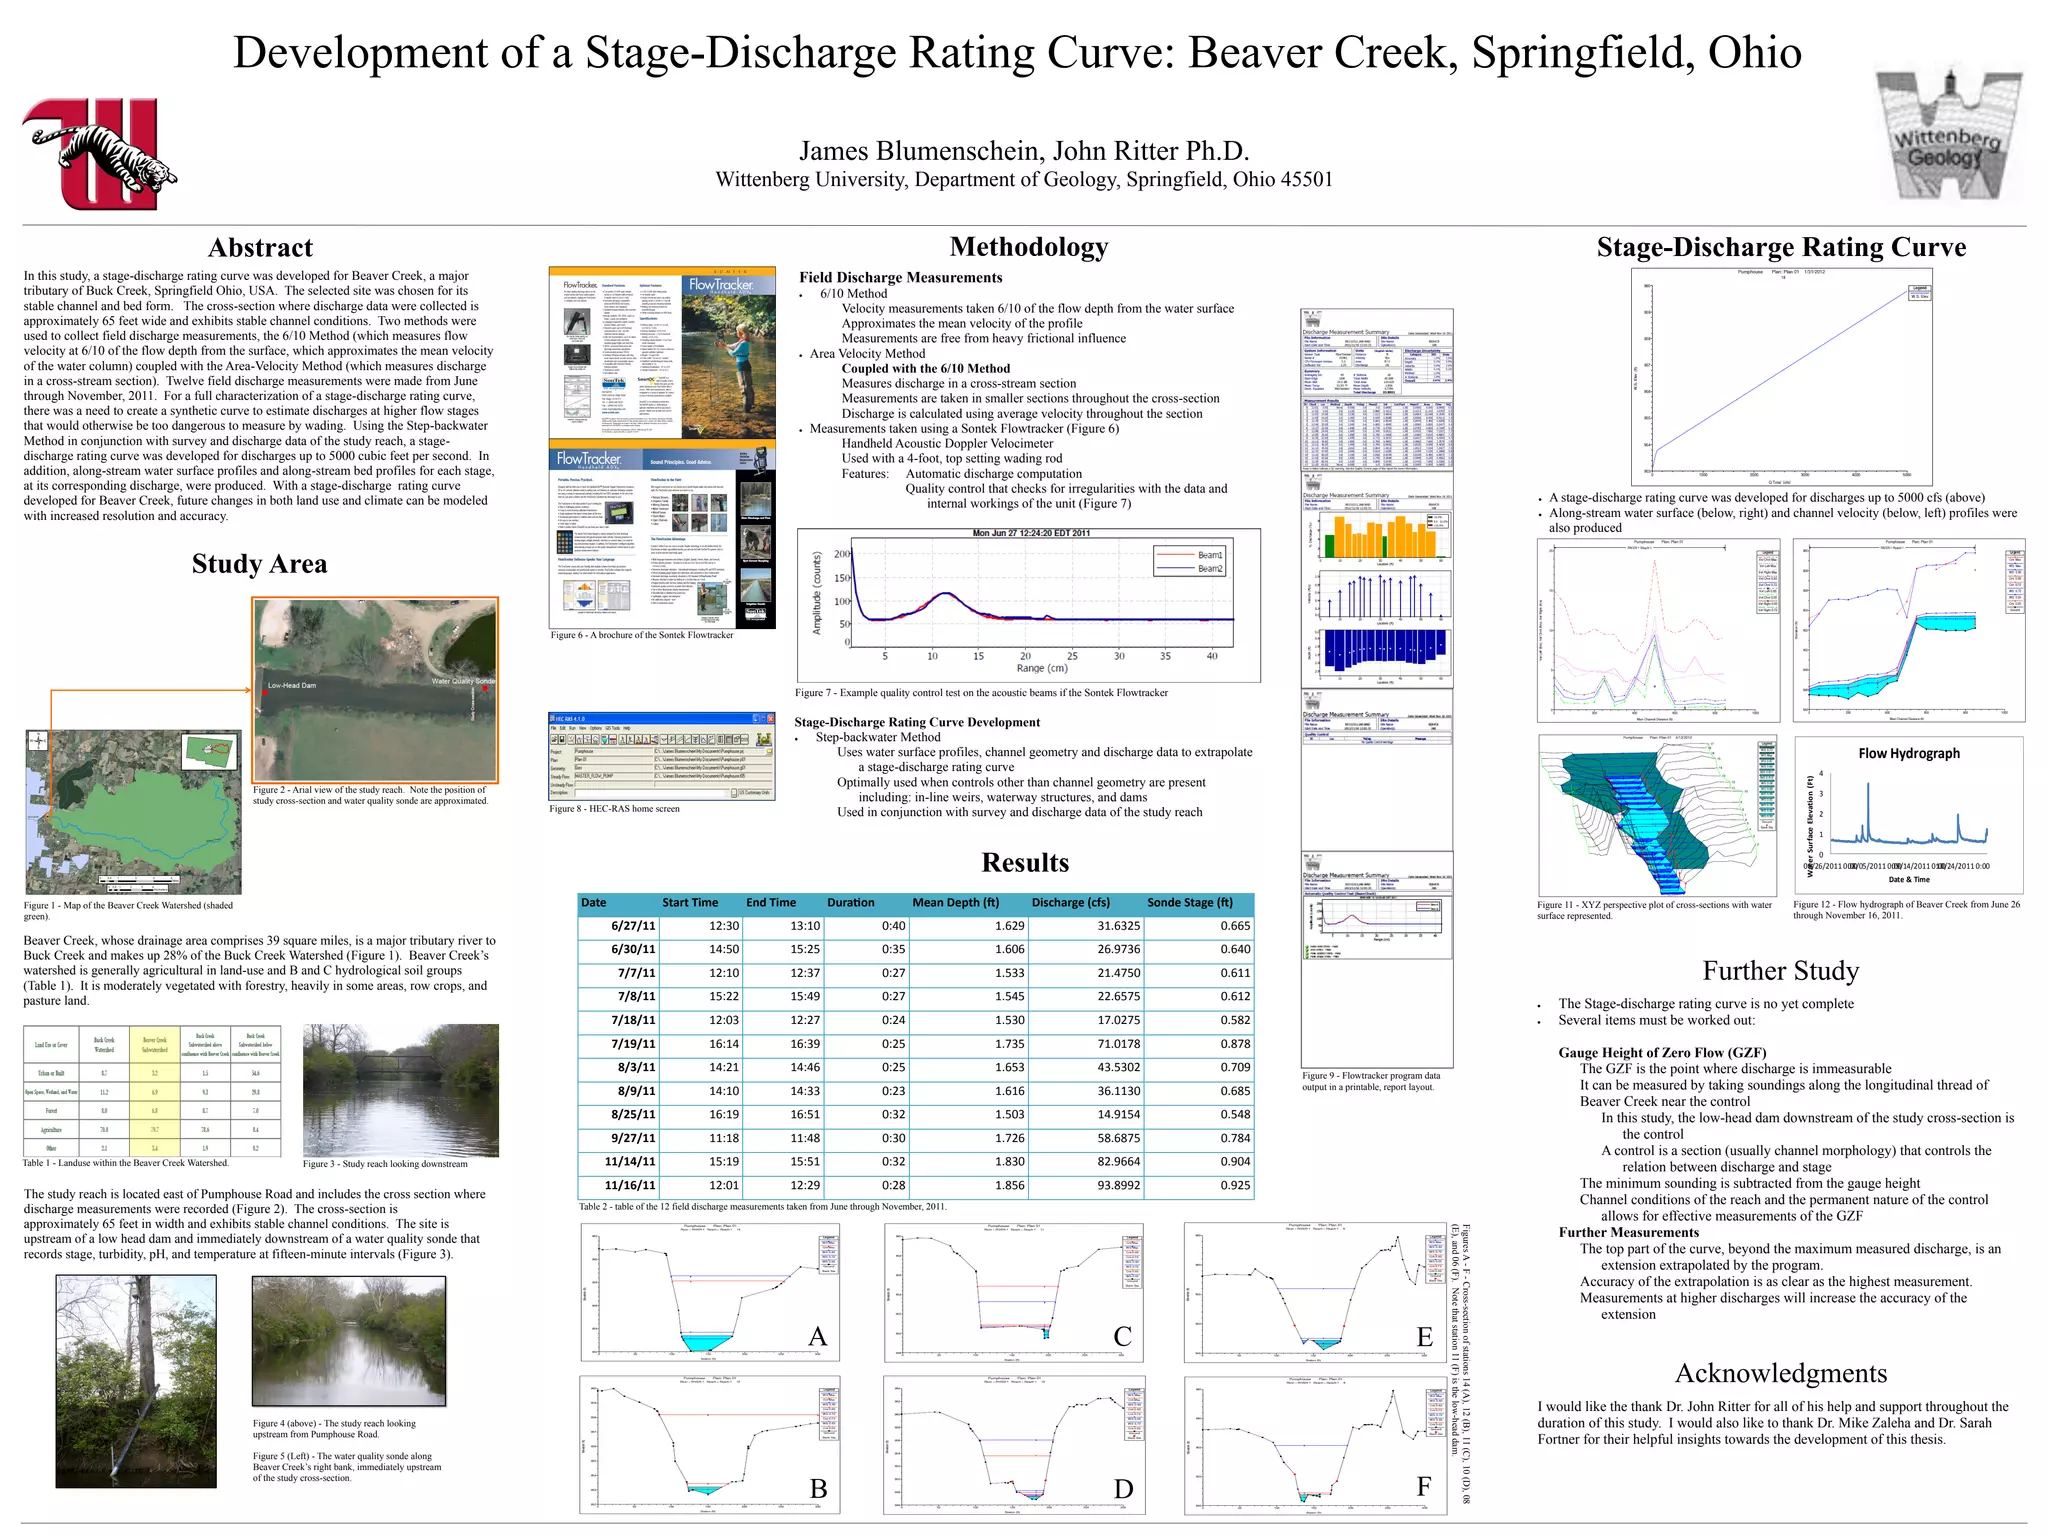

This study developed a stage-discharge rating curve for Beaver Creek in Springfield, Ohio using field measurements and modeling. Twelve discharge measurements were taken between June and November 2011 using acoustic Doppler velocity meters. A stable cross-section 65 feet wide was used. Step-backwater modeling extrapolated the rating curve to 5000 cubic feet per second and produced water surface and velocity profiles. The rating curve allows future changes in land use and climate to be modeled more accurately.