This document discusses a study that analyzed the effect of varying rotor speeds on the quality parameters of rotor spun yarn. Samples of 20 Ne rotor yarn were produced at 5 different rotor speeds. Tests were conducted to determine values for mass irregularity (Um%), imperfections, hairiness, and strength. Both single and multiple linear regression analyses were used to establish relationships between rotor speed and quality parameters and to develop a multiple regression equation using all the parameters. The results showed that with increased rotor speed, Um%, CVm% and imperfection index declined, while hairiness and strength improved.


![Impact of CVm% on rotor speed
The favorable impact of processing parameters on the
yarn characteristics were accessed by co-efficient of
variation (CVm %), imperfection index (IPI), hairiness,
tenacity, count strength product (CSP) and force at break.
The yarn qualities were improved with increasing of rotor
speed and rotor diameter.
The results indicate that these variables significantly
affects unevenness [U%], coefficient of variation (CV %),
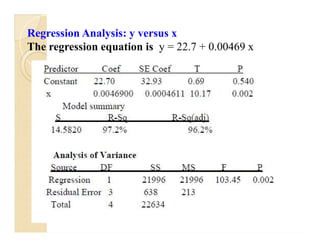
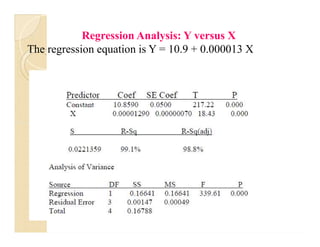
Regression Analysis: y versus x
The regression equation is y = 14.0 + 0.000015 x
Impact of CVm% on rotor speed
The favorable impact of processing parameters on the
yarn characteristics were accessed by co-efficient of
variation (CVm %), imperfection index (IPI), hairiness,
tenacity, count strength product (CSP) and force at break.
The yarn qualities were improved with increasing of rotor
speed and rotor diameter.
The results indicate that these variables significantly
affects unevenness [U%], coefficient of variation (CV %),
Regression Analysis: y versus x
The regression equation is y = 14.0 + 0.000015 x](https://image.slidesharecdn.com/termpaperpptfinal3-200827104525/85/seminar-on-research-methodology-3-20-320.jpg)