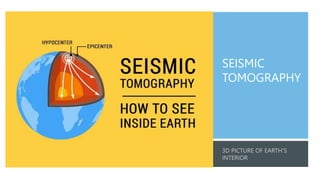
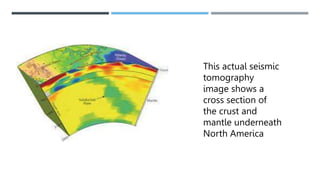
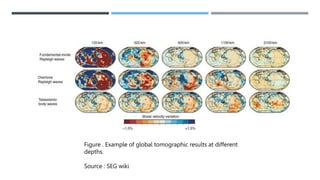
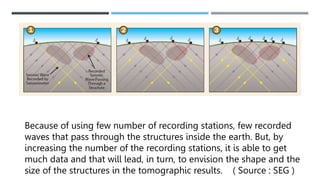
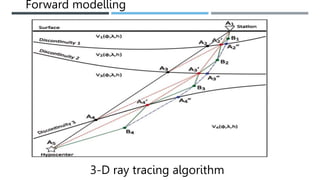
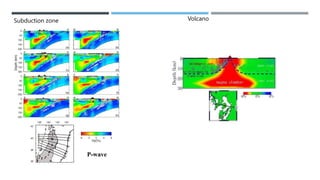
SEISMIC
TOMOGRAPHY
We can’t physically go inside the Earth. But we use imaging and
seismic tomography from earthquakes to see inside our planet.
During an earthquake, a break occurs at a fault. This is the driving
force that generates seismic waves through the crust and mantle. We
record each pulse at seismic stations from around the world.
Depending on the type of rock, waves either speed up or slow down.
If the rock is cold, waves travel quickly. But if rocks are hot, waves
travel slowly.
For every earthquake, we listen and record the seismic waves like a
tape recorder. From these seismology readings, we produce 3D
models of the Earth’s interior as a tomography.
This actual seismic
tomography
image shows a
cross section of
the crust and
mantle underneath
North America
Figure . Example of global tomographic results at different
depths.
Source : SEG wiki
Because of using few number of recording stations, few recorded
waves that pass through the structures inside the earth. But, by
increasing the number of the recording stations, it is able to get
much data and that will lead, in turn, to envision the shape and the
size of the structures in the tomographic results. ( Source : SEG )
Raypath’s coverage along North America continent
a) Block approach,
b) Grid approach
c) Boundary grid
approach
Model parameterization
The velocity at each grid node is regarded as an unknown parameter. By using an interpolation function, the
velocity perturbation at any point can be calculated.
where φ is latitude, λ is longitude, and h is the depth from the Earth’s surface; φi, λj, and hk represent the
coordinates for the eight grid nodes surrounding the point (φ, λ, h). Vm(φi, λj ,hk) is the velocity at the grid net
set for the m-th layer.
3-D ray tracing algorithm
Forward modelling
Inversion
Because the data depends on the model parameters and the raypath geometry, tomography is non-linear
method. To make inversion, the tomography should be firstly linearized by using this equation d = Gm + e.
Resolution test
It's an important
understand the resolution
capability of the model
parameters. This is often
tested by constructing a
synthetic model.
Result of checkboard resolution test
• Interpretation of Earthquake Tomographic results
(Say Something)
• Applications of Seismic Tomography at some areas
Subduction zone Volcano
Oil and gas exploration by Seismic Tomography
Passive seismic tomography
Cross well seismic tomography
So far, seismic tomography has taught scientists that
Earth structure is more complicated than a simple
layered sphere divided into a crust, mantle, and core,
as depicted in many textbooks.
The mantle, for example, contains
materials of different compositions and
temperatures.
It holds plumes of rising hot rock and warped pieces
of
old oceanic crust and mantle that have been
subducted
beneath other tectonic plates. The images we have
now
of Earth’s interior are like blown-up pictures taken
from
early models of digital cameras. As more
seismometers
are placed on the surface to catch more seismic
waves,
the pictures are becoming sharper and scientists are
seeing more details. With these details, scientists are
making new discoveries about structures in Earth’s
interior, and with each new set of images, they are

Seismic Topography.pptx

  • 1.
  • 3.
    We can’t physicallygo inside the Earth. But we use imaging and seismic tomography from earthquakes to see inside our planet. During an earthquake, a break occurs at a fault. This is the driving force that generates seismic waves through the crust and mantle. We record each pulse at seismic stations from around the world. Depending on the type of rock, waves either speed up or slow down. If the rock is cold, waves travel quickly. But if rocks are hot, waves travel slowly. For every earthquake, we listen and record the seismic waves like a tape recorder. From these seismology readings, we produce 3D models of the Earth’s interior as a tomography.
  • 5.
    This actual seismic tomography imageshows a cross section of the crust and mantle underneath North America
  • 6.
    Figure . Exampleof global tomographic results at different depths. Source : SEG wiki
  • 7.
    Because of usingfew number of recording stations, few recorded waves that pass through the structures inside the earth. But, by increasing the number of the recording stations, it is able to get much data and that will lead, in turn, to envision the shape and the size of the structures in the tomographic results. ( Source : SEG )
  • 8.
    Raypath’s coverage alongNorth America continent
  • 9.
    a) Block approach, b)Grid approach c) Boundary grid approach Model parameterization
  • 10.
    The velocity ateach grid node is regarded as an unknown parameter. By using an interpolation function, the velocity perturbation at any point can be calculated. where φ is latitude, λ is longitude, and h is the depth from the Earth’s surface; φi, λj, and hk represent the coordinates for the eight grid nodes surrounding the point (φ, λ, h). Vm(φi, λj ,hk) is the velocity at the grid net set for the m-th layer.
  • 11.
    3-D ray tracingalgorithm Forward modelling
  • 12.
    Inversion Because the datadepends on the model parameters and the raypath geometry, tomography is non-linear method. To make inversion, the tomography should be firstly linearized by using this equation d = Gm + e.
  • 13.
    Resolution test It's animportant understand the resolution capability of the model parameters. This is often tested by constructing a synthetic model. Result of checkboard resolution test
  • 14.
    • Interpretation ofEarthquake Tomographic results (Say Something) • Applications of Seismic Tomography at some areas
  • 15.
  • 16.
    Oil and gasexploration by Seismic Tomography Passive seismic tomography
  • 17.
  • 18.
    So far, seismictomography has taught scientists that Earth structure is more complicated than a simple layered sphere divided into a crust, mantle, and core, as depicted in many textbooks. The mantle, for example, contains materials of different compositions and temperatures. It holds plumes of rising hot rock and warped pieces of old oceanic crust and mantle that have been subducted beneath other tectonic plates. The images we have now of Earth’s interior are like blown-up pictures taken from early models of digital cameras. As more seismometers are placed on the surface to catch more seismic waves, the pictures are becoming sharper and scientists are seeing more details. With these details, scientists are making new discoveries about structures in Earth’s interior, and with each new set of images, they are