The study uses seismic tomography to image P- and S-wave velocity perturbations in the crust and upper mantle beneath Iran. Arrival times from over 2800 earthquakes recorded at over 2000 stations were used to perform inverse tomography. The results show that the crust and upper mantle beneath the Iranian Plateau has lower velocities than the surrounding Arabian and Caspian plates. The anomalies provide evidence of subduction of the Oman Sea crust beneath southeast Iran, though the subduction pattern is more complex along the Zagros suture zone.
First Observation of the Earth’s Permanent FreeOscillation s on Ocean Bottom ...Sérgio Sacani
The Earth’s hum is the permanent free oscillations of the Earth recorded in the absence ofearthquakes, at periods above 30 s. We present the first observations of its fundamental spheroidaleigenmodes on broadband ocean bottom seismometers (OBSs) in the Indian Ocean. At the ocean bottom,the effects of ocean infragravity waves (compliance) and seafloor currents (tilt) overshadow the hum. In ourexperiment, data are also affected by electronic glitches. We remove these signals from the seismic traceby subtracting average glitch signals; performing a linear regression; and using frequency-dependentresponse functions between pressure, horizontal, and vertical seismic components. This reduces the longperiod noise on the OBS to the level of a good land station. Finally, by windowing the autocorrelation toinclude only the direct arrival, the first and second orbits around the Earth, and by calculating its Fouriertransform, we clearly observe the eigenmodes at the ocean bottom.
Fleeting Small-scale Surface Magnetic Fields Build the Quiet-Sun CoronaSérgio Sacani
Arch-like loop structures filled with million Kelvin hot plasma form the building blocks of the quiet-Sun corona.
Both high-resolution observations and magnetoconvection simulations show the ubiquitous presence of magnetic
fields on the solar surface on small spatial scales of ∼100 km. However, the question of how exactly these quietSun coronal loops originate from the photosphere and how the magnetic energy from the surface is channeled to
heat the overlying atmosphere is a long-standing puzzle. Here we report high-resolution photospheric magnetic
field and coronal data acquired during the second science perihelion of Solar Orbiter that reveal a highly dynamic
magnetic landscape underlying the observed quiet-Sun corona. We found that coronal loops often connect to
surface regions that harbor fleeting weaker, mixed-polarity magnetic field patches structured on small spatial
scales, and that coronal disturbances could emerge from these areas. We suggest that weaker magnetic fields with
fluxes as low as 1015 Mx and/or those that evolve on timescales less than 5 minutes are crucial to understanding
the coronal structuring and dynamics.
Crustal Structure from Gravity and Magnetic Anomalies in the Southern Part of...Editor IJCATR
The gravity and magnetic data along the profile across the southern part of the Cauvery basin have been
collected and the data is interpreted for crustal structure depths.The first profile is taken from Karikudito
Embalecovering a distance of 50 km. The gravity lows and highs have clearly indicated various sub-basins and ridges.
The density logs from ONGC, Chennai, show that the density contrast decreases with depth in the sedimentary basin,
and hence, the gravity profiles are interpreted using variable density contrast with depth. From the Bouguer gravity
anomaly, the residual anomaly is constructed by graphical method correlating with well data and subsurface geology.
The residual anomaly profiles are interpreted using polygon and prismatic models. The maximum depths to the granitic
gneiss basement are obtained as 3.00 km. The regional anomaly is interpreted as Moho rise towards coast. The
aeromagnetic anomaly profiles are also interpreted for charnockite basement below the granitic gneiss group of rocks
using prismatic model.
Crustal Structure from Gravity and Magnetic Anomalies in the Southern Part of...Editor IJCATR
The gravity and magnetic data along the profile across the southern part of the Cauvery basin have been collected and the data is interpreted for crustal structure depths.The first profile is taken from Karikudito Embalecovering a distance of 50 km. The gravity lows and highs have clearly indicated various sub-basins and ridges. The density logs from ONGC, Chennai, show that the density contrast decreases with depth in the sedimentary basin, and hence, the gravity profiles are interpreted using variable density contrast with depth. From the Bouguer gravity anomaly, the residual anomaly is constructed by graphical method correlating with well data and subsurface geology. The residual anomaly profiles are interpreted using polygon and prismatic models. The maximum depths to the granitic gneiss basement are obtained as 3.00 km. The regional anomaly is interpreted as Moho rise towards coast. The aeromagnetic anomaly profiles are also interpreted for charnockite basement below the granitic gneiss group of rocks using prismatic model.
The October 2004 Mw=7.1 Nicaragua earthquake: Rupture process, aftershock loc...Gus Alex Reyes
The subduction zone off the Nicaragua
coastline has been the site of several large
earthquakes in the past decades, including
the 1992 tsunami earthquake that was
anomalous in the size of the tsunami relative
to moment release [Kanamori and
Kikuchi, 1993]. As a focus site for both
the MARGINS-SEIZE and SubFac initiatives,
it is an area of keen interest for
scientists interested in earthquake rupture
and volcanic processes.
Ionospheric TEC Disturbances over South KoreaFollowing the 2011 Great Tohoku ...researchinventy
Ionospheric total electron contents (TEC) disturbances following the 2011 great Tohoku earthquake on March 11, 2011 were observed by a GPS network in South Korea. The impulsive TEC enhancements were first observed approximately 16.5 minutes after the beginning of the earthquake. Various types of seismic waves were also observed over South Korea.To investigate more detailed disturbances in the TEC, we processed the GPS data with a sampling rate of 1Hz and applied a band-pass filter with corner frequencies of 0.0 and 0.005 Hz. Small-scale traveling ionospheric disturbances (TIDs) with a period of approximately 4minutes (~250 seconds) were observed from 6:15 to 7:10 UT. These variations are considered to be a clear manifestation of the acoustic resonance oscillations. We also observed medium-scale TIDs with a period of approximately 15 minutes and a duration of approximately 60 minutes. A remarkable finding is that the damping of the amplitude of the medium-scale TIDs was observed clearly in the time series
1980 öncesi deprem istasyon sayısı Türkiye'de herhalde 50'den azdı ve bu nedenle deprem istatistiği çalışmaları Türkiye boyunca çok büyük alanlara bölünerek yapılmış. Okla gösterdiğim yerlerde magnitüd aralığı çok yetersiz. Bu çalışmada, 4x4 şeklinde dilimleme yapılmış. 400kmx400 km olarak dilimlere ayrılarak yapılmış. Veri olmadığı zaman mecbur ALANI büyütmek zorunda kalıyorsunuz... bu nedenle Makro-İstatistik İnceleme yapılmış oluyor.a/b oranını çalışmalarımda hiç kullanmadım fakat bana kalırsa yararlı bir parametre olarak görünüyor. Bir yıl içinde olması beklenen en büyük deprem büyüklüğünü veriyor. Buna göre bu çalışmada, bir yıl içinde beklenen en büyük deprem M=5 bulunmuş ve alan 39 E ve 41 B arasında bir yere denk geliyor... muhtemelen Karlıova Üçlü Bileşimi çevresi olabilir.
İstasyon dağılımı çift kanaldan yapılıyor ve bu kanallar AFAD ve KOERI. İlginç olan durum bu istasyonlar 1 YIL içinde yerleştirilmiyor ve YILLARA yayılan bir yerleştirme planı var. İstatistik çalışanlar için iyi özellikle, 'İstasyon Etkilerinin Sismisite Değişimine Muhtemel Etkileri' konusunu çalışmak isteyenler için. Özellikle, 1995 yılında ki çalışmam bununla ilişkili. https://npg.copernicus.org/articles/2/147/1995/
AFAD tarafından DAFZ civarında kurulmuş 28 istasyonu var ve 2006 yılında kurmaya başlamış ve süreç 2017 yılına kadar yükselerek devam etmiş. 2006 yılında 28 istasyonun tamamını 1 DEFA'da kurmuş olsa idi fay zonlarının deprem tehlikesinin araştırılması için önemli bir VERİ toplanması olacaktı ve bugüne kadar 15 yıllık veri üzerinde '0-İnsan Etkisi' olduğundan istatistik çalışmalar ile bulunan sonuçlar anlamlı olacaktı. Sıkça sorulan soru vardır, 'Depremler son yıllarda sayısal olarak artıyor mu?' diye, EVET artıyor çünkü depremi kayıt eden İSTASYON sayısı arttığı için. Bu açıdan, 'İnsana bağlı olarak deprem tehlike verisinde ki değişim' araştırma konusu olur mu? Neden olmasın!
Benzer durum KOERI'de var ve 2006 yılında 5 olan istasyon sayısını 2011 yılına kadar tedrici olarak 10 sayısına yükseltiyor. 2011 yılından sonra sayı 12'de sabit kalıyor.
2006 yılından günümüze DAFZ üzerinde İKİLİ KURUM tarafından kurulan toplam istasyon sayısı 40, fakat bunlar TEK 1 YILDA kurulmadığı için İSTATİSTİK çalışmalara ETKİSİ olumsuz. 2006 yılında 40 istasyon 1 DEFADA kurulsa idi, DAFZ boyunca fayların deprem potansiyelinin araştırılması açısından ÇOK İYİ bir potansiyel olacaktı.
Deprem İstatistiği çalışmalarında DİKKAT edilecek ÇOK noktalar var, bu noktalar bölgede ki VERİ KAPASİTESİ ve VERİ KALİTESİ'nin iyi araştırılması ile mümkün olur. Aslında burada ANLATILANLARI İstatistiksel Sismoloji dersinde detaylı tartıştım. Deprem İstatistiği çalışacak olan ve bu konuda çalışmak isteyenler bu dersler BAŞTAN SONA not alarak 1 KERE daha dinlese İYİ olur. AKSİ taktirde çalışmalarınız İYİ 1 BİLİMSEL TEMELE dayanmazsa çok yararsız olabilir.
How to Create Map Views in the Odoo 17 ERPCeline George
The map views are useful for providing a geographical representation of data. They allow users to visualize and analyze the data in a more intuitive manner.
Unit 8 - Information and Communication Technology (Paper I).pdfThiyagu K
This slides describes the basic concepts of ICT, basics of Email, Emerging Technology and Digital Initiatives in Education. This presentations aligns with the UGC Paper I syllabus.
The French Revolution, which began in 1789, was a period of radical social and political upheaval in France. It marked the decline of absolute monarchies, the rise of secular and democratic republics, and the eventual rise of Napoleon Bonaparte. This revolutionary period is crucial in understanding the transition from feudalism to modernity in Europe.
For more information, visit-www.vavaclasses.com
The Roman Empire A Historical Colossus.pdfkaushalkr1407
The Roman Empire, a vast and enduring power, stands as one of history's most remarkable civilizations, leaving an indelible imprint on the world. It emerged from the Roman Republic, transitioning into an imperial powerhouse under the leadership of Augustus Caesar in 27 BCE. This transformation marked the beginning of an era defined by unprecedented territorial expansion, architectural marvels, and profound cultural influence.
The empire's roots lie in the city of Rome, founded, according to legend, by Romulus in 753 BCE. Over centuries, Rome evolved from a small settlement to a formidable republic, characterized by a complex political system with elected officials and checks on power. However, internal strife, class conflicts, and military ambitions paved the way for the end of the Republic. Julius Caesar’s dictatorship and subsequent assassination in 44 BCE created a power vacuum, leading to a civil war. Octavian, later Augustus, emerged victorious, heralding the Roman Empire’s birth.
Under Augustus, the empire experienced the Pax Romana, a 200-year period of relative peace and stability. Augustus reformed the military, established efficient administrative systems, and initiated grand construction projects. The empire's borders expanded, encompassing territories from Britain to Egypt and from Spain to the Euphrates. Roman legions, renowned for their discipline and engineering prowess, secured and maintained these vast territories, building roads, fortifications, and cities that facilitated control and integration.
The Roman Empire’s society was hierarchical, with a rigid class system. At the top were the patricians, wealthy elites who held significant political power. Below them were the plebeians, free citizens with limited political influence, and the vast numbers of slaves who formed the backbone of the economy. The family unit was central, governed by the paterfamilias, the male head who held absolute authority.
Culturally, the Romans were eclectic, absorbing and adapting elements from the civilizations they encountered, particularly the Greeks. Roman art, literature, and philosophy reflected this synthesis, creating a rich cultural tapestry. Latin, the Roman language, became the lingua franca of the Western world, influencing numerous modern languages.
Roman architecture and engineering achievements were monumental. They perfected the arch, vault, and dome, constructing enduring structures like the Colosseum, Pantheon, and aqueducts. These engineering marvels not only showcased Roman ingenuity but also served practical purposes, from public entertainment to water supply.
Operation “Blue Star” is the only event in the history of Independent India where the state went into war with its own people. Even after about 40 years it is not clear if it was culmination of states anger over people of the region, a political game of power or start of dictatorial chapter in the democratic setup.
The people of Punjab felt alienated from main stream due to denial of their just demands during a long democratic struggle since independence. As it happen all over the word, it led to militant struggle with great loss of lives of military, police and civilian personnel. Killing of Indira Gandhi and massacre of innocent Sikhs in Delhi and other India cities was also associated with this movement.
The Indian economy is classified into different sectors to simplify the analysis and understanding of economic activities. For Class 10, it's essential to grasp the sectors of the Indian economy, understand their characteristics, and recognize their importance. This guide will provide detailed notes on the Sectors of the Indian Economy Class 10, using specific long-tail keywords to enhance comprehension.
For more information, visit-www.vavaclasses.com
Instructions for Submissions thorugh G- Classroom.pptxJheel Barad
This presentation provides a briefing on how to upload submissions and documents in Google Classroom. It was prepared as part of an orientation for new Sainik School in-service teacher trainees. As a training officer, my goal is to ensure that you are comfortable and proficient with this essential tool for managing assignments and fostering student engagement.
1. Geophys. J. Int. (2007) 169, 1089–1102 doi: 10.1111/j.1365-246X.2007.03317.x
GJI
Seismology
Seismic tomographic imaging of P- and S-waves velocity
perturbations in the upper mantle beneath Iran
Alireza Alinaghi,1,2
Ivan Koulakov3,4
and Hans Thybo1
1Geological Institute, University of Copenhagen, Denmark. E-mail: ali@geol.ku.dk
2International Institute of Earthquake Engineering (IIEES), Tehran, Iran
3GeoForschungsZentrum, Potsdam, Germany
4Institute of Geology SB RAS, Novosibirsk, Russia
Accepted 2006 November 29. Received 2006 November 29; in original form 2006 January 27
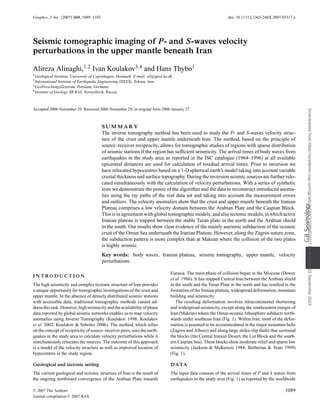
SUMMARY
The inverse tomography method has been used to study the P- and S-waves velocity struc-
ture of the crust and upper mantle underneath Iran. The method, based on the principle of
source–receiver reciprocity, allows for tomographic studies of regions with sparse distribution
of seismic stations if the region has sufficient seismicity. The arrival times of body waves from
earthquakes in the study area as reported in the ISC catalogue (1964–1996) at all available
epicentral distances are used for calculation of residual arrival times. Prior to inversion we
have relocated hypocentres based on a 1-D spherical earth’s model taking into account variable
crustal thickness and surface topography. During the inversion seismic sources are further relo-
cated simultaneously with the calculation of velocity perturbations. With a series of synthetic
tests we demonstrate the power of the algorithm and the data to reconstruct introduced anoma-
lies using the ray paths of the real data set and taking into account the measurement errors
and outliers. The velocity anomalies show that the crust and upper mantle beneath the Iranian
Plateau comprises a low velocity domain between the Arabian Plate and the Caspian Block.
This is in agreement with global tomographic models, and also tectonic models, in which active
Iranian plateau is trapped between the stable Turan plate in the north and the Arabian shield
in the south. Our results show clear evidence of the mainly aseismic subduction of the oceanic
crust of the Oman Sea underneath the Iranian Plateau. However, along the Zagros suture zone,
the subduction pattern is more complex than at Makran where the collision of the two plates
is highly seismic.
Key words: body waves, Iranian plateau, seismic tomography, upper mantle, velocity
perturbations.
I N T RO D U C T I O N
The high seismicity and complex tectonic structure of Iran provides
a unique opportunity for tomographic investigations of the crust and
upper mantle. In the absence of densely distributed seismic stations
with accessible data, traditional tomographic methods cannot ad-
dressthistask.However,highseismicityandtheavailabilityofphase
data reported by global seismic networks enables us to map velocity
anomalies using Inverse Tomography (Koulakov 1998; Koulakov
et al. 2002; Koulakov & Sobolev 2006). The method, which relies
on the concept of reciprocity of source–receiver pairs, uses the earth-
quakes in the study area to calculate velocity perturbations while it
simultaneously relocates the sources. The outcome of this approach
is a model of the velocity structure as well as improved location of
hypocentres in the study region.
Geological and tectonic setting
The current geological and tectonic structure of Iran is the result of
the ongoing northward convergence of the Arabian Plate towards
Eurasia. The main phase of collision began in the Miocene (Dewey
et al. 1986). It has trapped Central Iran between the Arabian shield
in the south and the Turan Plate in the north and has resulted in the
formation of the Iranian plateau, widespread deformation, mountain
building and seismicity.
The resulting deformation involves intracontinental shortening
and widespread seismicity, except along the southeastern margin of
Iran (Makran) where the Oman oceanic lithosphere subducts north-
wards under southeast Iran (Fig. 1). Within Iran, most of the defor-
mation is assumed to be accommodated in the major mountain belts
(Zagros and Alborz) and along large strike-slip faults that surround
the blocks (the Central Iranian Desert, the Lut Block and the south-
ern Caspian Sea). These blocks show moderate relief and sparse low
seismicity (Jackson & McKenzie 1984; Berberian & Yeats 1999)
(Fig. 1).
DATA
The input data consists of the arrival times of P and S waves from
earthquakes in the study area (Fig. 1) as reported by the worldwide
C
2007 The Authors 1089
Journal compilation C
2007 RAS
Downloaded
from
https://academic.oup.com/gji/article/169/3/1089/624217
by
guest
on
22
September
2023
2. 1090 A. Alinaghi, I. Koulakov and H. Thybo
Figure 1. Map of the study area showing Iran and the neighbouring Arabian and Turan plates together with the main structural units: Alborz and Zagros
mountain ranges, Lut and Capian blocks and Central Iran microplate (Takin 1972) which are surrounded by major active faults such as Doruneh and Dashte-
Bayaz (D.B.F). The boundary between the Zagros mountains and the Central Iranian Desert (C.I.D.) is delineated by Main Zagros Thrust (MZT). Its continuation
in the Oman Sea represents the subduction at Makran. Also shown are Palaeo-Thetys (PTCS ) and Neo-Thetys (NTCS) and Dorouneh fault. The seismicity
shown by red circles is from the ISC bulletins (1964–1996). Vertical and horizontal axis annotations are degrees of north and east geographical latitudes and
longitudes, respectively.
seismological stations (Fig. 2) to the ISC for the period of 1964–
1996 (ISC 2001). In total we selected 2852 earthquakes in the study
region from which 242 664 P and 23 207 S arrival times are reported
by 2081 stations (Fig. 2) of the worldwide network were used. In
addition 3856 pP and 341sS depth phases were used for constraining
the depth of the corresponding sources. A major part of the data set
is the arrival times reported by stations in Europe, clearly inferred
from the azimuthal distribution of the rays (Fig. 3). The majority of
the readings correspond to epicentral distances between 10◦
and 60◦
(Fig. 3). Short distance rays (up to 10◦
of epicentral distance) are
chiefly used for source relocation, whereas the teleseismic rays are
considered to be the main source of information on deep velocity
structure.
M E T H O D O L O G Y
Here, we briefly describe the methodology which is discussed in
detail by Koulakov Sobolev (2006).
Prior to inverting the arrival time residuals for simultaneous de-
termination of velocity perturbations and hypocentres parameters,
we relocate the hypocentres and recompute the arrival time residuals
based on ak135 global velocity model.
Pre-processing of the arrival times for the inversion was per-
formed in two stages. In the first stage P- and S-waves arrival time
residuals with respect to the JB model (Jeffreys Bullen 1940) in
the ISC catalogue were replaced by residuals computed on the basis
of ak135 model (Kennett et al. 1995). Standard corrections such as
those for elevation of the stations and earth ellipticity (Dziewonski
Gilbert 1976) are followed by corrections for variable Moho
depths. Moho depths at the piercing points for each source–receiver
pair are derived from a model of the crust with a resolution of 1◦
× 1◦
(Fig. 4), which is available for most parts of Eurasia and is a compi-
lation of a number of models (http//mahi.uscd.edu/Gabi/rem.html,
Laske 2004, personal communication, 2004). For sources and re-
ceivers not covered by the high resolution model we use a model of
2◦
× 2◦
resolution from Bassin et al. (2000).
In the second stage of the processing, hypocentres were rede-
termined and events with unreliable locations were discarded. Ab-
solute relocation of the earthquakes was done by minimizing the
value of a function describing the time residuals first by search-
ing in a regular grid constructed around the preliminary location
of the sources (here, ISC location) and then further constraining
the location by use of a gradient descending method (Koulakov
Sobolev 2006). During this process the outlier traveltime residuals
were identified and sorted out. The outliers are defined as residuals
with standard deviations of over 4 s. They constitute 10–15 per cent
of data set. The relative relocation of events in clusters was then per-
formed using a double difference method (Waldhauser Ellsworth
2000) through which a linear system of equations for all combina-
tions of source–receiver pairs in clusters with predefined dimensions
are constructed and solved by an iterative LSQR method (van der
Sluis van der Vorst 1987). The static station corrections were
C
2007 The Authors, GJI, 169, 1089–1102
Journal compilation C
2007 RAS
Downloaded
from
https://academic.oup.com/gji/article/169/3/1089/624217
by
guest
on
22
September
2023
3. Seismic tomographic imaging 1091
Figure 2. Distribution of the 2081 seismic stations that contributed to the data set used in this study. The size of the triangles reflects the number of events
reported by each station. Each circle indicates 30◦ of epcientral distance. The centre of the figure represents the study region (Iran).
not removed although they were determined simultaneously with
hypocentres.
The expected lateral velocity variations are assumed to have am-
plitudes less than some percentage of the reference velocity and
dimensions larger than the Fresnel volume at crustal and upper-
mantle depths. The Fresnel zone is estimated to be about 10 km
at crustal depths and increases with depth to not above 50 km
in the upper mantle. Therefore, the 3-D ray paths from relocated
hypocentres to the recording stations are approximated by ray paths
in the 1-D reference earth model (ak135, Kennett et al. 1995),
with the Moho set at 40 km depth as the average crustal thick-
ness in Iran. Ray misplacement and the resulting error in velocity
perturbations are insignificant, as we have limited our depth of in-
vestigation to about 700 km below the surface which is enough
to observe the interaction of tectonic features at upper-mantle
depths.
Parametrization and inversion
The velocity field is parametrized by an irregular grid of non-
overlapping hexahedra with nodes placed on 16 horizontal planes at
depths of 50, 100, 150, 220, 290, 360, 430, 500, 570, 640, 710 and
800 km. On each plane, nodes are distributed along parallel lines
with spacing proportional to the ray density (Fig. 5). The nodes on
each level are interconnected to form trapezoids. The vertices of
trapezoids from adjacent depth levels connect to form a grid of hex-
ahedral cells. Thus, each point in the parametrized study volume
is located inside one hexahedron and influenced by eight velocity
nodes.
The first derivative matrix which reflects the effect of velocity
variations on the traveltime of the rays is composed of two elements
for the P- and S-waves velocity perturbations, four elements for the
hypocentres and two elements for station corrections.
An additional matrix block is constructed for smoothing the re-
sults, with coefficients for velocity perturbations, source parameters
and station corrections. An extra block of the matrix contains arrival
times as reported by the stations in the area from teleseismic earth-
quakes. This is a modification to the inversion scheme presented by
Koulakov Sobolev (2006) and, therefore, the matrix includes both
inverse and traditional elements.
The resulting matrix is inverted using the LSQR method (Paige
Saunders 1982; van der Sluis van der Vorst 1987) for simul-
taneous determination of P- and S-waves velocity perturbations,
hypocentre parameters and station corrections. By postulating that
the inferred velocity anomalies do not bend the original ray paths,
basic linearization assumptions are held and a linear inversion is
conducted.
FollowingKoulakovSobolev(2006)andKoulakov etal.(2002)
the whole study area is divided into three smaller overlapping re-
gions. The inversion is performed independently in each region and
consequently the results in overlaping areas are averaged. For each
block, in order to avoid the bias introduced by alignment of nodes
in parallel lines, the final velocity model is calculated as the mean
of values in four different orientations of the grids (0◦
, 45◦
, 90◦
C
2007 The Authors, GJI, 169, 1089–1102
Journal compilation C
2007 RAS
Downloaded
from
https://academic.oup.com/gji/article/169/3/1089/624217
by
guest
on
22
September
2023
4. 1092 A. Alinaghi, I. Koulakov and H. Thybo
Figure 3. Histograms of data distribution with respect to the epicentral distance (top) and azimuth (bottom).
and 135◦
). The final model is, therefore, obtained as the average of
12 separate models.
R E S U LT S
The results of redetermination of the hypocentres are shown in Fig. 6
together with the ISC and EHB (Engdahl et al. 1998) locations.
Despite insufficient depth phases relocation has been successful in
regrouping the events into a number of depth ranges. It is clear that
in northern Iran, except for earthquakes across the Caspian Sea most
earthquakes are of crustal depth. This is an important indication that
along Alborz and its eastern continuation (Kopeh-Dagh) and also
at the boundary between the Lut Block and Central Iran (Fig. 1)
the earthquakes are related to seismogenic faults located mainly
in the upper crust. This pattern changes along the seismic belt across
the Caspian Sea, where earthquakes are perceptibly deeper than
those in Kopeh-Dagh and in the Caucuses (southeast and northwest
of the belt, respectively). Although our relocation has shifted most
of the events in Zagros to shallower depths, at its southeastern edge
where Zagros abuts the almost aseismic subduction zone of Makran,
a concentration of deeper events is observed. The significance and
tectonic implications of this observation need further analysis based
on local data and waveform analysis.
The results of inversion for the P- and S-waves velocity anoma-
lies in the study volume are presented in images which resulted
from averaging values of three overlapping circular blocks each of
a size of 8◦
in diameter, which jointly cover the whole study region.
C
2007 The Authors, GJI, 169, 1089–1102
Journal compilation C
2007 RAS
Downloaded
from
https://academic.oup.com/gji/article/169/3/1089/624217
by
guest
on
22
September
2023
5. Seismic tomographic imaging 1093
Figure 4. Map of the crustal thickness for Eurasia with 1◦ × 1◦ resolution (from http//mahi.uscd.edu/Gabi/rem.html, (Laske, 2004, personal communication,
2004) used in this study for crustal correction. Vertical and horizontal axis annotations are degrees of north and east geographical latitudes and longitudes,
respectively.
The velocity anomalies are shown only if the distance to the near-
est parametrization node is less than a predefined value of dmax =
50 km.
Horizontal sections at different depth levels for both P- and
S-waves velocity anomalies (Fig. 7) show that down to 220 km
depth, the tectonically active Iran interior is characterized by low
P- and S-waves velocity anomalies, in contrast to high velocity do-
mains of the Arabian and Eurasian plates to the south and north of
the territory. The similarity of the anomaly features in the P and S
horizontal sections is an indication for the conformity of the results.
Below the 220 km depth the anomaly signs which leads to complete
reversal of pattern below the 410 km discontinuity in the upper man-
tle so that Central Iran represents a high velocity domain in both P-
and S-waves velocity sections.
In order to assess the success of our pre-processing method in
treating the noisy ISC data and to test the effect of our relocation
algorithm on the final tomograms, we used the EHB pre-processed
global data set of Engdahl et al. (1998), which first, utilizes more
depth phases than our data set for relocation of sources and secondly,
adopts a different approach in identification and discarding the out-
liers. Using this catalogue we skipped the stage of absolute and
relative relocation of earthquakes prior to the inversion. The results
presented in horizontal sections (Fig. 8) show striking similarities
with the results (Fig. 7), that we obtained by pre-processing the ISC
catalogue as described earlier in this paper. The robustness of the
results demonstrates that our handling of the noisy ISC data can
increase the signal-to-noise ratio to the extent that main structural
features are resolvable and stable.
Seven vertical cross-sections (Fig. 9) illustrate how Central Iran is
juxtaposed against the Arabian Plate in the south and the Turan Plate
in the north. Across the Zagros system, (profiles 1–5) we observe
features that indicate both subduction and subsequent collisional
stage of convergence between the high velocity Arabian Plate and
the low velocity Central Iran. Along Zagros and in particular at
C
2007 The Authors, GJI, 169, 1089–1102
Journal compilation C
2007 RAS
Downloaded
from
https://academic.oup.com/gji/article/169/3/1089/624217
by
guest
on
22
September
2023
6. 1094 A. Alinaghi, I. Koulakov and H. Thybo
Figure 5. P-wave ray density at depth slices from 50 to 640 km for a circular block of 8◦ (epicentral distance) with 0◦ grid orientation in the study area,
superimposed on grids constructed around nodes (black dots). The colour scale represents normalized values of the ray density with respect to a 50 × 50 km2
cell at 50 km depth through which 49 014 rays have traversed. Vertical and horizontal axis annotations are degrees of north and east geographical latitudes and
longitudes, respectively.
Makran (profiles 6 and 7), structures that indicate subduction are
observed. The boundary between Central Iran and Eurasia, along
the Alborz mountains appear to be different from the Central Iran
to Arabian Shield boundary. This is also reflected by shallow depths
of almost all earthquakes in the Alborz system in contrast to more
frequently occurring deeper events along Zagros if the patterns of
depth distributions rather than absolute depth values are relied on.
Besides,anapparentlysouth-dippinghighvelocitystructureinFig.9
could be interpreted as a relic of an ancient subduction zone related
to the old Tethys. Sensitivity tests as they follow in the next section
confirm that these features are real even though exact geometries
cannot be imaged in detail.
The results presented above as vertical cross-sections are in good
qualitative agreement with the finest global tomography results
(0.6◦
resolution) of the region where two cross-sections across
Makran and Caspian Sea were presented (Bijwaard et al. 1998).
S E N S I T I V I T Y T E S T S
A N D S Y N T H E T I C S
Analysis of the resolution power of the data and algorithm is carried
out in a series of sensitivity tests. We have computed the residual
traveltimes for synthetic models along the same ray paths as traced
for the real data set, and after addition of the noise they are inverted
C
2007 The Authors, GJI, 169, 1089–1102
Journal compilation C
2007 RAS
Downloaded
from
https://academic.oup.com/gji/article/169/3/1089/624217
by
guest
on
22
September
2023
7. Seismic tomographic imaging 1095
Figure 6. Comparision of the map of the epicentres derived from ISC catalogue (top left) and relocated during this study (top right) with EHB relocations
(bottom) as colour coded according to the depths of hypocentres. In spite of insufficient depth phases to appropriately constrain the depths, the relocation
algorithm has been successful in regrouping the events as expected from background seismotectonics, where according to ISC locations (left) the distinction
is blurred. Vertical and horizontal axis annotations are degrees of north and east geographical latitudes and longitudes, respectively.
in order to test the degree to which we may reconstruct the original
synthetic models. This is the approach taken in large tomography
studies due to practical problems with computing the resolution ma-
trix for large inverse problems. While we present the results we are
aware of the overestimation involved in restoring the anomalies due
to neglecting the bending of rays encountering seismic anomalies.
Thesynthetictimeswerecalculatedwithdelaysrelatedtovelocity
anomalies which are integrated along the ray paths in the reference
ak135 velocity model and added to the reference model traveltimes.
Random noise with 1 s standard deviation and a distribution sim-
ilar to the histogram of the real ISC delays (Fig. 10) was added to
delay times. In addition, outlier residual arrival times were intro-
duced with amplitudes of 10 per cent of the noise multiplied by 10,
in order to realistically simulate the noisy ISC data (the presence of
10 per cent outliers).
The resulting theoretical arrival times, thus computed, were used
as the input data for absolute and relative relocation of the events
prior to inversion for velocity perturbations. To achieve unbiased
resolution,thesyntheticdatawereinvertedwiththesameparameters
as used for the inversion of the actual data.
The first estimation of the resolution was made by the popular
checkerboard test in which a 3-D pattern of checkerboard anoma-
lies with alternating signs was used as the synthetic input model
(Fig. 11). Through this test we investigate the degree of smear-
ing to which model features are still resolvable. We chose cells of
1◦
× 1◦
for the compressional and 2◦
× 2◦
for the shear waves tak-
ing into account the lower sampling of the study volume by shear
waves than by compressional waves. The central part of Iran where
the seismicity and consequently the illumination by ray coverage is
low, strong smearing is observed. The larger size of the checker-
board cells for the S wave synthetics has improved the restoration
level while the resolution has decreased. We do not see tangible
reduction of restoration level with increasing depths, even though
at deeper parts of the upper mantle, larger ray misplacements are
expected. Therefore, we conclude that ray misplacement even close
to cut-off depth of the study volume is lower than the resolvability of
the data and the algorithm. In other words, the linear assumption on
the ray tracing does not introduce errors above the resolution limit.
We believe that the 1◦
resolvability of the P-wave model which ac-
cording to this test is an underestimation of the effective resolution
is enough to detect subduction features that usually occur on such
scales. The smearing is less than 50–100 km in the central parts of
the P model whereas it is about 100–200 km in the S-wave model. At
the edge of the models where the ray coverage is low, the smearing
C
2007 The Authors, GJI, 169, 1089–1102
Journal compilation C
2007 RAS
Downloaded
from
https://academic.oup.com/gji/article/169/3/1089/624217
by
guest
on
22
September
2023
8. 1096 A. Alinaghi, I. Koulakov and H. Thybo
Figure 7. Maps of P- and S-waves velocity anomalies for Iran and neighbouring regions presented as horizontal sections from depths of 50 to 640 km. Down
to the depth of about 220 km, the Iran interior, which is a structural amalgamation of different blocks and microplates, represents a low velocity zone, whereas
the underformed Eurasian and Arabian plates to the north and the south, respectively, are high velocity domains. At depths below the 410 km discontinuity in
the upper mantle the pattern reverses so that Central Iran in contrast to neighbouring southern and northern territories is a high velocity domain. The colour
coded scale represents velocity perturbations in percentage. Vertical and horizontal axis annotations are degrees of north and east geographical latitudes and
longitudes, respectively.
approaches 500 km. As expected, smearing and smoothing of the
anomalies reduce the amplitudes of the anomalies by distributing
the delays over wider zones than in the input model.
The second synthetic test represents a relatively realistic situation
where the initial model includes subducting slabs penetrating into
the upper mantle, detached slabs and low velocity features in the
crust and upper mantle (Fig. 12). Noise with an average rms value
of 1.00 s and also, outliers, which constitute 10 per cent of residuals
have been added to the input data. Most of the outliers were rejected
during the absolute relocation such that the average noise level of
the considered residuals due to velocity anomalies was in fact only
0.44 s. This relatively small value may be explained by deep pen-
etration of the synthetic rays. The crustal rays which constitute a
significant part of the data set, do not pass through these upper-
mantle anomalies and, therefore, have zero values of the residuals.
This value of the noise (random noise and outliers) is larger than
what is expected from the actual data. Indeed, the variance reduction
of the data in this test (15 per cent) is significantly lower than what
we observe in the real data (41 per cent).
The inversion which follows the step of absolute and relative
relocation of hypocentres has successfully managed to reconstruct
the original features especially well in the P-wave sections where the
ray coverage and amount of data are significantly larger than for the
S waves. Smearing and deterioration of resolution with increasing
depth, as observed in both P- and S-waves sections, can be attributed
to ray misplacements which becomes more severe approaching the
cut-off depth of the study volume. This test shows that even with the
exaggerated level of the noise, the main patterns are reconstructed
C
2007 The Authors, GJI, 169, 1089–1102
Journal compilation C
2007 RAS
Downloaded
from
https://academic.oup.com/gji/article/169/3/1089/624217
by
guest
on
22
September
2023
9. Seismic tomographic imaging 1097
Figure 8. The same as Fig. 7 but based on the EHB earthquake catalogue (Engdahl et al. 1998) instead of the pre-processed ISC earthquake catalogue as the
input data. All other parameters were held constant for comparing the results. The main features seem to be stable in the two sets of the results. The colour
coded scale represents velocity perturbations in percentage. Vertical and horizontal axis annotations are degrees of north and east geographical latitudes and
longitudes, respectively.
correctly although stronger smearing of the resulting anomalies is
observed at depth. Hence, the necessary relocation seems to have a
significant effect on the results. In this synthetic case, the relocation
of the sources tends to decrease the resolution. In the real data case,
we expect that the simultaneous relocation and inversion for model
parameters will increase the obtainable resolution.
Both synthetic tests have shown that the resolution is mainly
controlled by the geometry of source and receivers and less by the
noise and uncertainties in the traveltime readings.
D I S C U S S I O N
The use of 1-D ray tracer is economically viable for huge matrices
like in our case. However, it can cause mislocation of rays especially
at lower mantle depths. In order to alleviate this spurious effect we
set the cut-off depth of our investigation to about 700 km, which
is deep enough to map the tectonic features of interest. Besides,
numerical modelling (Zhao Lei 2004) has shown that the mislo-
cation of the P ray travelling about 40◦
, epicentral distance (which
roughly corresponds the distance that the bulk of the rays in our data
traverse) calculated using a 3-D ray tracer compared to a 1-D ray
tracer at the midpoint is less than 50 km at the most. This is lower
than the resolution of our findings and, therefore, we do not expect
large discrepancies with results obtained using a 3-D ray tracer in
our future work. Assuming that the amplitudes of mapped velocity
anomalies are within a few percents of the 1-D reference velocity
model we have simplified the problem by avoiding consideration of
bending of rays and solving the inverse problem non-linearly.
The variable cell size of the parametrized grid provides a means
to increase the resolution where the number of crossing ray paths
is low and thus high amplitude artefacts related to poor sampling
are reduced. To reduce similar high amplitude spurious anomalies
C
2007 The Authors, GJI, 169, 1089–1102
Journal compilation C
2007 RAS
Downloaded
from
https://academic.oup.com/gji/article/169/3/1089/624217
by
guest
on
22
September
2023
10. 1098 A. Alinaghi, I. Koulakov and H. Thybo
Figure 9. Vertical cross-sections showing the results of inversion for P (left panels) and S (right panels) velocity anomalies across seven profiles as indicated
on the small map (left) and depicted from top to bottom. The north dipping high velocity structures observed along profile 3 (across the western part of the
Zagros) and profile 6 (the Makran region) are interpreted as images of subduction of the Arabian Plate under Iran whereas its absence is interpreted as evidence
for continental collision. The colour coded scale represents velocity perturbations in percentage. Dots represent the hypocentres of the earthquakes. The unit
of the vertical and horizontal axes is km.
at the border of the circular blocks, we have averaged the values
of overlapping blocks. While we have attempted to correct for such
amplitudeartefactsweareawareoftheinherentuncertaintyinvolved
in recovering the amplitudes of anomalies in traveltime tomography.
Therefore, we would rather put the emphasis on the restoration of
the shape of the anomalies and not on their amplitude.
The relocation of the hypocentres which is a necessary step, prior
to inversion, produced dislocation vectors comparable to those pre-
sented by Engdahl et al. (1998), even though the outliers were iden-
tified and sorted out automatically and depth estimates suffer inac-
curacies mainly related to an insufficient number of depth phases or
erroneousreportingofthem.Wehaveinvertedtheresidualsbasedon
our own relocations and those of Engdahl et al. (1998). The results
of inversion for P and show striking similarities. The reason might
lie in the fact that since the inversion is done simultaneously for ve-
locity perturbations and source parameters, the dislocation vectors
of hypocentres are of the same order of magnitude (Bijwaard et al.
1998) as the formal hypocentre errors determined by Engdahl et al.
(1998).
Series of resolution tests were presented with emphasis on the
upper mantle rather than crustal structures. This emphasis can be ex-
plained with respect to poor sampling of the crust by the teleseismic
rays. Considering the steep incidence angles it is also expected that
an overall vertical averaging of velocity perturbation is observed.
Furthermore, at larger depths of the upper mantle the increase of
non-geometrical ray effects (Wielandt 1987; Nolet 1992) has led to
C
2007 The Authors, GJI, 169, 1089–1102
Journal compilation C
2007 RAS
Downloaded
from
https://academic.oup.com/gji/article/169/3/1089/624217
by
guest
on
22
September
2023
11. Seismic tomographic imaging 1099
Figure 10. Histogram showing the distribution of the noise simulated after the ISC noise pattern that was added to synthetic arrival times. The vertical axis
represents the counts and horizontal axis the measurement error in seconds.
widening of anomalous features such as high velocity subducting
slabs. Another extreme case of ray path mislocation is at triplication
points where a slight change in the ray take off angle can mean very
different ray paths for similar traveltimes (Nolet et al. 1994). One
approach to avoid this error is to exclude the rays from epicentral
distances less than 25◦
. However, this approach was not adopted due
to the obvious disadvantage of discarding rays that give information
on shallow structures.
C O N C LU S I O N S
We have presented seismic tomograms of the crust and the upper
mantle of Iran on scales comparable with those of regional tomo-
graphic studies. Based on the concept of source–receiver reciprocity,
it was shown that in the absence of adequately spaced seismolog-
ical stations and local phase readings, it is possible to conduct a
regional and teleseismic tomography if the study area has sufficient
seismicity.
We are aware of the shortcomings of the 1-D forward solver used
in this study which might involve ray misplacement and conse-
quently mislocation of seismic anomalies especially at deeper parts
of the upper mantle. However, for resolving large anomalies such as
those targeted in this study and by holding the realistic assumption
that expected velocity perturbations are in the range of a few per-
cents of the 1-D global reference model, we could neglect non-linear
effects.
The relocated hypocentres are considered as an improvement to
the existing ISC catalogue but since in our procedure reidentification
of phases have not been made for redetermination of sources, the
location accuracy of 5–10 km claimed by Engdahl et al. (1998) that
also used more phases for relocation, might have been impaired.
The depth estimation yet suffers more from inaccuracies due to the
teleseismic nature of most relocations and inadequate depth phases.
However, the general pattern presented in this paper has shown the
general trends which can be relied on. While the earthquakes in
northern Iran appear to be shallow, the events across the Caspian
Sea and along the Zagros mountains seem to be deeper. Until better
depth estimates are achieved, it is hard to associate clusters of shal-
low earthquakes in the Zagros system with surface faulting which is
responsible for crustal thickening and shortening. Only few earth-
quakes are located in the Makran region and hence the conclusion
is made that the active subduction in the Makran region is mainly
aseismic.
The results of inversion for velocity perturbations show that
Central Iran, down to a depth of ca. 200 km, is a low velocity
seismic domain which is bounded by the high velocity Arabian and
Eurasian Plates. This is in accordance with expectations from ac-
tive orogenic belts. Our tomographic results support the idea that
the northward movement of the Arabian Plate towards Eurasia has
resulted in continental collision along the Zagros mountains but it
seems that it is does not appear to involve a simple model. Tomo-
grams also show an active subduction in the Makran region in the
southeastern corner of Iran. Features that may be interpreted as ac-
tive subduction in the Makran region are clearly imaged in both the
P-andS-wavesvelocityprofiles.Ourresultsindicatethattheconver-
gence of the Arabian Shield towards Central Iran involves subduc-
tion and continental collision, whereas we find only slight evidence
of subduction at the boundary of Central Iran with Eurasia in the
north.
To assess the reliability of our results and to show the resolution
power of the data and algorithm we conducted a series of synthetic
tests. Seismic anomalies with various shapes, polarities and loca-
tions in the crust and upper mantle were introduced in the study
volume, and synthetic arrival times were calculated for the known
source–receiver configuration. The synthetic arrival times were then
inverted to retrieve model parameters. The synthetics study also in-
cluded the addition of measurement noise and outliers into the cal-
culated arrival times before inversion. The results showed high seis-
micity of Iran provides enough ray coverage to resolve the anomalies
at upper-mantle depths. The synthetic tests have shown that where
the ray coverage is satisfactory such as where the Zagros subduction
zone lies, the model features are consistently resolvable for all rea-
sonable choices of inversion parameters. Probably, the high stability
of the algorithm is to a large extent achieved by the use of seismic
waves at all distance ranges available from local and regional to
teleseismic distances.
C
2007 The Authors, GJI, 169, 1089–1102
Journal compilation C
2007 RAS
Downloaded
from
https://academic.oup.com/gji/article/169/3/1089/624217
by
guest
on
22
September
2023
12. 1100 A. Alinaghi, I. Koulakov and H. Thybo
Figure 11. Restoration test of the power of the data and algorithm to resolve a checkerboard pattern of anomalies with cells of about 50 × 50 km2 for the
P wave and about 100 × 100 km2 for the S wave. In Iran interior the resolution decreases mainly due to lower number of earthquakes and reduced ray density
which results in additional smearing. Vertical and horizontal axis annotations are degrees of north and east geographical latitudes and longitudes, respectively.
AC K N OW L E D G M E N T S
AA, IK and HT would like to thank Walter Mooney from USGS
for his review of the first draft of the article and his constructive
suggestions. AA is obliged to express his utmost gratitude to Edi
Kissling for the fruitful discussions during his visit to ETH. Last,
but not least, AA, IK and HT thank the Carlsberg Foundation for
their generous grant and support to AA, which made this study
possible.
R E F E R E N C E S
Bassin, C., Laske, G., Masters, G., Bassin, C., Laske, G. Masters, G.,
2000. The current limits of resolution for surface wave tomography in
North America, EOS, Trans. Am. geophys. Un., 81, F897.
Berberian, M. Yeats, R.S., 1999. Patterns of historical earthquake rupture
in the Iranian plateau, Bull. seism. Soc. Am., 89, 120–139.
Bijwaard, H., Spakman, W. Engdahl, E.R., 1998. Closing the gap between
regional and global travel time tomography, J. geophys. Res., 103, 30 055–
30 078.
Dewey, J.F., Hempton, M.R., Kidd, W.S., SarogClu, F. Sengor, A.M.C.,
1986. Shortening of continental lithosphere: the neotectonics of Eastern
Anatolia a young collision zone, in Collision Tectonics, Vol. 19, pp. 3–36,
eds, Coward, M.P. Ries, A.C., Geol. Soc. Spec. Publ., London.
Dziewonski, A.M. Gilbert, F., 1976. The effect of small, aspherical per-
turbations on travel times and a re-examination pf the correction for el-
lipticity, J. R. Astr. Soc., 44, 7–17.
Engdahl, E.R., van der Hillst, R.D. Buland, R.P., 1998. Global teleseismic
earthquake relocation with improved travel times and procedures for depth
determination, Bull. seismol. Soc. Am., 88, 722–743.
International Seismological Centre, 2001. Bulletin Disks 1–9 [CD-ROM],
Internatl. Seis. Cent., Thatcham, UK.
Jackson, J. McKenzie, D., 1984. Active tectonics of the Alpine-Himalayan
belt between western Turkey and Pakistan, Geophys. J. R. astr. Soc., 77,
185–264.
C
2007 The Authors, GJI, 169, 1089–1102
Journal compilation C
2007 RAS
Downloaded
from
https://academic.oup.com/gji/article/169/3/1089/624217
by
guest
on
22
September
2023
13. Seismic tomographic imaging 1101
Figure 12. Reconstructions of realistic anomalies in the study area (left column) and the results of inversion for the P (middle column) and S (right column)
waves. Top panel shows the location of cross-sections and lower panels depict the vertical sections along the designated lines on the map. Zagors and the
subduction zone in Makran is simulated by a subducting slab of varying shape and flattening part encountering the upper-mantle transition zone. Smearing
is more pronounced in S wave anomalies mainly due to the smaller amount of S readings (only 10 per cent of total readings). However, in both P and S
reconstructions, the subducting slab and geometric shapes are well resolved. The colour coded scale represents velocity perturbations in percentage.
Jeffreys, H. Bullen, K.E., 1940. Seismological tables, Brtitish Association
for the Advancement of Sciences, London.
Kennett, B.L.N., Engdahl, E.R. Buland, R., 1995. Constraints on seis-
mic velocities in the Earth from traveltimes, Geophys. J. Int., 122, 108–
124.
Koulakov, I., 1998. Three-dimensional seismic structure of the upper mantle
beneath the central part of the Eurasian continent, Geophys. J. Int., 133,
467–489.
Koulakov, I. Sobolev, S., 2006. A tomographic model of Indian litho-
sphere break-off beneath the Pamir-Hindukush region, Geophys. J. Int.,
doi:10.1111/j.1365-246X.2005.02841.x
Koulakov, I., Tychkov, S., Bushenkova, N. Vasilevskiy, A., 2002. Struc-
ture and dynamics ovf the upper mantle beneath the Alpine-Himalayan
orogenic belt, from teleseismic tomography, Tectonophysics, 358, 77–96.
Nolet, G., 1992. Imaging the deep earth: technical possibilities and theoret-
ical limitations, in Proceedings of the 25th ESC Symposium Barcelona
C
2007 The Authors, GJI, 169, 1089–1102
Journal compilation C
2007 RAS
Downloaded
from
https://academic.oup.com/gji/article/169/3/1089/624217
by
guest
on
22
September
2023
14. 1102 A. Alinaghi, I. Koulakov and H. Thybo
1990, pp. 107–115, Rocca, A. Mayer-Rosa, D., eds, Servei Geologic de
Catalunya, Barcelona, Spain.
Nolet, G., Grand, S.P. Kennett, B.L.N., 1994. Seismic heterogeneity in the
upper mantle, J. geophys. Res., 99, 23 753–23 766.
Paige, C.C. Saunders, M.A., 1982. LSQR: An algorithm for sparse linear
equations and sparse least squares, ACM trans. Math. Soft., 8, 43–7.
Takin, M., 1972. Iranian Geology and continental Drift in the Middle East,
Nature, 235(5334), pp. 147–150.
van der Sluis, A. van der Vorst, H.A., 1987. Numerical solution
of large, sparse linear algebraic systems arising from tomographic
problems, in Seismic Tomography, pp. 49–83, ed. Nolet, G., Reidel,
Dortrech.
Waldhauser, F. Ellsworth, W.L., 2000. A double-difference Earthquake
location algorithm: method and application to the northern Hayward fault,
California, Bull. seism. Soc. Am., 90(6), 1353–1368.
Wielandt, E., 1987. On the validity of the ray approximation for interpreting
delay times, in Seismic Tomography, pp. 85–98. ed. Nolet, G., Reidel,
Dordrecht.
Zhao, D. Lei, J., 2004. Seismic ray path variations in a 3D global velocity
model, Phys. Earth planet. Inter., 141, 153–166.
C
2007 The Authors, GJI, 169, 1089–1102
Journal compilation C
2007 RAS
Downloaded
from
https://academic.oup.com/gji/article/169/3/1089/624217
by
guest
on
22
September
2023