Download to read offline
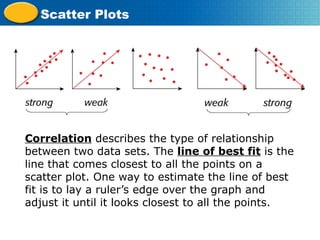
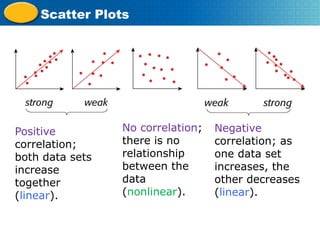

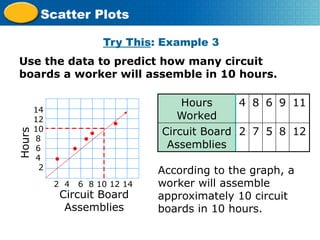

Scatter plots represent the relationship between two variables, with the independent variable on the x-axis and the dependent variable on the y-axis. They are used to analyze paired numerical data, determine relationships between variables, and can illustrate positive, negative, or no correlation. The document also provides examples of creating scatter plots and interpreting data related to height, weight, and circuit board assembly.