Download to read offline

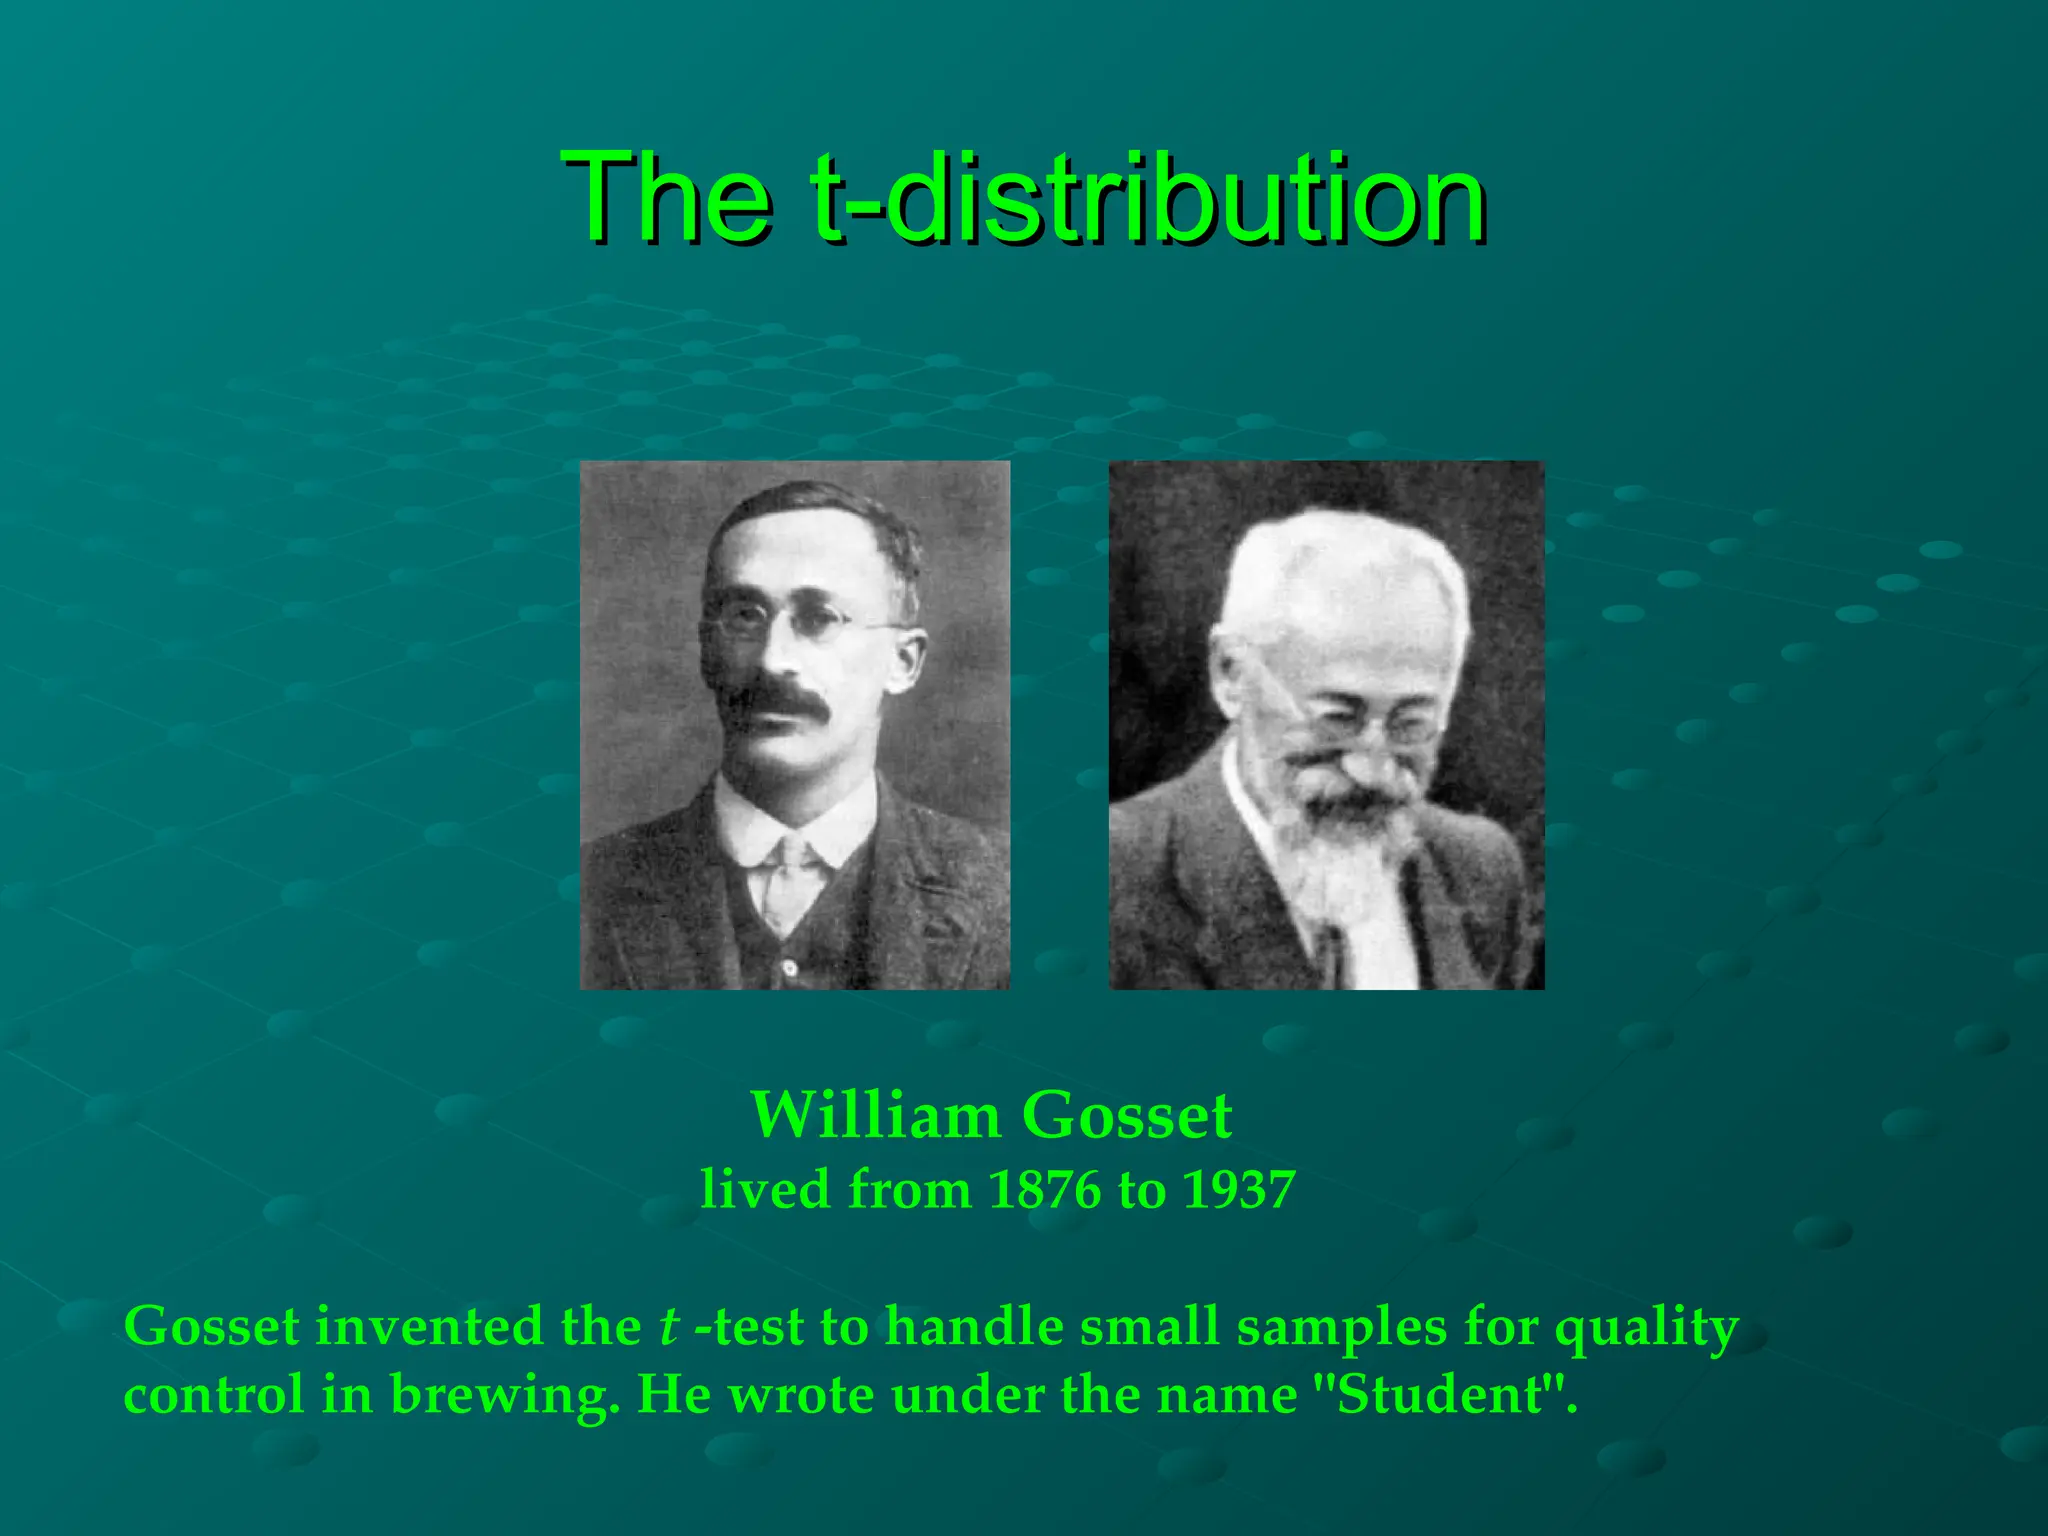
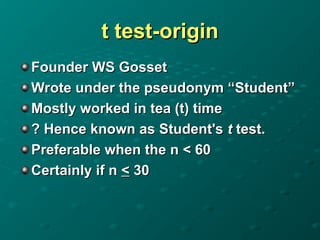
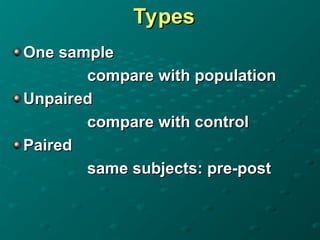
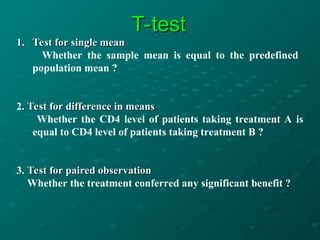
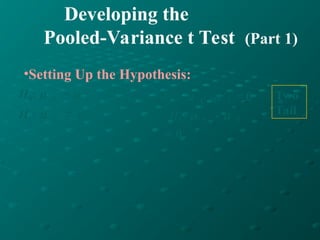
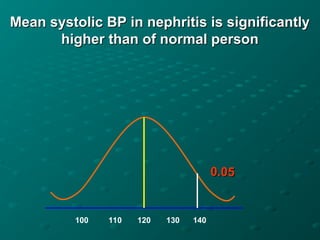
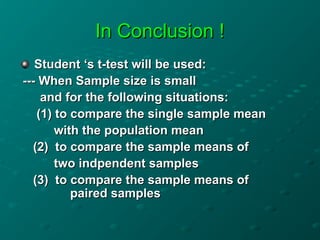

The document discusses the t-distribution and the t-test, which was invented by William Gosset, also known as 'Student', for analyzing small sample sizes particularly in quality control. It outlines different types of t-tests, including one-sample, unpaired, and paired tests, along with hypotheses setup and statistical analysis considerations like p-values and assumptions for validity. The conclusion emphasizes the appropriate scenarios for using the t-test, particularly when sample sizes are small and for comparing means.