SlideShare a Scribd company logo
© ABCi 2019
What is a Scatter Plot?
A scatter plot is a mathematical diagram that plots variables that somehow “belong” together, against
each other, (e.g. age and height of a person under 18, outdoor temperature and ice-cream sales on a
given day, etc.).
What are the benefits of using this tool?
The human eye is fantastic at detecting patterns. Scatter plots enable you to visualise if there is a
relationship between variables and if so, the type of relationship e.g. linear or non-linear. The examples
given in this guide are linear in nature.
When would you use this tool?
Scatter plots help you determine if there is a relationship between two variables by plotting them
against each other on a graph, e.g. plotting age against height of a person under 18 years or
temperature against ice-cream sales.
How do you do it?
Let’s look at a specific example to create a scatter plot.
Hunch - there is a relationship between outdoor temperature
and ice-cream sales
Step 1: Collect data for the two variables (outdoor temperature
and ice-cream sales each day, one pair of observations per day)
– see table above right.
Step 2: Using Microsoft Excel or a piece of paper construct two
axis. One variable will be plotted along the
horizontal axis (temperature) and the other variable
along the vertical axis (ice-cream sales).
What resources do I need?
• You will need multiple sets of paired observations (measurements), meaning that each dot in the
scatter plot is made up of one observation for the first variable (e.g. age or ice-cream sales) plotted
against one observation for the second variable (e.g. height or outdoor temperature) in a given
circumstance (e.g. person under 18 or on a given day).
• Microsoft Excel, or if in doubt you can use graph paper and a pencil.
Average Daily
Temperature
(C)
Daily Ice-cream
sales
(£)
14.3 £214
16.5 £326
11.8 £184
15.1 £331
18.6 £407
22.2 £523
19.5 £411
25.0 £613
23.3 £543
18.2 £422
22.6 £446
17.3 £407
Scatter PlotABC
improvement
iSkills for
© ABCi 2019
How do you interpret a Scatter Plot?
The closer the dots are to making a line, the higher the correlation between the two variables (the
stronger the relationship), this may be positive or negative. The examples below demonstrate linear
(straight line) correlation.
In our example (above) there is a strong positive
correlation between outside temperature and ice-
cream sales, as the temperature rises, so do the ice-
cream sales.
Positive correlation – data points make an upwards
facing straight line
However if there is little or no correlation
between the two variables, there will not be a
visible line and the plots will be spread out
across the whole chart area – see left.
Hints & Tips
It is important to understand that correlation does not mean causation. Just because there is a
correlation between two variables, it does not mean that one variable has directly caused or affected
the other.
In our example (above) there is a strong negative
correlation between waiting time in clinic and
patient satisfaction score, as the waiting time
increases, the satisfaction score decreases.
Negative correlation – data points make a
downwards facing straight line
Hunch - there is a relationship between outdoor
temperature and ice-cream sales
Step 3: Plot each dot on your scatter plot by placing
the dot where the two variables meet. The first row
in the table has been plotted – see scatter plot right.
Step 4: Interpret the correlation of the two variables
by looking at the pattern of the dots on the graph.

More Related Content

What's hot

Uses of graph
Uses of graphUses of graph
Uses of graph
NimraKhan91
 
Presenting statistics in social media
Presenting statistics in social mediaPresenting statistics in social media
Presenting statistics in social media
University of Pittsburgh
 
TID Chapter 5 Introduction To Charts And Graph
TID Chapter 5 Introduction To Charts And GraphTID Chapter 5 Introduction To Charts And Graph
TID Chapter 5 Introduction To Charts And GraphWanBK Leo
 
Types Of Charts
Types Of ChartsTypes Of Charts
Types Of Chartswmassie
 
Intro to Graphing Data Powerpoint-7th and 8th Grade
Intro to Graphing Data Powerpoint-7th and 8th GradeIntro to Graphing Data Powerpoint-7th and 8th Grade
Intro to Graphing Data Powerpoint-7th and 8th Grade
Baily OrBust
 
3 data analysis bar graphs may 27
3 data analysis   bar graphs may 273 data analysis   bar graphs may 27
3 data analysis bar graphs may 27mskarras
 
From data to diagrams: an introduction to basic graphs and charts
From data to diagrams: an introduction to basic graphs and chartsFrom data to diagrams: an introduction to basic graphs and charts
From data to diagrams: an introduction to basic graphs and charts
School of Data
 
Aggregate supply textbook challenge
Aggregate supply textbook challengeAggregate supply textbook challenge
Aggregate supply textbook challenge
Aquinas College Economics Department
 
Presenting statistics in social media 2012
Presenting statistics in social media 2012Presenting statistics in social media 2012
Presenting statistics in social media 2012University of Pittsburgh
 
Algebra 2 warm up 5.4.14
Algebra 2 warm up  5.4.14Algebra 2 warm up  5.4.14
Algebra 2 warm up 5.4.14Ron Eick
 
Data visualization 101_how_to_design_charts_and_graphs
Data visualization 101_how_to_design_charts_and_graphsData visualization 101_how_to_design_charts_and_graphs
Data visualization 101_how_to_design_charts_and_graphsAtner Yegorov
 
Data Visualisation using SSRS: Euclid's Royal Road to the numbers
Data Visualisation using SSRS: Euclid's Royal Road to the numbersData Visualisation using SSRS: Euclid's Royal Road to the numbers
Data Visualisation using SSRS: Euclid's Royal Road to the numbers
Jen Stirrup
 
Different types of graphs
Different types of graphsDifferent types of graphs
Different types of graphs
OUR LADY OF ROSES MONTESORRI SCHOOL
 
ABCi Charts - Runcharts Tool user guide
ABCi Charts - Runcharts Tool user guide ABCi Charts - Runcharts Tool user guide
ABCi Charts - Runcharts Tool user guide
ABCiABUHB
 

What's hot (18)

Uses of graph
Uses of graphUses of graph
Uses of graph
 
Presenting statistics in social media
Presenting statistics in social mediaPresenting statistics in social media
Presenting statistics in social media
 
TID Chapter 5 Introduction To Charts And Graph
TID Chapter 5 Introduction To Charts And GraphTID Chapter 5 Introduction To Charts And Graph
TID Chapter 5 Introduction To Charts And Graph
 
Types Of Charts
Types Of ChartsTypes Of Charts
Types Of Charts
 
Intro to Graphing Data Powerpoint-7th and 8th Grade
Intro to Graphing Data Powerpoint-7th and 8th GradeIntro to Graphing Data Powerpoint-7th and 8th Grade
Intro to Graphing Data Powerpoint-7th and 8th Grade
 
3 data analysis bar graphs may 27
3 data analysis   bar graphs may 273 data analysis   bar graphs may 27
3 data analysis bar graphs may 27
 
From data to diagrams: an introduction to basic graphs and charts
From data to diagrams: an introduction to basic graphs and chartsFrom data to diagrams: an introduction to basic graphs and charts
From data to diagrams: an introduction to basic graphs and charts
 
TYPES ON CHARTS
TYPES ON CHARTS TYPES ON CHARTS
TYPES ON CHARTS
 
Aggregate supply textbook challenge
Aggregate supply textbook challengeAggregate supply textbook challenge
Aggregate supply textbook challenge
 
Presenting statistics in social media 2012
Presenting statistics in social media 2012Presenting statistics in social media 2012
Presenting statistics in social media 2012
 
Algebra 2 warm up 5.4.14
Algebra 2 warm up  5.4.14Algebra 2 warm up  5.4.14
Algebra 2 warm up 5.4.14
 
Data visualization 101_how_to_design_charts_and_graphs
Data visualization 101_how_to_design_charts_and_graphsData visualization 101_how_to_design_charts_and_graphs
Data visualization 101_how_to_design_charts_and_graphs
 
Graphs in science
Graphs in scienceGraphs in science
Graphs in science
 
Data Visualisation using SSRS: Euclid's Royal Road to the numbers
Data Visualisation using SSRS: Euclid's Royal Road to the numbersData Visualisation using SSRS: Euclid's Royal Road to the numbers
Data Visualisation using SSRS: Euclid's Royal Road to the numbers
 
1.4 notes
1.4 notes1.4 notes
1.4 notes
 
Presenting scientific data graphing
Presenting scientific data graphingPresenting scientific data graphing
Presenting scientific data graphing
 
Different types of graphs
Different types of graphsDifferent types of graphs
Different types of graphs
 
ABCi Charts - Runcharts Tool user guide
ABCi Charts - Runcharts Tool user guide ABCi Charts - Runcharts Tool user guide
ABCi Charts - Runcharts Tool user guide
 

Similar to 14 s4 i scatter plot final

Frequency Tables - Statistics
Frequency Tables - StatisticsFrequency Tables - Statistics
Frequency Tables - Statisticsmscartersmaths
 
Understanding on graph in bpo
Understanding on graph in bpoUnderstanding on graph in bpo
Understanding on graph in bpo
Ajit Kumar
 
Macromolecules
MacromoleculesMacromolecules
Macromoleculesganctil
 
Devry bis 155 i lab 8
Devry bis 155 i lab 8Devry bis 155 i lab 8
Devry bis 155 i lab 8
uopassignment
 
Introduction to Data Visualization
Introduction to Data VisualizationIntroduction to Data Visualization
Introduction to Data Visualization
Stephen Tracy
 
Dervy bis-155-i lab-8-week-7-descriptive-statistics-formatting--graphs-and-re...
Dervy bis-155-i lab-8-week-7-descriptive-statistics-formatting--graphs-and-re...Dervy bis-155-i lab-8-week-7-descriptive-statistics-formatting--graphs-and-re...
Dervy bis-155-i lab-8-week-7-descriptive-statistics-formatting--graphs-and-re...
individual484
 
Building A Mathematical Model
Building A Mathematical ModelBuilding A Mathematical Model
Building A Mathematical ModelTom Loughran
 
Assesment in education
Assesment in educationAssesment in education
Assesment in education
annathomas123
 
Vsual analysis.pptx
Vsual analysis.pptxVsual analysis.pptx
Vsual analysis.pptx
DPBarboa
 
Chapter 4 Problem 31. For problem three in chapter four, a teac.docx
Chapter 4 Problem 31. For problem three in chapter four,   a teac.docxChapter 4 Problem 31. For problem three in chapter four,   a teac.docx
Chapter 4 Problem 31. For problem three in chapter four, a teac.docx
robertad6
 
Stem and-leaf-diagram-ppt.-dfs
Stem and-leaf-diagram-ppt.-dfsStem and-leaf-diagram-ppt.-dfs
Stem and-leaf-diagram-ppt.-dfs
Farhana Shaheen
 
NCV 4 Mathematical Literacy Hands-On Support Slide Show - Module 2 Part 3
NCV 4 Mathematical Literacy Hands-On Support Slide Show - Module 2 Part 3NCV 4 Mathematical Literacy Hands-On Support Slide Show - Module 2 Part 3
NCV 4 Mathematical Literacy Hands-On Support Slide Show - Module 2 Part 3
Future Managers
 
Week 1 lecture b how do economists work
Week 1 lecture b how do economists workWeek 1 lecture b how do economists work
Week 1 lecture b how do economists work
luantso
 
Correlation and regression
Correlation and regressionCorrelation and regression
Correlation and regressionKhalid Aziz
 
Bigdata
BigdataBigdata
co relation and regression
co relation and regressionco relation and regression
co relation and regression
Rehan ali
 
Presentation of Data - How to Construct Graphs
Presentation of Data - How to Construct GraphsPresentation of Data - How to Construct Graphs
Presentation of Data - How to Construct Graphs
sheisirenebkm
 
Inquiry unit for science
Inquiry unit for scienceInquiry unit for science
Inquiry unit for science
ChaseWarner95
 
Displaying and describing categorical data
Displaying and describing categorical dataDisplaying and describing categorical data
Displaying and describing categorical data
Olivia Dombrowski
 

Similar to 14 s4 i scatter plot final (20)

Frequency Tables - Statistics
Frequency Tables - StatisticsFrequency Tables - Statistics
Frequency Tables - Statistics
 
Line graphs
Line graphsLine graphs
Line graphs
 
Understanding on graph in bpo
Understanding on graph in bpoUnderstanding on graph in bpo
Understanding on graph in bpo
 
Macromolecules
MacromoleculesMacromolecules
Macromolecules
 
Devry bis 155 i lab 8
Devry bis 155 i lab 8Devry bis 155 i lab 8
Devry bis 155 i lab 8
 
Introduction to Data Visualization
Introduction to Data VisualizationIntroduction to Data Visualization
Introduction to Data Visualization
 
Dervy bis-155-i lab-8-week-7-descriptive-statistics-formatting--graphs-and-re...
Dervy bis-155-i lab-8-week-7-descriptive-statistics-formatting--graphs-and-re...Dervy bis-155-i lab-8-week-7-descriptive-statistics-formatting--graphs-and-re...
Dervy bis-155-i lab-8-week-7-descriptive-statistics-formatting--graphs-and-re...
 
Building A Mathematical Model
Building A Mathematical ModelBuilding A Mathematical Model
Building A Mathematical Model
 
Assesment in education
Assesment in educationAssesment in education
Assesment in education
 
Vsual analysis.pptx
Vsual analysis.pptxVsual analysis.pptx
Vsual analysis.pptx
 
Chapter 4 Problem 31. For problem three in chapter four, a teac.docx
Chapter 4 Problem 31. For problem three in chapter four,   a teac.docxChapter 4 Problem 31. For problem three in chapter four,   a teac.docx
Chapter 4 Problem 31. For problem three in chapter four, a teac.docx
 
Stem and-leaf-diagram-ppt.-dfs
Stem and-leaf-diagram-ppt.-dfsStem and-leaf-diagram-ppt.-dfs
Stem and-leaf-diagram-ppt.-dfs
 
NCV 4 Mathematical Literacy Hands-On Support Slide Show - Module 2 Part 3
NCV 4 Mathematical Literacy Hands-On Support Slide Show - Module 2 Part 3NCV 4 Mathematical Literacy Hands-On Support Slide Show - Module 2 Part 3
NCV 4 Mathematical Literacy Hands-On Support Slide Show - Module 2 Part 3
 
Week 1 lecture b how do economists work
Week 1 lecture b how do economists workWeek 1 lecture b how do economists work
Week 1 lecture b how do economists work
 
Correlation and regression
Correlation and regressionCorrelation and regression
Correlation and regression
 
Bigdata
BigdataBigdata
Bigdata
 
co relation and regression
co relation and regressionco relation and regression
co relation and regression
 
Presentation of Data - How to Construct Graphs
Presentation of Data - How to Construct GraphsPresentation of Data - How to Construct Graphs
Presentation of Data - How to Construct Graphs
 
Inquiry unit for science
Inquiry unit for scienceInquiry unit for science
Inquiry unit for science
 
Displaying and describing categorical data
Displaying and describing categorical dataDisplaying and describing categorical data
Displaying and describing categorical data
 

More from ABCiABUHB

ABCi Working Styles workbook
ABCi Working Styles workbookABCi Working Styles workbook
ABCi Working Styles workbook
ABCiABUHB
 
Pareto guide final
Pareto guide finalPareto guide final
Pareto guide final
ABCiABUHB
 
24 s4 i affinity diagram final
24 s4 i affinity diagram final24 s4 i affinity diagram final
24 s4 i affinity diagram final
ABCiABUHB
 
23 s4 i nominal group technique final
23 s4 i nominal group technique final23 s4 i nominal group technique final
23 s4 i nominal group technique final
ABCiABUHB
 
22 s4 i brainstorming final
22 s4 i brainstorming final22 s4 i brainstorming final
22 s4 i brainstorming final
ABCiABUHB
 
10 s4 i spaghetti diagram final
10 s4 i spaghetti diagram final10 s4 i spaghetti diagram final
10 s4 i spaghetti diagram final
ABCiABUHB
 
7 s4 i model for improvement final
7 s4 i model for improvement final7 s4 i model for improvement final
7 s4 i model for improvement final
ABCiABUHB
 
5 s4 i ease benefit matrix final
5 s4 i ease benefit matrix final5 s4 i ease benefit matrix final
5 s4 i ease benefit matrix final
ABCiABUHB
 
2 s4 i driver diagram final
2 s4 i driver diagram final2 s4 i driver diagram final
2 s4 i driver diagram final
ABCiABUHB
 
1c s4 i using runcharts final
1c s4 i using runcharts final1c s4 i using runcharts final
1c s4 i using runcharts final
ABCiABUHB
 
1b s4 i interpreting runcharts final
1b s4 i interpreting runcharts final  1b s4 i interpreting runcharts final
1b s4 i interpreting runcharts final
ABCiABUHB
 
1a s4 i creating runcharts final
1a s4 i creating runcharts final1a s4 i creating runcharts final
1a s4 i creating runcharts final
ABCiABUHB
 
Fishbone template
Fishbone templateFishbone template
Fishbone template
ABCiABUHB
 
ABCi Skills for Improvement- Fishbone Diagram
ABCi Skills for Improvement- Fishbone DiagramABCi Skills for Improvement- Fishbone Diagram
ABCi Skills for Improvement- Fishbone Diagram
ABCiABUHB
 
ABCi Skills for Improvement- Pareto Chart
ABCi Skills for Improvement- Pareto ChartABCi Skills for Improvement- Pareto Chart
ABCi Skills for Improvement- Pareto Chart
ABCiABUHB
 
2019 11-18 -- abci training prospectusv7 (1)
2019 11-18 -- abci training prospectusv7 (1)2019 11-18 -- abci training prospectusv7 (1)
2019 11-18 -- abci training prospectusv7 (1)
ABCiABUHB
 

More from ABCiABUHB (16)

ABCi Working Styles workbook
ABCi Working Styles workbookABCi Working Styles workbook
ABCi Working Styles workbook
 
Pareto guide final
Pareto guide finalPareto guide final
Pareto guide final
 
24 s4 i affinity diagram final
24 s4 i affinity diagram final24 s4 i affinity diagram final
24 s4 i affinity diagram final
 
23 s4 i nominal group technique final
23 s4 i nominal group technique final23 s4 i nominal group technique final
23 s4 i nominal group technique final
 
22 s4 i brainstorming final
22 s4 i brainstorming final22 s4 i brainstorming final
22 s4 i brainstorming final
 
10 s4 i spaghetti diagram final
10 s4 i spaghetti diagram final10 s4 i spaghetti diagram final
10 s4 i spaghetti diagram final
 
7 s4 i model for improvement final
7 s4 i model for improvement final7 s4 i model for improvement final
7 s4 i model for improvement final
 
5 s4 i ease benefit matrix final
5 s4 i ease benefit matrix final5 s4 i ease benefit matrix final
5 s4 i ease benefit matrix final
 
2 s4 i driver diagram final
2 s4 i driver diagram final2 s4 i driver diagram final
2 s4 i driver diagram final
 
1c s4 i using runcharts final
1c s4 i using runcharts final1c s4 i using runcharts final
1c s4 i using runcharts final
 
1b s4 i interpreting runcharts final
1b s4 i interpreting runcharts final  1b s4 i interpreting runcharts final
1b s4 i interpreting runcharts final
 
1a s4 i creating runcharts final
1a s4 i creating runcharts final1a s4 i creating runcharts final
1a s4 i creating runcharts final
 
Fishbone template
Fishbone templateFishbone template
Fishbone template
 
ABCi Skills for Improvement- Fishbone Diagram
ABCi Skills for Improvement- Fishbone DiagramABCi Skills for Improvement- Fishbone Diagram
ABCi Skills for Improvement- Fishbone Diagram
 
ABCi Skills for Improvement- Pareto Chart
ABCi Skills for Improvement- Pareto ChartABCi Skills for Improvement- Pareto Chart
ABCi Skills for Improvement- Pareto Chart
 
2019 11-18 -- abci training prospectusv7 (1)
2019 11-18 -- abci training prospectusv7 (1)2019 11-18 -- abci training prospectusv7 (1)
2019 11-18 -- abci training prospectusv7 (1)
 

Recently uploaded

Navigating Challenges: Mental Health, Legislation, and the Prison System in B...
Navigating Challenges: Mental Health, Legislation, and the Prison System in B...Navigating Challenges: Mental Health, Legislation, and the Prison System in B...
Navigating Challenges: Mental Health, Legislation, and the Prison System in B...
Guillermo Rivera
 
VERIFICATION AND VALIDATION TOOLKIT Determining Performance Characteristics o...
VERIFICATION AND VALIDATION TOOLKIT Determining Performance Characteristics o...VERIFICATION AND VALIDATION TOOLKIT Determining Performance Characteristics o...
VERIFICATION AND VALIDATION TOOLKIT Determining Performance Characteristics o...
Nguyễn Thị Vân Anh
 
Roti bank chennai PPT [Autosaved].pptx1
Roti bank  chennai PPT [Autosaved].pptx1Roti bank  chennai PPT [Autosaved].pptx1
Roti bank chennai PPT [Autosaved].pptx1
roti bank
 
BOWEL ELIMINATION BY ANUSHRI SRIVASTAVA.pptx
BOWEL ELIMINATION BY ANUSHRI SRIVASTAVA.pptxBOWEL ELIMINATION BY ANUSHRI SRIVASTAVA.pptx
BOWEL ELIMINATION BY ANUSHRI SRIVASTAVA.pptx
AnushriSrivastav
 
Demystifying-Gene-Editing-The-Promise-and-Peril-of-CRISPR.pdf
Demystifying-Gene-Editing-The-Promise-and-Peril-of-CRISPR.pdfDemystifying-Gene-Editing-The-Promise-and-Peril-of-CRISPR.pdf
Demystifying-Gene-Editing-The-Promise-and-Peril-of-CRISPR.pdf
SasikiranMarri
 
Navigating the Health Insurance Market_ Understanding Trends and Options.pdf
Navigating the Health Insurance Market_ Understanding Trends and Options.pdfNavigating the Health Insurance Market_ Understanding Trends and Options.pdf
Navigating the Health Insurance Market_ Understanding Trends and Options.pdf
Enterprise Wired
 
Dehradun ❤CALL Girls 8901183002 ❤ℂall Girls IN Dehradun ESCORT SERVICE❤
Dehradun ❤CALL Girls  8901183002 ❤ℂall  Girls IN Dehradun ESCORT SERVICE❤Dehradun ❤CALL Girls  8901183002 ❤ℂall  Girls IN Dehradun ESCORT SERVICE❤
Dehradun ❤CALL Girls 8901183002 ❤ℂall Girls IN Dehradun ESCORT SERVICE❤
aunty1x2
 
Haridwar ❤CALL Girls 🔝 89011★83002 🔝 ❤ℂall Girls IN Haridwar ESCORT SERVICE❤
Haridwar ❤CALL Girls 🔝 89011★83002 🔝 ❤ℂall Girls IN Haridwar ESCORT SERVICE❤Haridwar ❤CALL Girls 🔝 89011★83002 🔝 ❤ℂall Girls IN Haridwar ESCORT SERVICE❤
Haridwar ❤CALL Girls 🔝 89011★83002 🔝 ❤ℂall Girls IN Haridwar ESCORT SERVICE❤
ranishasharma67
 
A Community health , health for prisoners
A Community health  , health for prisonersA Community health  , health for prisoners
A Community health , health for prisoners
Ahmed Elmi
 
VVIP Dehradun Girls 9719300533 Heat-bake { Dehradun } Genteel ℂall Serviℂe By...
VVIP Dehradun Girls 9719300533 Heat-bake { Dehradun } Genteel ℂall Serviℂe By...VVIP Dehradun Girls 9719300533 Heat-bake { Dehradun } Genteel ℂall Serviℂe By...
VVIP Dehradun Girls 9719300533 Heat-bake { Dehradun } Genteel ℂall Serviℂe By...
rajkumar669520
 
The Docs PPG - 30.05.2024.pptx..........
The Docs PPG - 30.05.2024.pptx..........The Docs PPG - 30.05.2024.pptx..........
The Docs PPG - 30.05.2024.pptx..........
TheDocs
 
Immunity to Veterinary parasitic infections power point presentation
Immunity to Veterinary parasitic infections power point presentationImmunity to Veterinary parasitic infections power point presentation
Immunity to Veterinary parasitic infections power point presentation
BeshedaWedajo
 
CHAPTER 1 SEMESTER V - ROLE OF PEADIATRIC NURSE.pdf
CHAPTER 1 SEMESTER V - ROLE OF PEADIATRIC NURSE.pdfCHAPTER 1 SEMESTER V - ROLE OF PEADIATRIC NURSE.pdf
CHAPTER 1 SEMESTER V - ROLE OF PEADIATRIC NURSE.pdf
Sachin Sharma
 
the IUA Administrative Board and General Assembly meeting
the IUA Administrative Board and General Assembly meetingthe IUA Administrative Board and General Assembly meeting
the IUA Administrative Board and General Assembly meeting
ssuser787e5c1
 
POLYCYSTIC OVARIAN SYNDROME (PCOS)......
POLYCYSTIC OVARIAN SYNDROME (PCOS)......POLYCYSTIC OVARIAN SYNDROME (PCOS)......
POLYCYSTIC OVARIAN SYNDROME (PCOS)......
Ameena Kadar
 
How many patients does case series should have In comparison to case reports.pdf
How many patients does case series should have In comparison to case reports.pdfHow many patients does case series should have In comparison to case reports.pdf
How many patients does case series should have In comparison to case reports.pdf
pubrica101
 
HEAT WAVE presented by priya bhojwani..pptx
HEAT WAVE presented by priya bhojwani..pptxHEAT WAVE presented by priya bhojwani..pptx
HEAT WAVE presented by priya bhojwani..pptx
priyabhojwani1200
 
Performance Standards for Antimicrobial Susceptibility Testing
Performance Standards for Antimicrobial Susceptibility TestingPerformance Standards for Antimicrobial Susceptibility Testing
Performance Standards for Antimicrobial Susceptibility Testing
Nguyễn Thị Vân Anh
 
Overcome Your Phobias with Hypnotherapy.pptx
Overcome Your Phobias with Hypnotherapy.pptxOvercome Your Phobias with Hypnotherapy.pptx
Overcome Your Phobias with Hypnotherapy.pptx
renewlifehypnosis
 
Introduction to Forensic Pathology course
Introduction to Forensic Pathology courseIntroduction to Forensic Pathology course
Introduction to Forensic Pathology course
fprxsqvnz5
 

Recently uploaded (20)

Navigating Challenges: Mental Health, Legislation, and the Prison System in B...
Navigating Challenges: Mental Health, Legislation, and the Prison System in B...Navigating Challenges: Mental Health, Legislation, and the Prison System in B...
Navigating Challenges: Mental Health, Legislation, and the Prison System in B...
 
VERIFICATION AND VALIDATION TOOLKIT Determining Performance Characteristics o...
VERIFICATION AND VALIDATION TOOLKIT Determining Performance Characteristics o...VERIFICATION AND VALIDATION TOOLKIT Determining Performance Characteristics o...
VERIFICATION AND VALIDATION TOOLKIT Determining Performance Characteristics o...
 
Roti bank chennai PPT [Autosaved].pptx1
Roti bank  chennai PPT [Autosaved].pptx1Roti bank  chennai PPT [Autosaved].pptx1
Roti bank chennai PPT [Autosaved].pptx1
 
BOWEL ELIMINATION BY ANUSHRI SRIVASTAVA.pptx
BOWEL ELIMINATION BY ANUSHRI SRIVASTAVA.pptxBOWEL ELIMINATION BY ANUSHRI SRIVASTAVA.pptx
BOWEL ELIMINATION BY ANUSHRI SRIVASTAVA.pptx
 
Demystifying-Gene-Editing-The-Promise-and-Peril-of-CRISPR.pdf
Demystifying-Gene-Editing-The-Promise-and-Peril-of-CRISPR.pdfDemystifying-Gene-Editing-The-Promise-and-Peril-of-CRISPR.pdf
Demystifying-Gene-Editing-The-Promise-and-Peril-of-CRISPR.pdf
 
Navigating the Health Insurance Market_ Understanding Trends and Options.pdf
Navigating the Health Insurance Market_ Understanding Trends and Options.pdfNavigating the Health Insurance Market_ Understanding Trends and Options.pdf
Navigating the Health Insurance Market_ Understanding Trends and Options.pdf
 
Dehradun ❤CALL Girls 8901183002 ❤ℂall Girls IN Dehradun ESCORT SERVICE❤
Dehradun ❤CALL Girls  8901183002 ❤ℂall  Girls IN Dehradun ESCORT SERVICE❤Dehradun ❤CALL Girls  8901183002 ❤ℂall  Girls IN Dehradun ESCORT SERVICE❤
Dehradun ❤CALL Girls 8901183002 ❤ℂall Girls IN Dehradun ESCORT SERVICE❤
 
Haridwar ❤CALL Girls 🔝 89011★83002 🔝 ❤ℂall Girls IN Haridwar ESCORT SERVICE❤
Haridwar ❤CALL Girls 🔝 89011★83002 🔝 ❤ℂall Girls IN Haridwar ESCORT SERVICE❤Haridwar ❤CALL Girls 🔝 89011★83002 🔝 ❤ℂall Girls IN Haridwar ESCORT SERVICE❤
Haridwar ❤CALL Girls 🔝 89011★83002 🔝 ❤ℂall Girls IN Haridwar ESCORT SERVICE❤
 
A Community health , health for prisoners
A Community health  , health for prisonersA Community health  , health for prisoners
A Community health , health for prisoners
 
VVIP Dehradun Girls 9719300533 Heat-bake { Dehradun } Genteel ℂall Serviℂe By...
VVIP Dehradun Girls 9719300533 Heat-bake { Dehradun } Genteel ℂall Serviℂe By...VVIP Dehradun Girls 9719300533 Heat-bake { Dehradun } Genteel ℂall Serviℂe By...
VVIP Dehradun Girls 9719300533 Heat-bake { Dehradun } Genteel ℂall Serviℂe By...
 
The Docs PPG - 30.05.2024.pptx..........
The Docs PPG - 30.05.2024.pptx..........The Docs PPG - 30.05.2024.pptx..........
The Docs PPG - 30.05.2024.pptx..........
 
Immunity to Veterinary parasitic infections power point presentation
Immunity to Veterinary parasitic infections power point presentationImmunity to Veterinary parasitic infections power point presentation
Immunity to Veterinary parasitic infections power point presentation
 
CHAPTER 1 SEMESTER V - ROLE OF PEADIATRIC NURSE.pdf
CHAPTER 1 SEMESTER V - ROLE OF PEADIATRIC NURSE.pdfCHAPTER 1 SEMESTER V - ROLE OF PEADIATRIC NURSE.pdf
CHAPTER 1 SEMESTER V - ROLE OF PEADIATRIC NURSE.pdf
 
the IUA Administrative Board and General Assembly meeting
the IUA Administrative Board and General Assembly meetingthe IUA Administrative Board and General Assembly meeting
the IUA Administrative Board and General Assembly meeting
 
POLYCYSTIC OVARIAN SYNDROME (PCOS)......
POLYCYSTIC OVARIAN SYNDROME (PCOS)......POLYCYSTIC OVARIAN SYNDROME (PCOS)......
POLYCYSTIC OVARIAN SYNDROME (PCOS)......
 
How many patients does case series should have In comparison to case reports.pdf
How many patients does case series should have In comparison to case reports.pdfHow many patients does case series should have In comparison to case reports.pdf
How many patients does case series should have In comparison to case reports.pdf
 
HEAT WAVE presented by priya bhojwani..pptx
HEAT WAVE presented by priya bhojwani..pptxHEAT WAVE presented by priya bhojwani..pptx
HEAT WAVE presented by priya bhojwani..pptx
 
Performance Standards for Antimicrobial Susceptibility Testing
Performance Standards for Antimicrobial Susceptibility TestingPerformance Standards for Antimicrobial Susceptibility Testing
Performance Standards for Antimicrobial Susceptibility Testing
 
Overcome Your Phobias with Hypnotherapy.pptx
Overcome Your Phobias with Hypnotherapy.pptxOvercome Your Phobias with Hypnotherapy.pptx
Overcome Your Phobias with Hypnotherapy.pptx
 
Introduction to Forensic Pathology course
Introduction to Forensic Pathology courseIntroduction to Forensic Pathology course
Introduction to Forensic Pathology course
 

14 s4 i scatter plot final

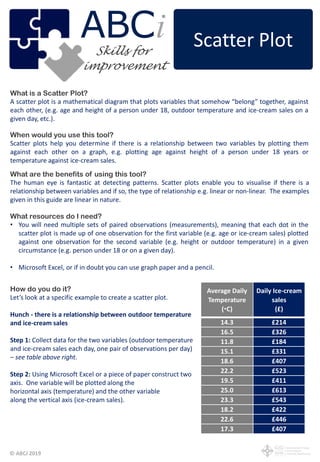
  • 1. © ABCi 2019 What is a Scatter Plot? A scatter plot is a mathematical diagram that plots variables that somehow “belong” together, against each other, (e.g. age and height of a person under 18, outdoor temperature and ice-cream sales on a given day, etc.). What are the benefits of using this tool? The human eye is fantastic at detecting patterns. Scatter plots enable you to visualise if there is a relationship between variables and if so, the type of relationship e.g. linear or non-linear. The examples given in this guide are linear in nature. When would you use this tool? Scatter plots help you determine if there is a relationship between two variables by plotting them against each other on a graph, e.g. plotting age against height of a person under 18 years or temperature against ice-cream sales. How do you do it? Let’s look at a specific example to create a scatter plot. Hunch - there is a relationship between outdoor temperature and ice-cream sales Step 1: Collect data for the two variables (outdoor temperature and ice-cream sales each day, one pair of observations per day) – see table above right. Step 2: Using Microsoft Excel or a piece of paper construct two axis. One variable will be plotted along the horizontal axis (temperature) and the other variable along the vertical axis (ice-cream sales). What resources do I need? • You will need multiple sets of paired observations (measurements), meaning that each dot in the scatter plot is made up of one observation for the first variable (e.g. age or ice-cream sales) plotted against one observation for the second variable (e.g. height or outdoor temperature) in a given circumstance (e.g. person under 18 or on a given day). • Microsoft Excel, or if in doubt you can use graph paper and a pencil. Average Daily Temperature (C) Daily Ice-cream sales (£) 14.3 £214 16.5 £326 11.8 £184 15.1 £331 18.6 £407 22.2 £523 19.5 £411 25.0 £613 23.3 £543 18.2 £422 22.6 £446 17.3 £407 Scatter PlotABC improvement iSkills for
  • 2. © ABCi 2019 How do you interpret a Scatter Plot? The closer the dots are to making a line, the higher the correlation between the two variables (the stronger the relationship), this may be positive or negative. The examples below demonstrate linear (straight line) correlation. In our example (above) there is a strong positive correlation between outside temperature and ice- cream sales, as the temperature rises, so do the ice- cream sales. Positive correlation – data points make an upwards facing straight line However if there is little or no correlation between the two variables, there will not be a visible line and the plots will be spread out across the whole chart area – see left. Hints & Tips It is important to understand that correlation does not mean causation. Just because there is a correlation between two variables, it does not mean that one variable has directly caused or affected the other. In our example (above) there is a strong negative correlation between waiting time in clinic and patient satisfaction score, as the waiting time increases, the satisfaction score decreases. Negative correlation – data points make a downwards facing straight line Hunch - there is a relationship between outdoor temperature and ice-cream sales Step 3: Plot each dot on your scatter plot by placing the dot where the two variables meet. The first row in the table has been plotted – see scatter plot right. Step 4: Interpret the correlation of the two variables by looking at the pattern of the dots on the graph.