Download as PDF, PPTX
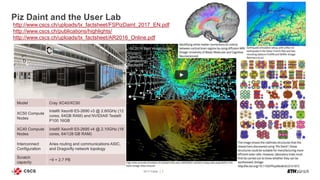
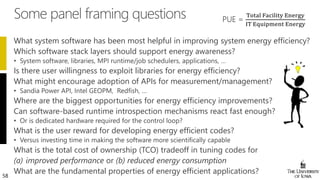
![National Petascale Computing Facility
• Only Facility in the world of this
scale on an Academic Campus
• Capable of sustained 24 MW today
• Expandable in space, power and
cooling [50,000 ft2 (4,645+ m2) machine
room gallery and sustained 100 MW]
• Modern Data Center
• 90,000+ ft2 (8,360+ m2) total
• 30,000 ft2 (2,790+ m2) raised floor
20,000 ft2 (1,860+ m2) machine room gallery
• Energy Efficiency
• LEED certified Gold
• Power Utilization Efficiency, PUE = 1.1–1.2](https://image.slidesharecdn.com/softwareandenergyefficiencysc17panel-171125172923/85/SC17-Panel-Energy-Efficiency-Gains-From-HPC-Software-17-320.jpg)
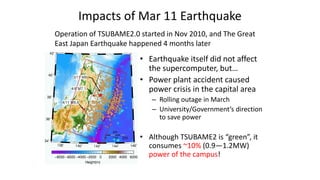
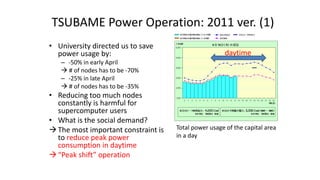
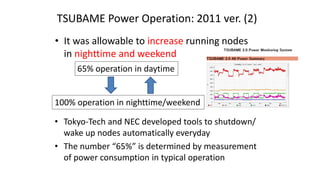
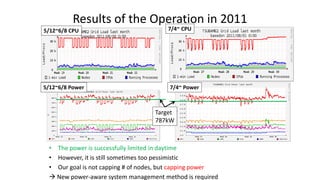

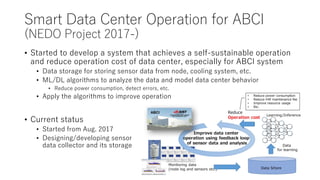

The document discusses energy efficiency improvements in high-performance computing (HPC) systems, focusing on strategies, software impacts, and user behavior regarding energy usage. Key topics include the effects of system cooling, the importance of performance modeling, and the need for incentives for users to adopt energy-efficient practices. Additionally, it outlines specific case studies, including the Tsubame supercomputer's operations, to illustrate real-world applications of these principles.


![[Webinar Presentation] Best Practices for IT/OT Convergence](https://cdn.slidesharecdn.com/ss_thumbnails/schneideritotwebinarpresentationmaterials-130919084013-phpapp01-thumbnail.jpg?width=640&height=640&fit=bounds)


