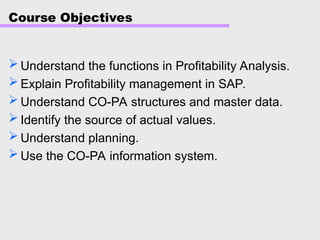
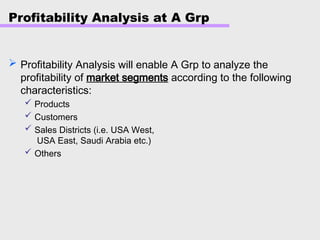
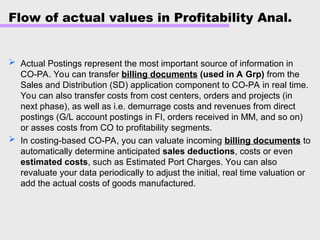
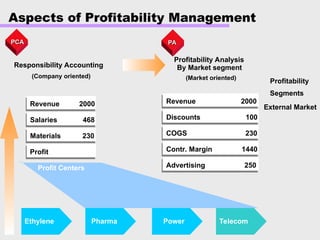
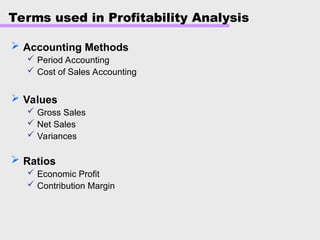
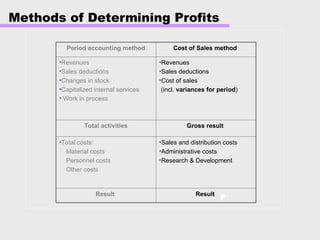
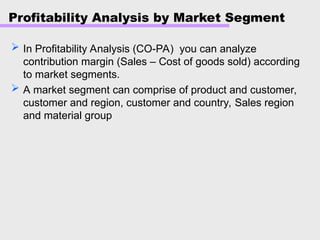
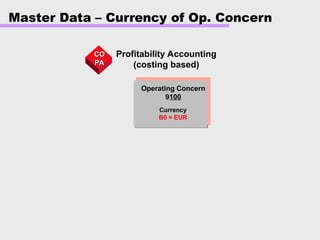
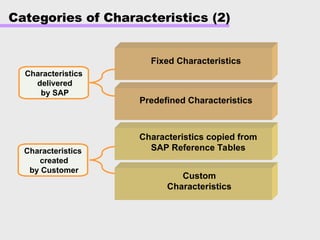
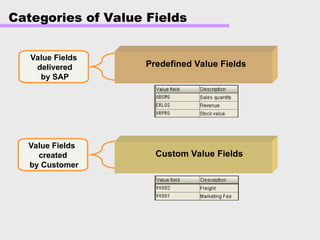
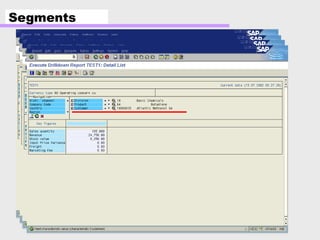
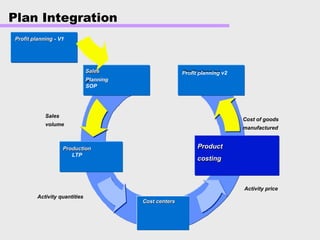
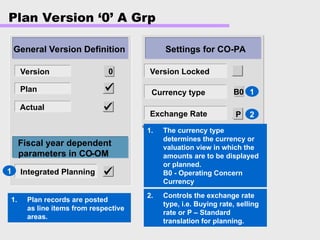
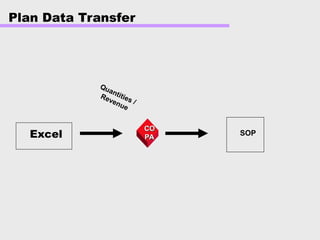
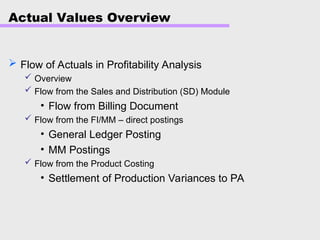
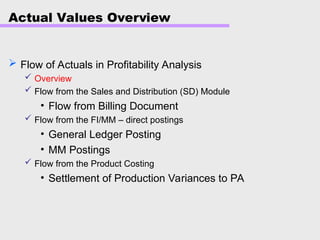
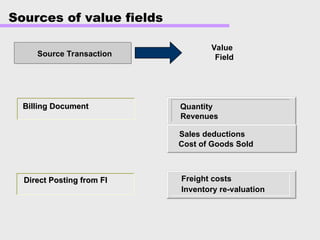
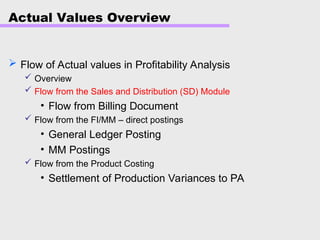
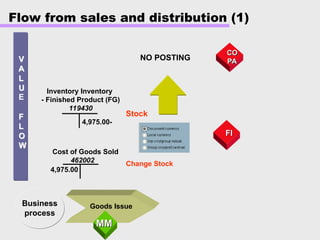
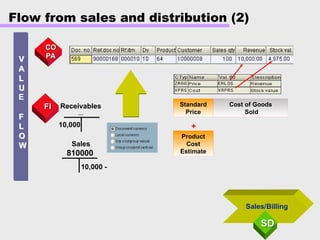
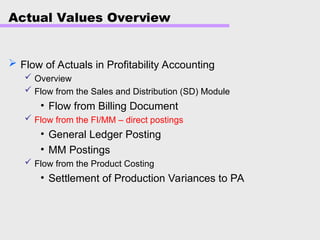
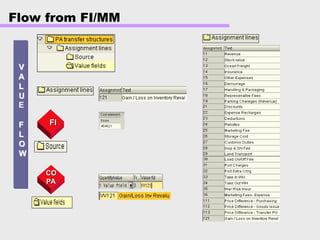
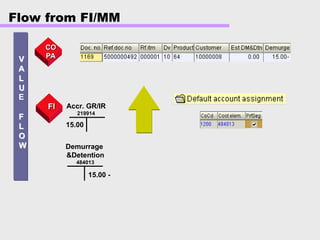
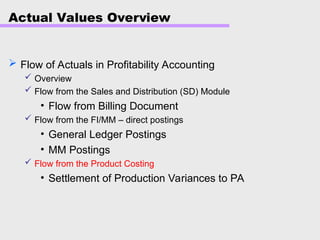
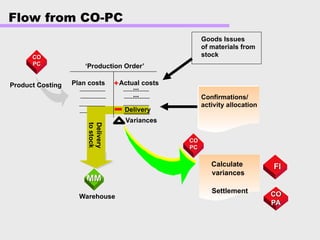
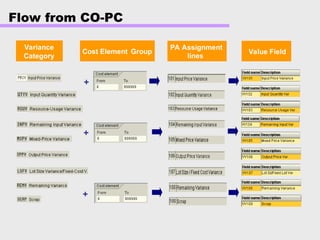
Profitability Analysis
CO-PA
Course Objectives
 Understand the functions in Profitability Analysis.
 Explain Profitability management in SAP.
 Understand CO-PA structures and master data.
 Identify the source of actual values.
 Understand planning.
 Use the CO-PA information system.
Overview
Profitability Management
Table of contents
Actual data flow
Master Data
Planning
Information System
Profitability Analysis at A Grp
 Profitability Analysis will enable A Grp to analyze the
profitability of market segments according to the following
characteristics:
 Products
 Customers
 Sales Districts (i.e. USA West,
USA East, Saudi Arabia etc.)
 Others
Flow of actual values in Profitability Anal.
 Actual Postings represent the most important source of information in
CO-PA. You can transfer billing documents (used in A Grp) from the
Sales and Distribution (SD) application component to CO-PA in real time.
You can also transfer costs from cost centers, orders and projects (in
next phase), as well as i.e. demurrage costs and revenues from direct
postings (G/L account postings in FI, orders received in MM, and so on)
or asses costs from CO to profitability segments.
 In costing-based CO-PA, you can valuate incoming billing documents to
automatically determine anticipated sales deductions, costs or even
estimated costs, such as Estimated Port Charges. You can also
revaluate your data periodically to adjust the initial, real time valuation or
add the actual costs of goods manufactured.
Profitability Management
Aspects of Profitability Management
Revenue 2000
Discounts 100
COGS 230
Contr. Margin 1440
Revenue 2000
Salaries 468
Materials 230
Profit
Telecom
Pharma
Ethylene Power
Advertising 250
Profitability Analysis
By Market segment
(Market oriented)
Responsibility Accounting
(Company oriented)
Profit Centers
PCA PA
Segments
External Market
Profitability
Terms used in Profitability Analysis
 Accounting Methods
 Period Accounting
 Cost of Sales Accounting
 Values
 Gross Sales
 Net Sales
 Variances
 Ratios
 Economic Profit
 Contribution Margin
Methods of Determining Profits
Period accounting method Cost of Sales method
•Revenues
•Sales deductions
•Changes in stock
•Capitalized internal services
• Work in process
•Revenues
•Sales deductions
•Cost of sales
(incl. variances for period)
Total activities Gross result
•Total costs:
Material costs
Personnel costs
Other costs
•Sales and distribution costs
•Administrative costs
•Research & Development
Result Result
Aspects of Profitability Management
 Profitability Analysis (CO-PA) calculates profits according to
cost-of-sales method of accounting.
 Profit Center Accounting (EC-PCA), on the other hand,
supports both period accounting and cost-of-sales
approach.
 Both of these methods are used at the same time in your
organization.
Profitability Analysis by Market Segment
 In Profitability Analysis (CO-PA) you can analyze
contribution margin (Sales – Cost of goods sold) according
to market segments.
 A market segment can comprise of product and customer,
customer and region, customer and country, Sales region
and material group
Master Data in CO PA
Master Data – Currency of Op. Concern
Profitability Accounting
(costing based)
CO
CO
PA
PA
Operating Concern
9100
Currency
B0 = EUR
Master Data in Profitability Analysis
Cost Element
Cost
Element
Accounting
Profitability
Segment
Profitability
Analysis
Characteristics
Value Fields
Product (SBU)
Ethylene Glycol
Sales
District
SE
Asia
Custo
mer
INDO
RAMA
SYNTH
ETIS
Profitability Segments
Master Data in Profitability Analysis
Profitability Segment - object within Profitability Analysis to which
costs and revenues are assigned. A profitability segment
corresponds to a market segment.
You can calculate the profitability of a profitability
segment by setting off its sales revenues against its costs. A
profitability segment in an operating concern is defined by a
combination of characteristic values. Characteristics can be
concepts that already exist in the R/3 System (customer, product,
sales organization, and so on).
Categories of Characteristics (1)
Characteristics
delivered
by SAP
Fixed Characteristics
Predefined Characteristics
• Characteristics are valid in all clients
• Characteristics are available for all Operating Concerns
Categories of Characteristics (2)
Characteristics
delivered
by SAP
Characteristics
created
by Customer
Fixed Characteristics
Predefined Characteristics
Characteristics copied from
SAP Reference Tables
Custom
Characteristics
Categories of Value Fields
Value Fields
delivered
by SAP
Value Fields
created
by Customer
Predefined Value Fields
Custom Value Fields
Segments
Planning
CO-PA Planning Objectives
 Plan Integration
 Plan Versions
 Creation of a sales plan using planning level and planning
packages
 Plan Data Transfer
CO-PA Planning Objectives
 Plan Integration
 Plan Versions
 Creation of a sales plan using planning level and planning
packages
 Plan Data Transfer
Plan Integration
Production
Production
LTP
Profit planning
Profit planning v2
Product
Product
costing
costing
Cost of goods
manufactured
Activity price
Sales
volume
Activity quantities
Sales
Sales
planning
Planning
SOP
Cost centers
Cost centers
Profit planning
Profit planning - V1
CO-PA Planning Objectives
 Plan Integration
 Plan Versions
 Creation of a sales plan using planning level and planning
packages
 Plan Data Transfer
Settings for CO-PA
General Version Definition
Version
Plan
Actual
0
0 Version Locked
Currency type
Exchange Rate
Fiscal year dependent
parameters in CO-OM
Integrated Planning
M
P
Plan Version ‘0’ A Grp
1. Plan records are posted
as line items from respective
areas.
1
1. The currency type
determines the currency or
valuation view in which the
amounts are to be displayed
or planned.
B0 - Operating Concern
Currency
2
2. Controls the exchange rate
type, i.e. Buying rate, selling
rate or P – Standard
translation for planning.
1
P
B0
CO-PA Planning Objectives
 Plan Integration
 Plan Versions
 Creation of a sales plan using planning level and planning
packages
 Plan Data Transfer
Overview of Planning Framework
 Maintain Planning Level-Package-Set-Personalization
 Copy Sales Plan
 Upload of COPA Plan - Offline Planning
 Manual Profit Planning
 Valuation Planning Method
 Event Planning Method
 Period Distribution Planning Method
 Ratio Planning Method
 Planning Forecast
 Revaluation Planning Method
CO-PA Planning Objectives
 Plan Integration
 Creation of a sales plan using planning level and planning
packages
 Plan Data Transfer
Plan Data Transfer
CO
CO
PA
PA
SOP
Quantities /
Revenue
Excel
Actual data flow
Actual Values Overview
 Flow of Actuals in Profitability Analysis
 Overview
 Flow from the Sales and Distribution (SD) Module
• Flow from Billing Document
 Flow from the FI/MM – direct postings
• General Ledger Posting
• MM Postings
 Flow from the Product Costing
• Settlement of Production Variances to PA
Quantity
Revenues
Sales deductions
Cost of Goods Sold
Freight costs
Inventory re-valuation
Direct Posting from
Direct Posting from FI
FI
Source Transaction
Value
Field
Billing Document
Billing Document
Sources of value fields
Actual Values Overview
 Flow of Actual values in Profitability Analysis
 Overview
 Flow from the Sales and Distribution (SD) Module
• Flow from Billing Document
 Flow from the FI/MM – direct postings
• General Ledger Posting
• MM Postings
 Flow from the Product Costing
• Settlement of Production Variances to PA
Business
process
V
V
A
A
L
L
U
U
F
F
L
L
O
O
W
W
4,975.00-
Cost of Goods Sold
462002
Inventory Inventory
- Finished Product (FG)
119430
4,975.00
Goods Issue
MM
MM
Flow from sales and distribution (1)
E
Stock
Change Stock
CO
CO
PA
PA
FI
FI
NO POSTING
Flow from sales and distribution (2)
V
V
A
A
L
L
U
U
F
F
L
L
O
O
W
W
Sales/Billing
SD
SD
Receivables
…
10,000
Sales
810000
10,000 -
E
CO
CO
PA
PA
FI
FI Cost of Goods
Sold
Standard
Price
Product
Cost
Estimate
+
Actual Values Overview
 Flow of Actuals in Profitability Accounting
 Overview
 Flow from the Sales and Distribution (SD) Module
• Flow from Billing Document
 Flow from the FI/MM – direct postings
• General Ledger Posting
• MM Postings
 Flow from the Product Costing
• Settlement of Production Variances to PA
Flow from FI/MM
V
V
A
A
L
L
U
U
F
F
L
L
O
O
W
W
E
CO
CO
PA
PA
FI
FI
Flow from FI/MM
V
V
A
A
L
L
U
U
F
F
L
L
O
O
W
W
Accr. GR/IR
219914
15.00
Demurrage
&Detention
484013
15.00 -
E
CO
CO
PA
PA
FI
FI
Actual Values Overview
 Flow of Actuals in Profitability Accounting
 Overview
 Flow from the Sales and Distribution (SD) Module
• Flow from Billing Document
 Flow from the FI/MM – direct postings
• General Ledger Postings
• MM Postings
 Flow from the Product Costing
• Settlement of Production Variances to PA
Flow from CO-PC
Delivery
Goods Issues
of materials from
stock
Confirmations/
activity allocation
Delivery
to
stock
Warehouse
‘Production Order’
Plan costs Actual costs
Product Costing
Calculate
variances
CO
CO
PC
PC
CO
CO
PC
PC
MM
MM
...
...
Variances
FI
FI
CO
CO
PA
PA
+
Settlement
Flow from CO-PC
Variance
Category
PA Assignment
lines
Value Field
Cost Element Group
+
+
+
Information System
Report Output
Drilldown List
Detail List
SAP Profitability Analysis with Details1

SAP Profitability Analysis with Details1

  • 1.
  • 2.
    Course Objectives  Understandthe functions in Profitability Analysis.  Explain Profitability management in SAP.  Understand CO-PA structures and master data.  Identify the source of actual values.  Understand planning.  Use the CO-PA information system.
  • 3.
    Overview Profitability Management Table ofcontents Actual data flow Master Data Planning Information System
  • 4.
    Profitability Analysis atA Grp  Profitability Analysis will enable A Grp to analyze the profitability of market segments according to the following characteristics:  Products  Customers  Sales Districts (i.e. USA West, USA East, Saudi Arabia etc.)  Others
  • 5.
    Flow of actualvalues in Profitability Anal.  Actual Postings represent the most important source of information in CO-PA. You can transfer billing documents (used in A Grp) from the Sales and Distribution (SD) application component to CO-PA in real time. You can also transfer costs from cost centers, orders and projects (in next phase), as well as i.e. demurrage costs and revenues from direct postings (G/L account postings in FI, orders received in MM, and so on) or asses costs from CO to profitability segments.  In costing-based CO-PA, you can valuate incoming billing documents to automatically determine anticipated sales deductions, costs or even estimated costs, such as Estimated Port Charges. You can also revaluate your data periodically to adjust the initial, real time valuation or add the actual costs of goods manufactured.
  • 6.
  • 7.
    Aspects of ProfitabilityManagement Revenue 2000 Discounts 100 COGS 230 Contr. Margin 1440 Revenue 2000 Salaries 468 Materials 230 Profit Telecom Pharma Ethylene Power Advertising 250 Profitability Analysis By Market segment (Market oriented) Responsibility Accounting (Company oriented) Profit Centers PCA PA Segments External Market Profitability
  • 8.
    Terms used inProfitability Analysis  Accounting Methods  Period Accounting  Cost of Sales Accounting  Values  Gross Sales  Net Sales  Variances  Ratios  Economic Profit  Contribution Margin
  • 9.
    Methods of DeterminingProfits Period accounting method Cost of Sales method •Revenues •Sales deductions •Changes in stock •Capitalized internal services • Work in process •Revenues •Sales deductions •Cost of sales (incl. variances for period) Total activities Gross result •Total costs: Material costs Personnel costs Other costs •Sales and distribution costs •Administrative costs •Research & Development Result Result
  • 10.
    Aspects of ProfitabilityManagement  Profitability Analysis (CO-PA) calculates profits according to cost-of-sales method of accounting.  Profit Center Accounting (EC-PCA), on the other hand, supports both period accounting and cost-of-sales approach.  Both of these methods are used at the same time in your organization.
  • 11.
    Profitability Analysis byMarket Segment  In Profitability Analysis (CO-PA) you can analyze contribution margin (Sales – Cost of goods sold) according to market segments.  A market segment can comprise of product and customer, customer and region, customer and country, Sales region and material group
  • 12.
  • 13.
    Master Data –Currency of Op. Concern Profitability Accounting (costing based) CO CO PA PA Operating Concern 9100 Currency B0 = EUR
  • 14.
    Master Data inProfitability Analysis Cost Element Cost Element Accounting Profitability Segment Profitability Analysis Characteristics Value Fields
  • 15.
  • 16.
    Master Data inProfitability Analysis Profitability Segment - object within Profitability Analysis to which costs and revenues are assigned. A profitability segment corresponds to a market segment. You can calculate the profitability of a profitability segment by setting off its sales revenues against its costs. A profitability segment in an operating concern is defined by a combination of characteristic values. Characteristics can be concepts that already exist in the R/3 System (customer, product, sales organization, and so on).
  • 17.
    Categories of Characteristics(1) Characteristics delivered by SAP Fixed Characteristics Predefined Characteristics • Characteristics are valid in all clients • Characteristics are available for all Operating Concerns
  • 18.
    Categories of Characteristics(2) Characteristics delivered by SAP Characteristics created by Customer Fixed Characteristics Predefined Characteristics Characteristics copied from SAP Reference Tables Custom Characteristics
  • 19.
    Categories of ValueFields Value Fields delivered by SAP Value Fields created by Customer Predefined Value Fields Custom Value Fields
  • 20.
  • 21.
  • 22.
    CO-PA Planning Objectives Plan Integration  Plan Versions  Creation of a sales plan using planning level and planning packages  Plan Data Transfer
  • 23.
    CO-PA Planning Objectives Plan Integration  Plan Versions  Creation of a sales plan using planning level and planning packages  Plan Data Transfer
  • 24.
    Plan Integration Production Production LTP Profit planning Profitplanning v2 Product Product costing costing Cost of goods manufactured Activity price Sales volume Activity quantities Sales Sales planning Planning SOP Cost centers Cost centers Profit planning Profit planning - V1
  • 25.
    CO-PA Planning Objectives Plan Integration  Plan Versions  Creation of a sales plan using planning level and planning packages  Plan Data Transfer
  • 26.
    Settings for CO-PA GeneralVersion Definition Version Plan Actual 0 0 Version Locked Currency type Exchange Rate Fiscal year dependent parameters in CO-OM Integrated Planning M P Plan Version ‘0’ A Grp 1. Plan records are posted as line items from respective areas. 1 1. The currency type determines the currency or valuation view in which the amounts are to be displayed or planned. B0 - Operating Concern Currency 2 2. Controls the exchange rate type, i.e. Buying rate, selling rate or P – Standard translation for planning. 1 P B0
  • 27.
    CO-PA Planning Objectives Plan Integration  Plan Versions  Creation of a sales plan using planning level and planning packages  Plan Data Transfer
  • 28.
  • 29.
    Overview of PlanningFramework  Maintain Planning Level-Package-Set-Personalization  Copy Sales Plan  Upload of COPA Plan - Offline Planning  Manual Profit Planning  Valuation Planning Method  Event Planning Method  Period Distribution Planning Method  Ratio Planning Method  Planning Forecast  Revaluation Planning Method
  • 30.
    CO-PA Planning Objectives Plan Integration  Creation of a sales plan using planning level and planning packages  Plan Data Transfer
  • 31.
  • 32.
  • 33.
    Actual Values Overview Flow of Actuals in Profitability Analysis  Overview  Flow from the Sales and Distribution (SD) Module • Flow from Billing Document  Flow from the FI/MM – direct postings • General Ledger Posting • MM Postings  Flow from the Product Costing • Settlement of Production Variances to PA
  • 34.
    Actual Values Overview Flow of Actuals in Profitability Analysis  Overview  Flow from the Sales and Distribution (SD) Module • Flow from Billing Document  Flow from the FI/MM – direct postings • General Ledger Posting • MM Postings  Flow from the Product Costing • Settlement of Production Variances to PA
  • 35.
    Quantity Revenues Sales deductions Cost ofGoods Sold Freight costs Inventory re-valuation Direct Posting from Direct Posting from FI FI Source Transaction Value Field Billing Document Billing Document Sources of value fields
  • 36.
    Actual Values Overview Flow of Actual values in Profitability Analysis  Overview  Flow from the Sales and Distribution (SD) Module • Flow from Billing Document  Flow from the FI/MM – direct postings • General Ledger Posting • MM Postings  Flow from the Product Costing • Settlement of Production Variances to PA
  • 37.
    Business process V V A A L L U U F F L L O O W W 4,975.00- Cost of GoodsSold 462002 Inventory Inventory - Finished Product (FG) 119430 4,975.00 Goods Issue MM MM Flow from sales and distribution (1) E Stock Change Stock CO CO PA PA FI FI NO POSTING
  • 38.
    Flow from salesand distribution (2) V V A A L L U U F F L L O O W W Sales/Billing SD SD Receivables … 10,000 Sales 810000 10,000 - E CO CO PA PA FI FI Cost of Goods Sold Standard Price Product Cost Estimate +
  • 39.
    Actual Values Overview Flow of Actuals in Profitability Accounting  Overview  Flow from the Sales and Distribution (SD) Module • Flow from Billing Document  Flow from the FI/MM – direct postings • General Ledger Posting • MM Postings  Flow from the Product Costing • Settlement of Production Variances to PA
  • 40.
  • 41.
    Flow from FI/MM V V A A L L U U F F L L O O W W Accr.GR/IR 219914 15.00 Demurrage &Detention 484013 15.00 - E CO CO PA PA FI FI
  • 42.
    Actual Values Overview Flow of Actuals in Profitability Accounting  Overview  Flow from the Sales and Distribution (SD) Module • Flow from Billing Document  Flow from the FI/MM – direct postings • General Ledger Postings • MM Postings  Flow from the Product Costing • Settlement of Production Variances to PA
  • 43.
    Flow from CO-PC Delivery GoodsIssues of materials from stock Confirmations/ activity allocation Delivery to stock Warehouse ‘Production Order’ Plan costs Actual costs Product Costing Calculate variances CO CO PC PC CO CO PC PC MM MM ... ... Variances FI FI CO CO PA PA + Settlement
  • 44.
    Flow from CO-PC Variance Category PAAssignment lines Value Field Cost Element Group + + +
  • 45.
  • 46.

Editor's Notes

  • #4 Profitability Analysis (CO-PA) enables A Grp to evaluate market segments, which can be classified according to product, customers, sales districts or any combination of these, or strategic business units, Business segment, Business field with respect to your company's profit or contribution margin (gross margin). It represents market-oriented approach. The aim of the system is to provide your sales, marketing, product management and corporate planning departments with information to support internal accounting and decision-making.
  • #7 Profitability Reporting:   Profitability Analysis (CO-PA) lets you analyze the profitability of segments of your external market. These segments can be defined according to products, customers, countries, and numerous other characteristics, as well as your internal organizational units such as company codes (i.e. 9100) or distribution channels (I.e. direct, wholesale, e-Commerce). The aim is to provide your executive management, sales, marketing, planning, and other groups in your organization with decision-support from a market-oriented viewpoint. Responsibility Reporting:   EC-PCA lets you analyze internal profit and loss for profit centers. This makes it possible for you to evaluate different areas or units within your company. You can structure profit centers according to region (branch offices, plants), function (production, sales), or product (product groups, as in A Grp). Profit Center Accounting is a component of the "Enterprise Controlling" module.
  • #8 The period accounting approach distinguishes between individual cost and revenue elements (such as material costs). The total costs for the period are compared with the total operating output for the period. The output of products manufactured within the period but not yet sold (stock increases), are added to the sales revenues, and the costs of the products produced in past periods but sold in this period (stock decreases), are taken away. Together with additional capitalized internal activities and other revenues, this yields the total operating output for the period. In the cost-of-sales accounting approach there is no differentiation according to cost elements. Here the sales revenues are compared with the manufacturing costs for the products sold (cost of sale). The manufacturing costs may include material and personnel costs, which were incurred in previous periods. Costs which cannot be directly assigned to the sale, such as sales and administration costs, are displayed separately. The cost-of-sales procedure therefore also indicates whereabouts in the company costs were incurred.
  • #9 Profitability controlling in the R/3 System is subdivided according to various aspects: Scope of business activities encompassed (Cost-of-sales accounting or period accounting) Representation of profits (account-based or costing-based) Valuation base of costs (actual, standard) Scope of costs (partial/full costs) Profitability Analysis (CO-PA) calculates profits according to cost-of-sales method of accounting.
  • #13 Operating concern currency - in costing-based Profitability Analysis, actual data is always updated in the operating concern currency. Even if all amounts are stored only in the operating concern currency, it is possible to report using other currencies. However, reporting translation is only possible using period-average translation rates.
  • #14 The structure of an operating concern is determined by the: characteristics (profitability segments) value fields such as revenues, rebates, etc. (costing-based Profitability Analysis) cost and revenue elements – you have to create revenue cost elements under category ’11 – Revenues’ and ’12 - Sales deduction’ to allow the update of the SD conditions in costing-based CO-PA.
  • #15 Profitability segment is a reflection of a market segment.
  • #16 Characteristics Question: "What do I want to report on?" Examples: Affiliates, Region, Products, Customers Characteristic Values Question: "What values can I have for these characteristics?" Examples: Region South; Region North Profitability Segments Question: "What is the technical definition of my sales channel?" Example: combination of Country Japan, Region Tokyo, Product Ehtylene Glycol. Value Fields Question: "What performance measures do I want to track and analyze?" Examples: Gross Sales, Surcharges, Discounts, Cost-of-Sales
  • #17 Characteristics are the criteria in Profitability Analysis (CO-PA) according to which you can analyze your operating result and perform differentiated sales and profit planning and reporting. A combination of values for the characteristics in an operating concern is called a Profitability Segment, i.e. values for characteristic Division are as follow: Basic Chemicals, Polyolefins, PVC/Polyester, Intermediates, Fertilizers, Metals, Intercompany Div. Some of the standard (fixed) characteristics, also in A Grp are: Billing type, Business area, Company code, Controlling area, Cost object, Customer, Distribution channel, Division, Order, Partner profit center, Plant, Product, Profit center, Record type, Sales order, Sales order item, Sales organization, Version, WBS element. It is possible to view the information in PA by any combination of characteristics maintained in transaction KEQ3, i.e. we can view any segment that is defined by a combination of characteristic values.
  • #18 Several essential and obvious characteristics (like "sales organization"," customer", "product", etc.) are pre-defined automatically for every operating concern; these are known as fixed characteristics. In addition to the fixed characteristics, up to 50 non-fixed characteristics can be added to an operating concern. Often, only 10 to 20 of these are required to meet most companies' reporting needs. Specific characteristics for A Grp: Copied characteristics: Sales group, Bill to party, product hierarchy User-defined characteristics Business Segment Business field It is possible to view the information in PA by any combination of these characteristics, i.e. we can view any segment that is defined by a combination of characteristic values.
  • #19 In costing-based Profitability Analysis, value fields store the base quantities and amounts for reporting. Value fields can either be highly summarized (representing a summary of cost element balances, for example) or highly detailed (representing just one part of a single cost element balance). Generally, value fields are highly detailed with regards to sales performance figures (like types of revenues, discounts, surcharges, etc.), and more summarized for other items relating to period costs (like types of period expenses). New operating concerns generally have 20 to 60 value fields. Unlike characteristics, there are no fixed value fields for a new operating concern.   It is not necessary to create value fields for calculated items, such as net sales, contribution margin, etc. These items are normally calculated from the base values stored in the value fields during the report execution progress (to minimize necessary data storage requirements).
  • #20 Example of analysis of profitability segments according to A Grp’s characteristics: Division = Basic Chemicals Customer = Atlantic Methanol Product = Butadiene
  • #24 A grp plans at material level in Excel spreadsheets and then upload planning data into the SAP. In bottom-up planning, plan data can be entered manually for each sales representative and then brought together in a single plan version. Once planning has been finalized, the plan data can then be transferred over to production planning, thereby allowing production plan data to be reconciled with sales planning.
  • #26 Plan version (CO-PA) The version enables you to keep two or more sets of data for the same object. You can maintain and evaluate several plan versions at the same time. You may wish to have different versions of plan data based, for example, on the type of assumption for the forecast (optimistic, pessimistic), when the plan was created (original plan, updated forecast), how binding the plan is.
  • #28 Taking into account a typical sales and profit planning process, a professional planning tool has to:   Support the individual planning tasks by guiding the user to those planning levels he/she needs to plan. For example, a key account manager needs to plan on the key customer, sales organization and product level.   Support the individual planners by providing personalized access to the desired plan data, using planning packages   Provide a set of relevant planning functions (methods), such as valuations and simulations (forecast, revaluations, etc.) in order to apply the desired planning packages by using planning methods and parameters. It is possible to plan on many different levels in CO-PA during a planning process. For example, it's possible to plan on the product group level, or the product level, or the customer/product level, or maybe just the customer level. In fact, it is possible to plan on any profitability segment in CO-PA. By design, the system ensures that the data remains consistent across all levels throughout the planning process, meaning that subtotals will always roll up to totals. Derivation occurs automatically behind the scenes when planning data is saved. Since this is true, values planned under one or more characteristic values might automatically be summarized under other characteristics as well.
  • #31 Integrated Planning in controlling, where planning is conducted separately for multiple business activities, but the different plans are linked to ensure consistency and to drive realistic corporate-wide planning. Thus, the separate planning results for sales, service, production, procurement, general, and administration activities coincide to form one corporate operational plan. It is possible to transfer sales plan information back and forth between costing-based Profitability Analysis (CO-PA) and Sales and Operations Planning (SOP). This allows for synchronizing planned sales quantities between these areas. This flow of planning data is but one example of many possible planning strategies that can be used in R/3. In A Grp integrated planning between CO-PA and PCA is not used but both modules are fed with data from Sales and Profit Plan prepared in Excel spreadsheet.
  • #35 Using direct postings in FI you can post actual sales reductions, such as annual volume-based rebates, or actual costs, such as freight costs (estimated when the period was closed in order to allow short-term analysis) to the corresponding profitability segments. This supplements the estimated costs with the actual costs.
  • #37 The goods issue is triggered by a delivery in SD. This affects the values in Materials Management and Financial Accounting. Balance sheet and stock change postings are made in FI when the goods issue is posted according to a price in material master. Note that the goods issue posting does not cause any data to be posted in costing-based CO-PA. The cost of goods sold is only transferred to costing-based CO-PA when the billing document is transferred.
  • #38 The following data is transferred from bills and debit and credit memos to CO-PA. Revenues Sales deductions (shipping, discounts, and so on) Accruals (e.g. from rebate agreements – at first posted in FI) The cost of goods sold is only transferred to costing-based CO-PA when the billing document is transferred according to a price in material master and a material cost estimate valid on the date of a delivery. This enhancement helps to reconcile COGS posted in FI in a moment of a delivery with COGS posted in CO-PA during billing. It is extremely important while there is a huge time gap between a delivery and a billing.
  • #40 Using direct postings in FI you can post actual sales reductions, such as annual volume-based rebates, or actual costs, such as demurrage costs (estimated when the period was closed in order to allow short-term analysis) to the corresponding profitability segments. This supplements the estimated costs with the actual costs. This type of posting will not take place often but can be used to post any type of automatic transaction to CO-PA. Examples include Inventory Revaluations, I.e. manual with transaction MR21 or with Post Closing step during Material Ledger period-end closing while system uses the periodic unit price that was calculated by the last price determination for the material to revaluate the material stock of the previous period. The data is posted to a profitability segment found on the basis of the information found in the FI document. If the information there is not very detailed (not many characteristic values), the data is posted to a higher aggregation level.
  • #41 You assign the values to a profitability segment directly in the FI posting transaction. There you can call up a special assignment dialog box for each posting line by clicking the Prof. segment field. In this dialog box the system displays the characteristics that you can choose from the operating concern you are working in. You can predefine what is displayed on this screen by defining a “characteristic group” for the activity RFBU in Customizing. The characteristic group defines which characteristics are displayed for selection. System can determine a profitability segment by means of substitution for automatic postings (transaction OKB9). The corresponding posting is then passed on to Profitability Analysis (CO-PA). Typical business transactions for which a profitability segment is found automatically include: price differences that are posted in purchasing due to differing order prices or differing prices in invoice receipt (as period costs) revaluation of material stocks (as period costs) - expenses or revenues. inventory differences (as period costs)
  • #43 After finishing the production process (CO production orders), or at the end of the period (product cost collectors), the production order variances will be settled to a price difference account and to CO-PA.
  • #44 You can settle (transfer) the production variances calculated in Product Cost Controlling for product cost collectors (settled periodically) and CO production orders to CO-PA. The individual variance categories (such as material price variance, material quantity variance, etc.) are transferred separately. The PA transfer structure ‘Z9’ consists of items called assignment lines. In these assignment lines you assign a cost element group and a variance category to a value field of the operating concern. To assure correct settlement to Profitability Analysis, you must assign each combination of the cost element group and the variance category to one value field in the operating concern. Note the following when you use a PA transfer structure: Every debit cost element must be in the PA transfer structure. You can either group all cost elements into a cost element group or define a number of groups for materials, internal activities, business processes, other overhead costs, etc. These groups are entered under the section “cost elements”. Every variance category must be represented in the PA transfer structure. The variance categories are specified by the system and are entered under the “source” section. Each debit cost element or combination of cost element group and variance category can only be assigned to one value field (n:1 relation). The PA transfer structure ‘Z9’ is assigned to the settlement profile ‘PP01’ which is defaulted for order types: RM01 - PCC for Repetitive Manufacturing, RM02 - PCC for Process Orders and CP01 - Standard CO production order.
  • #46 If you want to execute a report with the output type 'graphical report output', the system displays the same data as with the old list. However, GUI elements are used, which are embedded in a splitter control. This means that the screen is made up of a number of areas, which the user can freely define. In addition to the more attractive display, a further advantage of this display type is that various functions can be called up using drag and drop. This makes it possible to change the order of columns by marking a column and dragging it to a different position on the screen. It also allows navigation functions, such as drilldown or drilldown switch.