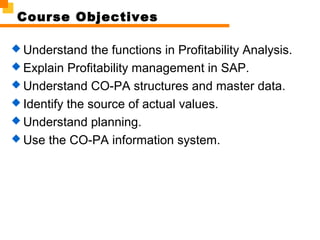
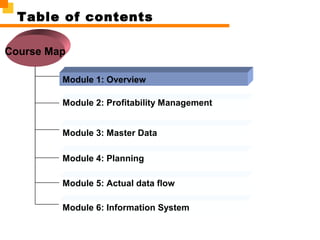
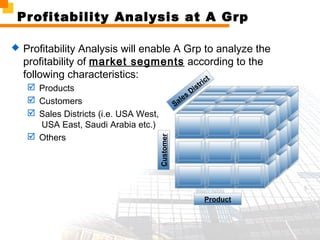
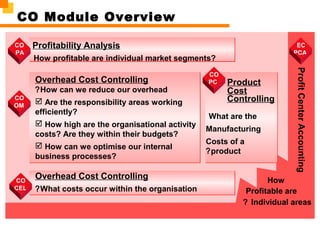
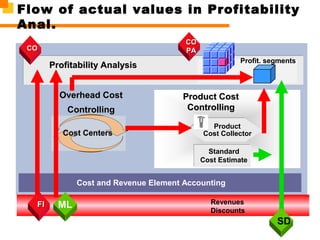
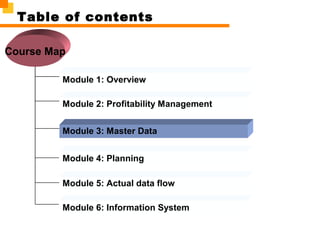
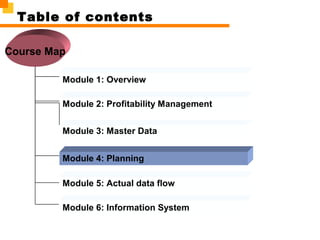
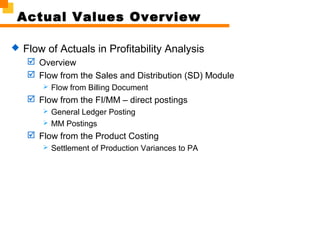
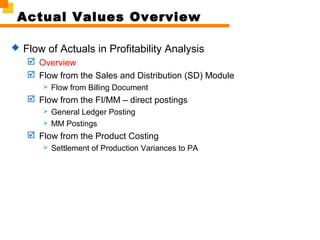
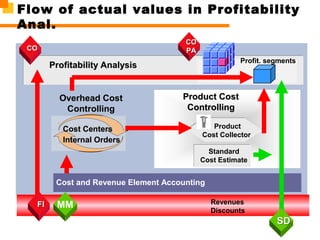
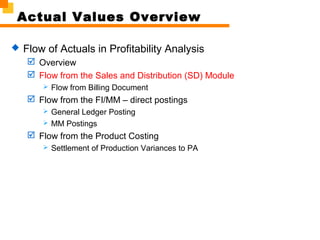
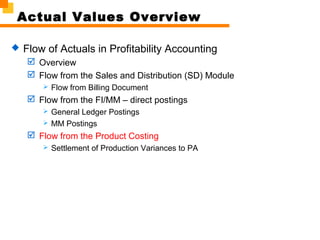
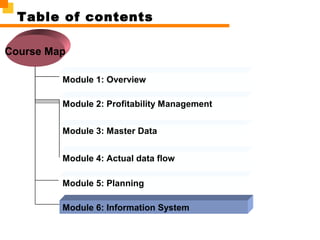
The document provides an overview of profitability analysis (CO-PA) in SAP. It discusses the objectives of CO-PA which include understanding functions, master data, sources of actual values, and planning. It also outlines the course content which covers CO-PA structures, actual value flows from sales, FI/MM, and product costing, planning methods and versions, and the CO-PA information system.
Account-based COPA is also called a hybrid of general ledger and costing-based COPA. In Account based COPA, you can get a report that is reconciled and consistent with financial accounting. Sales, markeitng and product management details can be obtained from it.
COPA is one of the components of controlling modules of SAP which deals with reporting of profitability across various dimensions. CO-PA stands for controlling-profitability analysis which is commonly referred to as SAP-COPA. It enables you to evaluate your company’s profit or contribution margin by market segment or by strategic business unit (such as a sales organization or profit centre).
AUC is Asset under construction where some assets are in construction phase and cost needs to
capture through internal order for the time being. Once asset is fully completed then cost would
be transferred to another cost object (E.g. Cost center, Order etc...) and settle with final asset.
E.g. XYZ Company constructing building for their office. While construction many expenses are
attached to it. Till the time it is created we cannot charge it in building account hence we need to
create AUC account where cost will be stored.
Assets under construction (AUC) are a special form of tangible assets. They are usually displayed
as a separate balance sheet item and therefore require a separate account determination and their
own asset classes. During the construction phase of an asset, all actual postings are assigned to the
AUC. Once the asset is completed, a transfer is made to the final fixed asset
SAP Accounts Reveivable Functions | http://sapdocs.infosapdocs. info
Get this and other SAP Account Reveivable Materials from http://sapdocs.info/sap/fico/sap-accounts-receivable-ppt-training-materials-documents-for-beginners/
for more SAP Documents please visit http://sapdocs.info
SAP Product costing Calculation With Components - SkillstekSkillstek
SAP Product Cost Calculation is done in the 6 key components of Product Costing, which is part of SAP CO.
Read it at Skillstek's Blog:- https://skillstek.com/product-costing-in-sap/
For more informative content, visit:-
https://skillstek.com/blog
Contact Details:-
Website:- https://skillstek.com
Phone:- +91-9556432150
Email:- info@skillstek.com
Social Accounts:-
LinkedIn:- https://www.linkedin.com/company/skillstek
Facebook:- https://www.facebook.com/SkillstekEdu
YouTube Channel:- https://www.youtube.com/c/skillstek
Instagram:- https://www.instagram.com/skillsteksap/
Leveraging the cloud to quickly test drive how SAP HANA can accelerate your SAP ERP system without migration to Suite on HANA or SAP S/4HANA using one of the first approaches for ERP-based HANA Acceleration
SAP’s innovations – Are you overlooking important functionality in SAP Contro...John Jordan
While it’s hard to miss marketing information on SAP Fiori and SAP HANA, there are lots of other innovations in SAP Controlling you may be overlooking. Many of the innovations that went under the SAP HANA umbrella can be used on any ERP system. In this session we’ll cover:
• Using virtual InfoProviders on ERP table structures to enable new reporting in SAP Material Ledger and Profitability Analysis (account-based and costing-based)
• Activating some business functions delivered in recent enhancement packages, such as cross-company actual costing, parallel cost of goods manufactured, operation level costing, stock in transit, and many more
• Leveraging cross-company actual costing to allow SAP Material Ledger to transfer values across company codes and stock in transit as a logistics enabler
• Using parallel cost of goods manufactured and parallel asset accounting to extend parallel accounting functions originally delivered with new general ledger
Walk away with tips for modernizing your company’s CO-PA and SAP Material Ledger reporting.
SAP HANA and SAP Controlling – New Opportunities and New ChallengesJohn Jordan
You've heard the buzz about SAP HANA, but what does it mean to you? This presentation will introduce the technical concepts behind in-memory data management and how those concepts impact SAP Controlling. This session will cover:
*Basic SAP HANA architecture including column vs. row storage and how this impacts how data can be stored and accessed in CO
*Insight into how (and why!) SAP is gradually removing aggregates from CO so that only line items remain
*How partitioning worked in the past and how SAP CO will potentially change to accommodate new opportunities
*Changes on the horizon for SAP HANA and their relevance for Controlling users
Gain a solid understanding of how you can apply SAP HANA functionality to simplify your access to and analysis of controlling data.
A comprehensive guide to us cma syllabus convertedshindeprahalad
Certified Management Accountant (CMA) is the highest level of certification in management accounting awarded by the Institute of Management Accountants (IMA), USA. The US CMA Course is globally recognized, advanced-level credential appropriate for accountants and financial professionals in the business.
Spectrum ERP is designed to Derive Profitable Growth, Maximize Efficiency and Transform Business with a complete, robust and cost-effective solution for SME. Our business solution is well known for its quality and will help you manage every aspect of your company- from sales to Operations and financials.
With Spectrum ERP you would be able to achieve:
• Response and deliver to your customers on time
• Keep your inventory under control
• Plan, schedule and monitor your productions
• Plan your inventory as per your production schedule
• Track and analyse your manufacturing cost on a real time basis
• Compliance all your statutory needs
• Integrate all your business function and department to create greater value for organization.
• Implement and monitor your business strategy through IT
• Measure and monitor your KPIs.
• Auto generated MIS reports delivered to your mailbox.
• Get timely alerts for exceptions in systems
• Check and manage your resources effectively.
• Create and put digital infrastructure in place to manage growth expectations
• Create a system which is not dependant on people
> Major Modules We Have:
•Material Management
•Sales & Distribution
•Production & Planning
•Quality
•Finance and Costing
•Payroll
•HR ( Upcoming )
•Project and Execution
•Plant & Maintenance
•Service Management
•CRM
•MIS Reports & Dashboards
> Key Features:
•Supports Multiple Company / branch /division
•User Role & Right Management
•Event based alerts & Pop Ups
•Notifications, Mails & SMS
•Rich in Report & Analysis. Export data in Excel, Pdf & other formats
•Inbuilt Docs Attachment System
•Chat System
•Online Accounting
•Head Office Consolidation
•Integrated Mail System
•High Level of Automation
•High usability (easy interface & Microsoft standard)
Food manufacturers are not unique in the problems they have in evolving and becoming more competitive in their market place. This is a short presentation that talks to the main reasons manufacturers find it so hard t adapt and change and improve their performance.
Orqubit Business Intelligence provides reports, MIS and dashboards for Tally.ERP9, custom applications, ERPs and a variety of databases. Orqubit BI has been implemented across different industry verticals. For more information about Orqubit BI visit http://www.orqubit.com
Achieving Sales Performance Optimization Through Automated Incentive Compensa...Callidus Software
presented at TrueConnection: Sales Performance Management Conference 2007 by Jeff Staley, CRM Center of Excellence at SAP, and Jim Thomas, Senior Sales Engineer at Callidus Software
2. Course Objectives
Understand the functions in Profitability Analysis.
Explain Profitability management in SAP.
Understand CO-PA structures and master data.
Identify the source of actual values.
Understand planning.
Use the CO-PA information system.
3. Module 1: Overview
Module 2: Profitability Management
Course Map
Table of contents
Module 5: Actual data flow
Module 3: Master Data
Module 4: Planning
Module 6: Information System
4. Profitability Analysis at A Grp
Profitability Analysis will enable A Grp to analyze the
profitability of market segments according to the
following characteristics:
Products
Customers
Sales Districts (i.e. USA West,
USA East, Saudi Arabia etc.)
Others
Product
Sales
District
Customer
5. How profitable are individual market segments?
Overhead Cost Controlling
How can we reduce our overhead?
Are the responsibility areas working
efficiently?
How high are the organisational activity
costs? Are they within their budgets?
How can we optimise our internal
business processes?
EC
PCA
ProfitCenterAccounting
How
Profitable are
Individual areas?
Overhead Cost Controlling
What costs occur within the organisation?
CO
CEL
CO
PA
CO
OM
Profitability Analysis
CO
PC Product
Cost
Controlling
What are the
Manufacturing
Costs of a
product?
CO Module Overview
6. Product CostProduct Cost
ControllingControlling
Profitability AnalysisProfitability Analysis
COCO
Standard
Cost Estimate
Revenues
Discounts
Cost Collector
Overhead CostOverhead Cost
ControllingControlling
•
•
Cost CentersCost Centers
•
Profit. segments
Cost and Revenue Element Accounting
Flow of actual values in Profitability
Anal.
FIFI
COCO
PAPA
Product
SD
ML
7. Module 1: Overview
Module 2: Profitability Management
Course Map
Table of contents
Module 5: Actual data flow
Module 3: Master Data
Module 4: Planning
Module 6: Information System
9. Terms used in Profitability Analysis
Accounting Methods
Period Accounting
Cost of Sales Accounting
Values
Gross Sales
Net Sales
Variances
Ratios
Economic Profit
Contribution Margin
10. Methods of Determining Profits
Period accounting method Cost of Sales method
•Revenues
•Sales deductions
•Changes in stock
•Capitalized internal services
• Work in process
•Revenues
•Sales deductions
•Cost of sales
(incl. variances for period)
Total activities Gross result
•Total costs:
Material costs
Personnel costs
Other costs
•Sales and distribution costs
•Administrative costs
•Research & Development
Result Result
11. Aspects of Profitability Management
Characteristics
CO-PA
costing-based
EC-PCA
profit center
Enterprise
controlling
Aims of
profitability
accounting
Key figures
Calculation
of profits
Reconciliation
with FI
profit-related
key figures
posted and
imputed values
Sales and
profitability
controlling
period accounting
and cost-of sales
methods
cost-of-sales
method
profit-rel. key fig.
balance sheet fig.
posted values
12. Reporting Dimensions
CustomerRegion
Sales officeBusiness Unit
Revenue
Cost
Loss
Profit
Sales Quantity
Sales Revenue
Customer discount
Sales commission
Direct sales costs
Net revenue
Direct material costs
Variable production costs
Contribution margin I
Indirect overhead
Fixed production costs
Contribution margin II
Variances
Contribution margin III
Operating profit
Product
Determine and analyze the
profitability of market segments
Profitability Analysis by Market
Segment
13. Module 1: Overview
Module 2: Profitability Management
Course Map
Table of contents
Module 5: Actual data flow
Module 3: Master Data
Module 4: Planning
Module 6: Information System
14. Master Data – Currency of Op.
Concern
Profitability Accounting
(costing based)
COCO
PAPA
Operating Concern
9100
Currency
B0 = SAR
15. Master Data in Profitability Analysis
Cost Element
Cost
Element
Accounting
Profitability
Segment
Profitability
Analysis
Characteristics
Value Fields
17. Master Data in Profitability Analysis
Profitability
Segment
Profitability Segment - object within Profitability Analysis to which
costs and revenues are assigned. A profitability segment
corresponds to a market segment.
You can calculate the profitability of a profitability
segment by setting off its sales revenues against its costs. A
profitability segment in an operating concern is defined by a
combination of characteristic values. Characteristics can be
concepts that already exist in the R/3 System (customer, product,
sales organization, and so on).
18. Categories of Characteristics (1)
Characteristics
delivered
by SAP
Fixed Characteristics
Predefined Characteristics
• Characteristics are valid in all clients
• Characteristics are available for all Operating Concerns
19. Categories of Characteristics (2)
Characteristics
delivered
by SAP
Characteristics
created
by Customer
Fixed Characteristics
Predefined Characteristics
Characteristics copied from
SAP Reference Tables
Custom
Characteristics
20. Categories of Value Fields
Value Fields
delivered
by SAP
Value Fields
created
by Customer
Predefined Value Fields
Custom Value Fields
22. Module 1: Overview
Module 2: Profitability Management
Course Map
Table of contents
Module 5: Actual data flow
Module 3: Master Data
Module 4: Planning
Module 6: Information System
23. CO-PA Planning Objectives
Plan Integration
Plan Versions
Creation of a sales plan using planning level and planning
packages
Plan Data Transfer
24. CO-PA Planning Objectives
Plan Integration
Plan Versions
Creation of a sales plan using planning level and planning
packages
Plan Data Transfer
26. CO-PA Planning Objectives
Plan Integration
Plan Versions
Creation of a sales plan using planning level and planning
packages
Plan Data Transfer
27. Settings for CO-PAGeneral Version Definition
Version
Plan
Actual
00 Version Locked
Currency type
Exchange Rate
Fiscal year dependent
parameters in CO-OM
Integrated Planning
MP
Plan Version ‘0’ SABIC
1. Plan records are posted
as line items from respective
areas.
1
1. The currency type
determines the currency or
valuation view in which the
amounts are to be displayed
or planned.
B0 - Operating Concern
Currency
2
2. Controls the exchange rate
type, i.e. Buying rate, selling
rate or P – Standard
translation for planning.
1PB0
28. CO-PA Planning Objectives
Plan Integration
Plan Versions
Creation of a sales plan using planning level and planning
packages
Plan Data Transfer
33. Module 1: Overview
Module 2: Profitability Management
Table of contents
Module 5: Actual data flow
Module 3: Master Data
Module 4: Planning
Module 6: Information System
Course Map
34. Actual Values Overview
Flow of Actuals in Profitability Analysis
Overview
Flow from the Sales and Distribution (SD) Module
Flow from Billing Document
Flow from the FI/MM – direct postings
General Ledger Posting
MM Postings
Flow from the Product Costing
Settlement of Production Variances to PA
35. Actual Values Overview
Flow of Actuals in Profitability Analysis
Overview
Flow from the Sales and Distribution (SD) Module
Flow from Billing Document
Flow from the FI/MM – direct postings
General Ledger Posting
MM Postings
Flow from the Product Costing
Settlement of Production Variances to PA
36. Product CostProduct Cost
ControllingControlling
Profitability AnalysisProfitability Analysis
COCO
Standard
Cost Estimate
Revenues
Discounts
Overhead CostOverhead Cost
ControllingControlling
•
•
Cost CentersCost Centers
• Internal OrdersInternal Orders
Profit. segments
Cost and Revenue Element Accounting
Flow of actual values in Profitability
Anal.
FIFI
COCO
PAPA
Product
Cost Collector
SDSD
MM
37. Quantity
Revenues
Sales deductions
Cost of Goods Sold
Freight costs
Inventory re-valuation
Direct Posting fromDirect Posting from FIFI
Source Transaction
Value
Field
Billing DocumentBilling Document
Sources of value fields
38. Actual Values Overview
Flow of Actuals in Profitability Analysis
Overview
Flow from the Sales and Distribution (SD) Module
Flow from Billing Document
Flow from the FI/MM – direct postings
General Ledger Posting
MM Postings
Flow from the Product Costing
Settlement of Production Variances to PA
40. Flow from sales and distribution (2)
Business
process
VV
AA
LL
UU
FF
LL
OO
WW
Sales/Billing
SDSD
Receivables
…
10,000
Sales
810000
10,000 -
E
COCO
PAPA
FIFI Cost of Goods
Sold
Standard
Price
Product
Cost
Estimate
+
41. Actual Values Overview
Flow of Actuals in Profitability Accounting
Overview
Flow from the Sales and Distribution (SD) Module
Flow from Billing Document
Flow from the FI/MM – direct postings
General Ledger Posting
MM Postings
Flow from the Product Costing
Settlement of Production Variances to PA
44. Actual Values Overview
Flow of Actuals in Profitability Accounting
Overview
Flow from the Sales and Distribution (SD) Module
Flow from Billing Document
Flow from the FI/MM – direct postings
General Ledger Postings
MM Postings
Flow from the Product Costing
Settlement of Production Variances to PA
45. Flow from CO-PC
Delivery
Goods Issues
of materials from
stock
Confirmations/
activity allocation
Delivery
tostock
Warehouse
‘Production Order’
Plan costs Actual costsProduct Costing
Calculate
variances
COCO
PCPC
COCO
PCPC
MMMM
...
...
Variances
FIFI
COCO
PAPA
+
Settlement
47. Module 1: Overview
Module 2: Profitability Management
Table of contents
Module 5: Planning
Module 3: Master Data
Module 4: Actual data flow
Module 6: Information System
Course Map
49. Course Summary
You should now:
Have an understanding the functions in Profitability
Analysis.
Understand CO-PA structures and master data.
Identify the source of actual values.
Understand planning.
Use the CO-PA information system.
Editor's Notes
Profitability Analysis (CO-PA) enables A Grp to evaluate market segments, which can be classified according to product, customers, sales districts or any combination of these, or strategic business units, Business segment, Business field with respect to your company's profit or contribution margin (gross margin). It represents market-oriented approach.
The aim of the system is to provide your sales, marketing, product management and corporate planning departments with information to support internal accounting and decision-making.
Controlling provides you with information for management decision-making. It facilitates coordination, monitoring and optimization of all processes in an organization. This involves recording both the consumption of production factors and the services provided by an organization.
All data relevant to costs flows automatically from Financial Accounting to Controlling. As part of this process, the system assigns the costs and revenues to different CO account assignment objects like cost centers, business processes, projects, or orders. The relevant accounts in Financial Accounting are managed in Controlling as cost elements or revenue elements as appropriate.
How profitable are individual enterprise areas? Profit Center Accounting (EC-PCA) provides a focus on internal areas of a company that have responsibility for achieving certain profit or productivity goals.
Profitability Analysis (CO-PA) provides a focus on the results of a company’s doing business with the external marketplace. It provides the ability to define which aspects or segments of that market are relevant for analyzing operating results, such as profit by customer, product, geographic area, sales organization, etc.
You use Cost Center Accounting for controlling purposes within your organization. It serves as a tool for monitoring overhead costs and assigning them to the location at which they occurred in line with their source.
Product Cost Controlling calculates the costs arising from the manufacture of a product or the provision of a service. It enables you to calculate the minimum price at which a product can be profitably marketed.
Actual Postings represent the most important source of information in CO-PA. You can transfer billing documents (used in A Grp) from the Sales and Distribution (SD) application component to CO-PA in real time. You can also transfer costs from cost centers, orders and projects (in next phase), as well as i.e. demurrage costs and revenues from direct postings (G/L account postings in FI, orders received in MM, and so on) or asses costs from CO to profitability segments.
In costing-based CO-PA, you can valuate incoming billing documents to automatically determine anticipated sales deductions, costs or even estimated costs, such as Estimated Port Charges. You can also revaluate your data periodically to adjust the initial, real time valuation or add the actual costs of goods manufactured.
Profitability Reporting:
Profitability Analysis (CO-PA) lets you analyze the profitability of segments of your external market. These segments can be defined according to products, customers, countries, and numerous other characteristics, as well as your internal organizational units such as company codes (i.e. 9100) or distribution channels (I.e. direct, wholesale, e-Commerce).
The aim is to provide your executive management, sales, marketing, planning, and other groups in your organization with decision-support from a market-oriented viewpoint.
Responsibility Reporting:
EC-PCA lets you analyze internal profit and loss for profit centers. This makes it possible for you to evaluate different areas or units within your company. You can structure profit centers according to region (branch offices, plants), function (production, sales), or product (product groups, as in A Grp). Profit Center Accounting is a component of the "Enterprise Controlling" module.
The period accounting approach distinguishes between individual cost and revenue elements (such as material costs). The total costs for the period are compared with the total operating output for the period. The output of products manufactured within the period but not yet sold (stock increases), are added to the sales revenues, and the costs of the products produced in past periods but sold in this period (stock decreases), are taken away. Together with additional capitalized internal activities and other revenues, this yields the total operating output for the period.
In the cost-of-sales accounting approach there is no differentiation according to cost elements. Here the sales revenues are compared with the manufacturing costs for the products sold (cost of sale). The manufacturing costs may include material and personnel costs, which were incurred in previous periods. Costs which cannot be directly assigned to the sale, such as sales and administration costs, are displayed separately. The cost-of-sales procedure therefore also indicates whereabouts in the company costs were incurred.
Profitability controlling in the R/3 System is subdivided according to various aspects:
Scope of business activities encompassed(Cost-of-sales accounting or period accounting)
Representation of profits (account-based or costing-based)
Valuation base of costs (actual, standard)
Scope of costs (partial/full costs)
Profitability Analysis (CO-PA) calculates profits according to cost-of-sales method of accounting.
Profit Center Accounting (EC-PCA), on the other hand, supports both period accounting and cost-of-sales approach.
Both of these methods are used at the same time in your organization.
Contribution Margin is equal to sales revenues less variable costs. This amount is available to offset fixed expenses and produce an operating profit for the business.
Variable Costs vary in proportion to sales levels. They can include direct material and labor costs, the variable part of manufacturing overhead, and transportation and sales commission expenses.
Fixed Costs remain constant (or nearly so) within the projected range of sales levels. These can include facilities costs, certain general and administrative costs, and interest and depreciation expense.
All above terms are used for Breakeven Point calculation to know an answer for a question in which segments we are successful?
Operating concern currency - in costing-based Profitability Analysis, actual data is always updated in the operating concern currency.
Even if all amounts are stored only in the operating concern currency, it is possible to report using other currencies. However, reporting translation is only possible using period-average translation rates.
The structure of an operating concern is determined by the:
characteristics (profitability segments)
value fields such as revenues, rebates, etc. (costing-based Profitability Analysis)
cost and revenue elements – you have to create revenue cost elements under category ’11 – Revenues’ and ’12 - Sales deduction’ to allow the update of the SD conditions in costing-based CO-PA.
<number>
Module name: CO-PA
Course Code: CO PA01
Profitability segment is a reflection of a market segment.
Characteristics
Question: "What do I want to report on?"
Examples: Affiliates, Region, Products, Customers
Characteristic Values
Question: "What values can I have for these characteristics?"
Examples: Region South; Region North
Profitability Segments
Question: "What is the technical definition of my sales channel?"
Example: combination of Country Japan, Region Tokyo, Product Ehtylene Glycol.
Value Fields
Question: "What performance measures do I want to track and analyze?"
Examples: Gross Sales, Surcharges, Discounts, Cost-of-Sales
Characteristics are the criteria in Profitability Analysis (CO-PA) according to which you can analyze your operating result and perform differentiated sales and profit planning and reporting. A combination of values for the characteristics in an operating concern is called a Profitability Segment, i.e. values for characteristic Division are as follow: Basic Chemicals, Polyolefins, PVC/Polyester, Intermediates, Fertilizers, Metals, Intercompany Div.
Some of the standard (fixed) characteristics, also in A Grp are:
Billing type, Business area, Company code, Controlling area, Cost object, Customer, Distribution channel,
Division, Order, Partner profit center, Plant, Product, Profit center, Record type, Sales order, Sales order item, Sales organization, Version, WBS element.
It is possible to view the information in PA by any combination of characteristics maintained in transaction KEQ3, i.e. we can view any segment that is defined by a combination of characteristic values.
Several essential and obvious characteristics (like "sales organization"," customer", "product", etc.) are pre-defined automatically for every operating concern; these are known as fixed characteristics.
In addition to the fixed characteristics, up to 50 non-fixed characteristics can be added to an operating concern. Often, only 10 to 20 of these are required to meet most companies' reporting needs.
Specific characteristics for A Grp:
Copied characteristics:
Sales group, Bill to party, product hierarchy
User-defined characteristics
Business Segment
Business field
It is possible to view the information in PA by any combination of these characteristics, i.e. we can view any segment that is defined by a combination of characteristic values.
In costing-based Profitability Analysis, value fields store the base quantities and amounts for reporting. Value fields can either be highly summarized (representing a summary of cost element balances, for example) or highly detailed (representing just one part of a single cost element balance).
Generally, value fields are highly detailed with regards to sales performance figures (like types of revenues, discounts, surcharges, etc.), and more summarized for other items relating to period costs (like types of period expenses). New operating concerns generally have 20 to 60 value fields.
Unlike characteristics, there are no fixed value fields for a new operating concern.
It is not necessary to create value fields for calculated items, such as net sales, contribution margin, etc. These items are normally calculated from the base values stored in the value fields during the report execution progress (to minimize necessary data storage requirements).
<number>
Module name: CO-PA
Course Code: CO PA01
Example of analysis of profitability segments according to SABIC’s characteristics:
Division = Basic Chemicals
Customer = Atlantic Methanol
Product = Butadiene
A grp plans at material level in Excel spreadsheets and then upload planning data into the SAP.
In bottom-up planning, plan data can be entered manually for each sales representative and then brought together in a single plan version.
Once planning has been finalized, the plan data can then be transferred over to production planning, thereby allowing production plan data to be reconciled with sales planning.
Plan version (CO-PA) The version enables you to keep two or more sets of data for the same object. You can maintain and evaluate several plan versions at the same time.
You may wish to have different versions of plan data based, for example, on the type of assumption for the forecast (optimistic, pessimistic), when the plan was created (original plan, updated forecast), how binding the plan is.
Taking into account a typical sales and profit planning process, a professional planning tool has to:
Support the individual planning tasks by guiding the user to those planning levels he/she needs to plan. For example, a key account manager needs to plan on the key customer, sales organization and product level.
Support the individual planners by providing personalized access to the desired plan data, using planning packages
Provide a set of relevant planning functions (methods), such as valuations and simulations (forecast, revaluations, etc.) in order to apply the desired planning packages by using planning methods and parameters.
It is possible to plan on many different levels in CO-PA during a planning process. For example, it's possible to plan on the product group level, or the product level, or the customer/product level, or maybe just the customer level. In fact, it is possible to plan on any profitability segment in CO-PA.
By design, the system ensures that the data remains consistent across all levels throughout the planning process, meaning that subtotals will always roll up to totals.
Derivation occurs automatically behind the scenes when planning data is saved. Since this is true, values planned under one or more characteristic values might automatically be summarized under other characteristics as well.
Integrated Planning in controlling, where planning is conducted separately for multiple business activities, but the different plans are linked to ensure consistency and to drive realistic corporate-wide planning. Thus, the separate planning results for sales, service, production, procurement, general, and administration activities coincide to form one corporate operational plan.
It is possible to transfer sales plan information back and forth between costing-based Profitability Analysis (CO-PA) and Sales and Operations Planning (SOP). This allows for synchronizing planned sales quantities between these areas.
This flow of planning data is but one example of many possible planning strategies that can be used in R/3. In A Grp integrated planning between CO-PA and PCA is not used but both modules are fed with data from Sales and Profit Plan prepared in Excel spreadsheet.
Actual Postings represent the most important source of information in CO-PA. You transfer billing documents (used in A Grp) from the Sales and Distribution (SD) application component to CO-PA in real time. You can transfer costs (i.e. demurrage costs) and revenues from direct postings (G/L account postings in FI, orders received in MM, and so on) and settle variances from cost objects (production orders) from CO-PC to profitability segments.
In costing-based CO-PA, you can valuate incoming billing documents to automatically determine anticipated sales deductions, costs or even estimated costs, such as Estimated Port Charges. You can also revaluate your data periodically to adjust the initial, real time valuation or add the actual costs of goods manufactured.
Using direct postings in FI you can post actual sales reductions, such as annual volume-based rebates, or actual costs, such as freight costs (estimated when the period was closed in order to allow short-term analysis) to the corresponding profitability segments. This supplements the estimated costs with the actual costs.
The goods issue is triggered by a delivery in SD. This affects the values in Materials Management and Financial Accounting. Balance sheet and stock change postings are made in FI when the goods issue is posted according to a price in material master.
Note that the goods issue posting does not cause any data to be posted in costing-based CO-PA. The cost of goods sold is only transferred to costing-based CO-PA when the billing document is transferred.
The following data is transferred from bills and debit and credit memos to CO-PA.
Revenues
Sales deductions (shipping, discounts, and so on)
Accruals (e.g. from rebate agreements – at first posted in FI)
The cost of goods sold is only transferred to costing-based CO-PA when the billing document is transferred according to a price in material master and a material cost estimate valid on the date of a delivery. This enhancement helps to reconcile COGS posted in FI in a moment of a delivery with COGS posted in CO-PA during billing. It is extremely important while there is a huge time gap between a delivery and a billing.
Using direct postings in FI you can post actual sales reductions, such as annual volume-based rebates, or actual costs, such as demurrage costs (estimated when the period was closed in order to allow short-term analysis) to the corresponding profitability segments. This supplements the estimated costs with the actual costs.
This type of posting will not take place often but can be used to post any type of automatic transaction to CO-PA.
Examples include Inventory Revaluations, I.e. manual with transaction MR21 or with Post Closing step during Material Ledger period-end closing while system uses the periodic unit price that was calculated by the last price determination for the material to revaluate the material stock of the previous period.
The data is posted to a profitability segment found on the basis of the information found in the FI document. If the information there is not very detailed (not many characteristic values), the data is posted to a higher aggregation level.
You assign the values to a profitability segment directly in the FI posting transaction. There you can call up a special assignment dialog box for each posting line by clicking the Prof. segment field.
In this dialog box the system displays the characteristics that you can choose from the operating concern you are working in. You can predefine what is displayed on this screen by defining a “characteristic group” for the activity RFBU in Customizing. The characteristic group defines which characteristics are displayed for selection.
System can determine a profitability segment by means of substitution for automatic postings (transaction OKB9). The corresponding posting is then passed on to Profitability Analysis (CO-PA).
Typical business transactions for which a profitability segment is found automatically include:
price differences that are posted in purchasing due to differing order prices or differing prices in invoice receipt (as period costs)
revaluation of material stocks (as period costs) - expenses or revenues.
inventory differences (as period costs)
After finishing the production process (CO production orders), or at the end of the period (product cost collectors), the production order variances will be settled to a price difference account and to CO-PA.
You can settle (transfer) the production variances calculated in Product Cost Controlling for product cost collectors (settled periodically) and CO production orders to CO-PA. The individual variance categories (such as material price variance, material quantity variance, etc.) are transferred separately.
The PA transfer structure ‘Z9’ consists of items called assignment lines. In these assignment lines you assign a cost element group and a variance category to a value field of the operating concern. To assure correct settlement to Profitability Analysis, you must assign each combination of the cost element group and the variance category to one value field in the operating concern.
Note the following when you use a PA transfer structure:
Every debit cost element must be in the PA transfer structure. You can either group all cost elements into a cost element group or define a number of groups for materials, internal activities, business processes, other overhead costs, etc. These groups are entered under the section “cost elements”.
Every variance category must be represented in the PA transfer structure. The variance categories are specified by the system and are entered under the “source” section.
Each debit cost element or combination of cost element group and variance category can only be assigned to one value field (n:1 relation).
The PA transfer structure ‘Z9’ is assigned to the settlement profile ‘PP01’ which is defaulted for order types: RM01 - PCC for Repetitive Manufacturing, RM02 - PCC for Process Orders and CP01 - Standard CO production order.
<number>
Module name: CO-PA
Course Code: CO PA01
If you want to execute a report with the output type 'graphical report output', the system displays the same data as with the old list. However, GUI elements are used, which are embedded in a splitter control. This means that the screen is made up of a number of areas, which the user can freely define.
In addition to the more attractive display, a further advantage of this display type is that various functions can be called up using drag and drop. This makes it possible to change the order of columns by marking a column and dragging it to a different position on the screen. It also allows navigation functions, such as drilldown or drilldown switch.