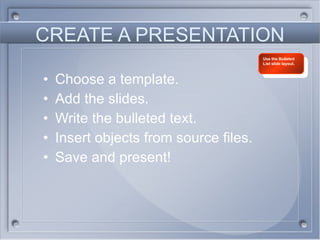
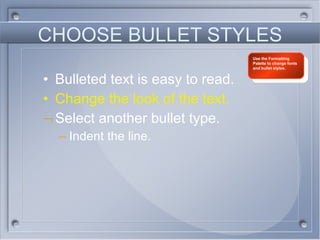
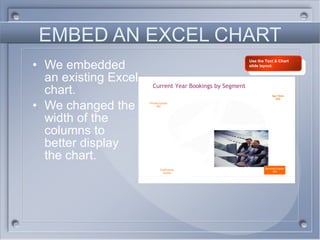
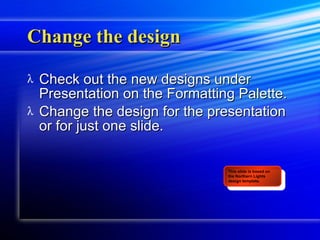
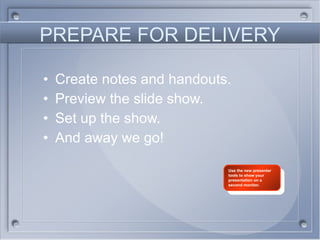
This presentation provides instructions for creating and customizing a PowerPoint presentation. It covers choosing a template and slide layouts, adding and formatting text and bulleted lists, embedding Excel charts, changing the presentation design, and preparing for delivery with notes, handouts, and presenter view. The overall goal is to demonstrate the basic features and functionality of PowerPoint.
Ribbon Toolbar & Formatting
Inserting and Adding Objects
Creating Theme Color
Creating a Hyperlink
Slide Transitions
Slide Animation
Starting a Slide Show
Printing Slide
Microsoft Office Templates
40 Tools in 20 Minutes: Hacking your Marketing CareerEric Leist
Marketing today requires doing a little bit of everything from creative writing to HTML to light Photoshopping. There are a ton of free tools to make those tasks easier and scalable.
Originally presented at Suffolk University's Bridging the Gap Conference--April 18th, 2014.
WEB APPS
http://zapier.com
https://ifttt.com/
http://twitterfeed.com/
http://gaggleamp.com
http://landerapp.com/
https://support.google.com/analytics/answer/1033867?hl=en
http://99designs.com/
http://visual.ly
http://www.alexa.com/
http://www.hubspot.com/blog-topic-generator
http://www.wordle.net/
www.inboundwriter.com
http://litmus.com/
http://www.inboundwriter.com/
https://www.optimizely.com/
http://thenounproject.com/
http://fortawesome.github.io/Font-Awesome/
https://www.facebook.com/help/459892990722543/
http://ads.twitter.com
https://plzadvize.com/
DESKTOP APPS
https://itunes.apple.com/us/app/caffeine/id411246225?mt=12
http://jumpcut.sourceforge.net/
http://www.gifgrabber.com/
http://www.gimp.org/
EMAIL TOOLS
http://getsignals.com
http://www.yesware.com/
http://www.boomeranggmail.com/
http://rapportive.com/
http://www.wisestamp.com/
http://verify-email.org
MOBILE APPS
https://play.google.com/store/apps/details?id=com.xuchdeid.clear
https://itunes.apple.com/us/app/cardmunch-business-card-reader/id478351777?mt=8
BROWSER PLUGINS
https://chrome.google.com/webstore/detail/omnidrive/gpnikbcifngfgfcgcgfahidojdpklfia?hl=en-US
https://addons.mozilla.org/en-US/firefox/addon/klout/
LEARNING PLATFORMS
http://www.google.com/analytics/learn/
http://www.codecademy.com/
http://teamtreehouse.com/
https://generalassemb.ly/
http://www.intelligent.ly/
http://smarterer.com/
How to Craft Your Company's Storytelling Voice by Ann Handley of MarketingProfsMarketingProfs
You know your company's story, but what's the right voice to use in telling it? Find out how to craft your company's storytelling voice. Ann Handley, chief content officer of MarketingProfs and author of "Content Rules" shares tips and ideas for crafting your brand's storytelling voice.
An effective pitch presentation can be the difference between securing investment and/or support for your startup. Download our slide presentation, "Build a Better Pitch Deck," and gain insight on what content to include in your slides and how to design them for the most impact. This information is aggregated from leading entrepreneurship and investor sources both in Arizona and throughout the nation.
What REALLY Differentiates The Best Content Marketers From The RestRoss Simmonds
I’ve been privileged to work with brands from all over the world in the last few years. Through this work, I’ve also had a chance to meet, become friends with, work with and collaborate with some of the best content marketers in the world. Some of these marketers have their faces plastered in magazines while others keep it low key and aren’t anything close to household names.
When I first started my career, I made it my mission to learn from the best. I studied and read books from the advertising greats and consumed every blog post I could fine from the top modern day marketers I could fine. Through discussions, research and studying the craft, I’ve been able to identify and uncover a few common traits that are found in the best content marketers today. If you want to be a great content marketer, you need to know what it takes to be considered such. Here’s a few traits that differentiate the best content marketers from the rest.
You’re not the expert. Your customers are, and who your customer is, is changing rapidly. Learn more about the digital consumer, how to bring new life to your customer experience, and inspire your team with workshop activities. Take a deeper look into the key drivers of your business, reinvigorate your customer experience, and gain insight from one of the newest inspiring entrepreneurs, who built his business around an out-of-the-ordinary customer experience. Why not create an experience that will leave your customers talking and sharing your brand with everyone? These musings were gathered after attending the Next Generation Customer Experience Conference in San Diego, March 2015.
We Are Social's comprehensive new report covers internet, social media and mobile usage statistics from all over the world. It contains more than 350 infographics, including global snapshots, regional overviews, and in-depth profiles of 30 of the world's largest economies. For a more insightful analysis of these numbers, please visit http://bit.ly/SDMW2015
This contains the entire 4-napkin health care series in one file. It makes more sense to read this one now than the others since it is the complete set all in one file.
Today we all live and work in the Internet Century, where technology is roiling the business landscape, and the pace of change is only accelerating.
In their new book How Google Works, Google Executive Chairman and ex-CEO Eric Schmidt and former SVP of Products Jonathan Rosenberg share the lessons they learned over the course of a decade running Google.
Covering topics including corporate culture, strategy, talent, decision-making, communication, innovation, and dealing with disruption, the authors illustrate management maxims with numerous insider anecdotes from Google’s history.
In an era when everything is speeding up, the best way for businesses to succeed is to attract smart-creative people and give them an environment where they can thrive at scale. How Google Works is a new book that explains how to do just that.
This is a visual preview of How Google Works. You can pick up a copy of the book at www.howgoogleworks.net
How People Really Hold and Touch (their Phones)Steven Hoober
For the newest version of this presentation, always go to: 4ourth.com/tppt
For the latest video version, see: 4ourth.com/tvid
Presented at ConveyUX in Seattle, 7 Feb 2014
For the newest version of this presentation, always go to: 4ourth.com/tppt
For the latest video version, see: 4ourth.com/tvid
We are finally starting to think about how touchscreen devices really work, and design proper sized targets, think about touch as different from mouse selection, and to create common gesture libraries.
But despite this we still forget the user. Fingers and thumbs take up space, and cover the screen. Corners of screens have different accuracy than the center. It's time to re-evaluate what we think we know.
Steven reviews his ongoing research into how people actually interact with mobile devices, presents some new ideas on how we can design to avoid errors and take advantage of this new knowledge, and leaves you with 10 (relatively) simple steps to improve your touchscreen designs tomorrow.
JMeter webinar - integration with InfluxDB and GrafanaRTTS
Watch this recorded webinar about real-time monitoring of application performance. See how to integrate Apache JMeter, the open-source leader in performance testing, with InfluxDB, the open-source time-series database, and Grafana, the open-source analytics and visualization application.
In this webinar, we will review the benefits of leveraging InfluxDB and Grafana when executing load tests and demonstrate how these tools are used to visualize performance metrics.
Length: 30 minutes
Session Overview
-------------------------------------------
During this webinar, we will cover the following topics while demonstrating the integrations of JMeter, InfluxDB and Grafana:
- What out-of-the-box solutions are available for real-time monitoring JMeter tests?
- What are the benefits of integrating InfluxDB and Grafana into the load testing stack?
- Which features are provided by Grafana?
- Demonstration of InfluxDB and Grafana using a practice web application
To view the webinar recording, go to:
https://www.rttsweb.com/jmeter-integration-webinar
Neuro-symbolic is not enough, we need neuro-*semantic*Frank van Harmelen
Neuro-symbolic (NeSy) AI is on the rise. However, simply machine learning on just any symbolic structure is not sufficient to really harvest the gains of NeSy. These will only be gained when the symbolic structures have an actual semantics. I give an operational definition of semantics as “predictable inference”.
All of this illustrated with link prediction over knowledge graphs, but the argument is general.
UiPath Test Automation using UiPath Test Suite series, part 4DianaGray10
Welcome to UiPath Test Automation using UiPath Test Suite series part 4. In this session, we will cover Test Manager overview along with SAP heatmap.
The UiPath Test Manager overview with SAP heatmap webinar offers a concise yet comprehensive exploration of the role of a Test Manager within SAP environments, coupled with the utilization of heatmaps for effective testing strategies.
Participants will gain insights into the responsibilities, challenges, and best practices associated with test management in SAP projects. Additionally, the webinar delves into the significance of heatmaps as a visual aid for identifying testing priorities, areas of risk, and resource allocation within SAP landscapes. Through this session, attendees can expect to enhance their understanding of test management principles while learning practical approaches to optimize testing processes in SAP environments using heatmap visualization techniques
What will you get from this session?
1. Insights into SAP testing best practices
2. Heatmap utilization for testing
3. Optimization of testing processes
4. Demo
Topics covered:
Execution from the test manager
Orchestrator execution result
Defect reporting
SAP heatmap example with demo
Speaker:
Deepak Rai, Automation Practice Lead, Boundaryless Group and UiPath MVP
LF Energy Webinar: Electrical Grid Modelling and Simulation Through PowSyBl -...DanBrown980551
Do you want to learn how to model and simulate an electrical network from scratch in under an hour?
Then welcome to this PowSyBl workshop, hosted by Rte, the French Transmission System Operator (TSO)!
During the webinar, you will discover the PowSyBl ecosystem as well as handle and study an electrical network through an interactive Python notebook.
PowSyBl is an open source project hosted by LF Energy, which offers a comprehensive set of features for electrical grid modelling and simulation. Among other advanced features, PowSyBl provides:
- A fully editable and extendable library for grid component modelling;
- Visualization tools to display your network;
- Grid simulation tools, such as power flows, security analyses (with or without remedial actions) and sensitivity analyses;
The framework is mostly written in Java, with a Python binding so that Python developers can access PowSyBl functionalities as well.
What you will learn during the webinar:
- For beginners: discover PowSyBl's functionalities through a quick general presentation and the notebook, without needing any expert coding skills;
- For advanced developers: master the skills to efficiently apply PowSyBl functionalities to your real-world scenarios.
Generating a custom Ruby SDK for your web service or Rails API using Smithyg2nightmarescribd
Have you ever wanted a Ruby client API to communicate with your web service? Smithy is a protocol-agnostic language for defining services and SDKs. Smithy Ruby is an implementation of Smithy that generates a Ruby SDK using a Smithy model. In this talk, we will explore Smithy and Smithy Ruby to learn how to generate custom feature-rich SDKs that can communicate with any web service, such as a Rails JSON API.
Kubernetes & AI - Beauty and the Beast !?! @KCD Istanbul 2024Tobias Schneck
As AI technology is pushing into IT I was wondering myself, as an “infrastructure container kubernetes guy”, how get this fancy AI technology get managed from an infrastructure operational view? Is it possible to apply our lovely cloud native principals as well? What benefit’s both technologies could bring to each other?
Let me take this questions and provide you a short journey through existing deployment models and use cases for AI software. On practical examples, we discuss what cloud/on-premise strategy we may need for applying it to our own infrastructure to get it to work from an enterprise perspective. I want to give an overview about infrastructure requirements and technologies, what could be beneficial or limiting your AI use cases in an enterprise environment. An interactive Demo will give you some insides, what approaches I got already working for real.
Slack (or Teams) Automation for Bonterra Impact Management (fka Social Soluti...Jeffrey Haguewood
Sidekick Solutions uses Bonterra Impact Management (fka Social Solutions Apricot) and automation solutions to integrate data for business workflows.
We believe integration and automation are essential to user experience and the promise of efficient work through technology. Automation is the critical ingredient to realizing that full vision. We develop integration products and services for Bonterra Case Management software to support the deployment of automations for a variety of use cases.
This video focuses on the notifications, alerts, and approval requests using Slack for Bonterra Impact Management. The solutions covered in this webinar can also be deployed for Microsoft Teams.
Interested in deploying notification automations for Bonterra Impact Management? Contact us at sales@sidekicksolutionsllc.com to discuss next steps.
State of ICS and IoT Cyber Threat Landscape Report 2024 previewPrayukth K V
The IoT and OT threat landscape report has been prepared by the Threat Research Team at Sectrio using data from Sectrio, cyber threat intelligence farming facilities spread across over 85 cities around the world. In addition, Sectrio also runs AI-based advanced threat and payload engagement facilities that serve as sinks to attract and engage sophisticated threat actors, and newer malware including new variants and latent threats that are at an earlier stage of development.
The latest edition of the OT/ICS and IoT security Threat Landscape Report 2024 also covers:
State of global ICS asset and network exposure
Sectoral targets and attacks as well as the cost of ransom
Global APT activity, AI usage, actor and tactic profiles, and implications
Rise in volumes of AI-powered cyberattacks
Major cyber events in 2024
Malware and malicious payload trends
Cyberattack types and targets
Vulnerability exploit attempts on CVEs
Attacks on counties – USA
Expansion of bot farms – how, where, and why
In-depth analysis of the cyber threat landscape across North America, South America, Europe, APAC, and the Middle East
Why are attacks on smart factories rising?
Cyber risk predictions
Axis of attacks – Europe
Systemic attacks in the Middle East
Download the full report from here:
https://sectrio.com/resources/ot-threat-landscape-reports/sectrio-releases-ot-ics-and-iot-security-threat-landscape-report-2024/
Transcript: Selling digital books in 2024: Insights from industry leaders - T...BookNet Canada
The publishing industry has been selling digital audiobooks and ebooks for over a decade and has found its groove. What’s changed? What has stayed the same? Where do we go from here? Join a group of leading sales peers from across the industry for a conversation about the lessons learned since the popularization of digital books, best practices, digital book supply chain management, and more.
Link to video recording: https://bnctechforum.ca/sessions/selling-digital-books-in-2024-insights-from-industry-leaders/
Presented by BookNet Canada on May 28, 2024, with support from the Department of Canadian Heritage.
Securing your Kubernetes cluster_ a step-by-step guide to success !KatiaHIMEUR1
Today, after several years of existence, an extremely active community and an ultra-dynamic ecosystem, Kubernetes has established itself as the de facto standard in container orchestration. Thanks to a wide range of managed services, it has never been so easy to set up a ready-to-use Kubernetes cluster.
However, this ease of use means that the subject of security in Kubernetes is often left for later, or even neglected. This exposes companies to significant risks.
In this talk, I'll show you step-by-step how to secure your Kubernetes cluster for greater peace of mind and reliability.
Mission to Decommission: Importance of Decommissioning Products to Increase E...
Sample Presentation
1. SAMPLE PRESENTATION PowerPoint Basics Instructions for creating this presentation are included on the notes page of each slide. On the View menu, click Notes Page. Company Name presents To view the slide show, on the Slide Show menu, click View Show. Then click to continue viewing the effects of each slide in the presentation.
2.
3.
4. CREATE AN ORG CHART Use the Organization Chart slide layout.
5.
6.
7.
Editor's Notes
This sample presentation was created in a minimal amount of time and makes use of the designs, transitions, and animations in Microsoft PowerPoint. In the presentation, we created an organizational chart, embedded an Excel chart, and changed the design template. When you’ve finished examining the slides, view the slide show to see the animations, transitions, and movies, and hear the sounds. This first slide uses the Title Slide layout. To add a slide, on the Formatting Palette under Add Objects , click the Slides tab, and then select a layout. Click a placeholder and type your text. PowerPoint automatically formats the text according to the specifications of the design template. For each slide in this presentation, we used the slide layout that best represents the type of information we wanted to include on the slide. Text On the title slide, we used the text placeholders to type “SAMPLE PRESENTATION” as the title and “PowerPoint Basics” as the subtitle. To enter text in a text placeholder, click the placeholder and type the text. The top line of text, “Company Name presents,” is in a text box instead of a text placeholder. When you use text boxes, the text style matches that of the template you’re using, but you’ll need to size and position the text box on the slide yourself. Note that text entered in a text box does not appear in the outline. To add a text box: On the Insert menu, click Text Box . On the slide, drag to create the box. Type the text.
This slide uses the Bulleted List slide layout. We created the list by clicking the placeholder, typing the text, and pressing RETURN to create new bullets. The look of the bullets and the text is defined by the design template. Animations You can keep your presentation lively by animating the way text or pictures enter, exit, or provide emphasis on a slide. On this slide, we applied animation effects to the bulleted text, which causes the bullet points to appear one at a time according to the effect we selected. For this slide we chose to have the text appear from the right at a fast speed, but you can choose from several options. To animate text or pictures: In normal view, select the slide that contains the text or object you want to animate. On the Slide Show menu, click Custom Animation . Under Select to animate , click the text or object you want to animate. Click Add Effect , click the entrance, emphasis, or exit animations you want, and then click OK . To change the order of animations, under Animation order , click the animation, and then click one of the arrows to move it up or down in the list. Select options for timing, direction, and speed. To set additional options, click Effect Options . To see a preview of the animation, click Play . At any time, you can preview the animation for a slide by clicking Animation Preview on the Slide Show menu. You can also view the slide show to see your animation in action.
This slide also uses the Bulleted List slide layout. After we typed the text, we changed the text and bullet styles by selecting the line of text and then using the Formatting Palette to change formatting as follows: Second bullet. Under Font , change the font name and color. Third bullet. Under Bullets and Numbering , on the Style pop-up menu, click a bullet style. Fourth bullet. Place the insertion point in front of the text and press the TAB key. You can use SHIFT+TAB to decrease the indent. Slide Transition PowerPoint comes with a set of special effects, or slide transitions, that you can use to control the way you advance from one slide to another. It’s easiest to specify slide transitions using the Slide Sorter toolbar that is displayed in slide sorter view. In this presentation, we used variations of the Cube transition to move from slide to slide. To add slide transitions: On the View menu, click Slide Sorter . Select the slides you want to apply the slide transitions to. In the Slide Transition Effects pop-up menu on the Slide Sorter toolbar, click a slide transition, for example, Cube Left . By default, the transition will occur during the slide show at a fast speed when the mouse is clicked. To change these defaults or to add sound to the transition, on the Slide Sorter toolbar, click Slide Transition to display the Slide Transition dialog box. You’ll see the slide transitions in action when you view the show. Click Rehearse Timings to preview the length of time the transition will take.
This slide uses the Organizational Chart slide layout, which includes a placeholder for an organizational chart. To create an organizational chart by using the Organizational Chart slide layout: Double-click the organizational chart icon. Organization Chart opens, with some boxes already in place to get you started. Change the structure as required. You can delete an unnecessary box by selecting it and pressing DELETE. Add a box by clicking the type of relationship you want to create in the toolbar and then clicking the box with which to form the relationship. For example, you can create our chart structure as follows: a. Click one of the subordinate boxes and press DELETE to delete it. b. Click Subordinate , and then click a box on the second tier. Do this twice for each of the two boxes on the second tier. Type the names and titles in the boxes. Color and format the text by selecting it and then clicking options on the Text menu. Color the boxes by selecting them and then clicking options on the Boxes menu. Color and format the connecting lines by selecting them and then clicking options on the Lines menu. When you’re finished creating the chart, on the File menu, click Update and Return to Object in YourPresentation .ppt to insert the chart into the PowerPoint presentation. After the chart is in the presentation, it becomes a graphic that you can move and resize. To edit the chart, double-click it to make your changes in Organization Chart.
On this slide, we embedded an existing Excel chart. When an object, such as a chart, is copied, information in the destination file (this presentation) doesn't change if you modify the source file (the Excel file). We embedded the chart rather than copying it into the presentation so that we could continue to edit it in Excel. To embed an Excel chart: In Excel, copy the chart. In PowerPoint, on the Formatting Palette , under Add Objects , click the Text Chart slide layout. Then click the chart placeholder. On the Edit menu, click Paste Special, click Microsoft Excel Chart Object , and then click OK . The chart appears within the confines of the box. Widen the box for the chart and narrow the box for the text so that the chart can be viewed more easily. To do this, select each box and drag the handles in the desired direction. Hold down SHIFT as you drag to keep from distorting the chart image. For more information, search for “embedded object” in Help.
We changed both the background design and the text color on this slide only--just to get your attention! Here's how we did it. On the Format menu, click Slide Design , and then click the name of the design you want. Click Apply to the current slide , and then click Apply . You can also see previews of the designs in the Project Gallery. On the New tab, click the arrow next to Presentations , click Designs , and then click the design name. You’ll find even more designs on the Microsoft website at http://www.microsoft.com/mac/.
Once you’ve completed your presentation, it’s a good idea to preview it before showing it. Use the slide show view to turn your monitor into a projector-like screen to display your presentation. To preview a presentation: On the Slide Show menu, click View Show . Or click Slide Show in the bottom-left corner of the window to start the show from the current slide. 2. Click to advance through the presentation one slide at a time. If you created on-mouse-click animations, each click displays the next animation. If you want to end a presentation before you reach the last slide, press ESC. You have several options for saving your presentation: as a slide show, a PowerPoint Package, a PowerPoint Movie, or a Web page. To see your options, on the File menu, click the Save As command. On the Format pop-up menu, click the file format you want. You might want to create notes for each slide to help you remember key points during a presentation. On the View menu, click Notes Page . You can also print slide handouts to help those attending the presentation to retain key points for future reference. To indicate what you want to print, on the File menu, click Print. On the Print What pop-up menu, click what you want to print. If you’re going to give your presentation on a second monitor, use the presenter tools, a new feature in PowerPoint 2004. First attach the second monitor and turn video mirroring off. Then, on the Slide Show menu, click View Presenter Tools to give the presentation. Photo credits are listed in the Office for Mac 2004 Read Me file.