Download as PDF, PPTX


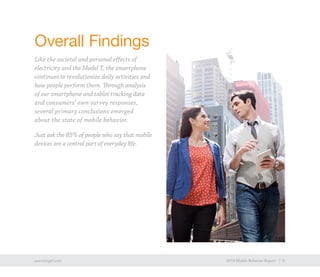


The 2014 Mobile Behavior Report analyzes consumer mobile device usage through tracking and surveys, revealing that 85% of participants consider mobile devices essential to daily life. The study highlights that consumers primarily associate mobile with smartphones, while tablets are viewed as companion devices rather than replacements. Key findings emphasize the need for brands to improve mobile content experiences and allow easy access across devices to engage consumers effectively.


