Downloaded 17 times

![Mobile Content and Activities Roundup Copyright ©2015 eMarketer, Inc. All rights reserved. 15
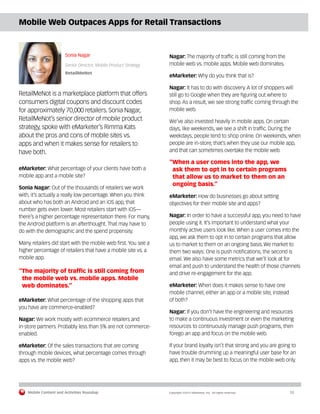
Terra’s Research Points to Hispanics as Largest Mobile
Content Viewers
Soizic Sacrez
Director of Marketing
Terra
Soizic Sacrez, director of marketing for Terra, a
global digital media company, discussed with
eMarketer the findings in Terra’s latest round
of research into US Hispanics’ media usage,
revealing insights into why Hispanics are more
likely to access video content via mobile and pay
for video content.
eMarketer: Terra’s research shows that Hispanics are
accessing entertainment content on mobile at a much
higher rate than non-Hispanics. Did the research give you
some idea of why this is?
Soizic Sacrez: We’ve been seeing this trend over the
course of the past few studies—Hispanics overindex on
everything mobile. Specifically for entertainment, Hispanics
are passionate about music, entertainment and sports, and
they like to be up to date on what is going on with artists
and athletes they are following. Overall, it’s a cultural point.
eMarketer: Are you seeing this behavior across all ages?
Or is it more likely to be a millennial behavior?
Sacrez: We are seeing some differences through the
generations. For instance, looking at the data for listening
to music on smartphones, 76% of millennials said that they
were listening to music on their smartphones, vs. 68% of
Gen X and 43% of baby boomers. And some of this has to
do with technology adoption [since younger generations
are more likely to use digital technology]. But if we look at
the whole group of Hispanics, in general, they are going to
listen more to music [than non-Hispanics].
eMarketer: The research also showed that Hispanics are
more likely to pay for access to entertainment content.
When there is so much free content, why are Hispanics
paying for content?
Sacrez: It depends on the category, but much of it has to
do with watching a program live rather than after the fact.
Sports, especially, are a passion point. Boxing and soccer
are key sports among Hispanics, and they are willing to
pay to experience the game live. Especially if they follow
a specific boxer or a specific team, they are more likely
to pay.
eMarketer: The research also shows that Hispanics are
more likely to access this content on smaller screens—
smartphones, tablets—than non-Hispanics. Did you get
some indication as to why this is?
Sacrez: Hispanics overindex in everything mobile, and we
have seen that throughout our studies. We’re seeing a lot
of [video] consumption on the go. It’s primarily a comfort
level [they have with mobile devices]. In Latin America,
too, there is a lot of mobile consumption. They are more
connected to their families and friends through their
smartphones; for instance, when they are in a retail store
they will send a picture of the product to their family, more
so than the non-Hispanics. So, mobile consumption of
video is comfortable for them.
eMarketer: Is the content they are consuming more likely
to be in Spanish or English?
Sacrez: We’ve seen that millennials are more likely than
Gen X to favor some online content in Spanish. And that’s
interesting, because that shows an attachment among
the younger generation to their culture and to the Spanish
language. I think it has to do with pride in their heritage. We
do see also that Spanish-preferred Hispanics tend to be
a bit more engaged, for instance, in commenting, sharing
and participating than the English-preferred Hispanics,
and that’s true in particular for live events around sports
entertainment and music.](https://image.slidesharecdn.com/emarketermobilecontentactivitiesroundup-150413040654-conversion-gate01/85/E-marketer-mobile_content_activities_roundup-15-320.jpg)

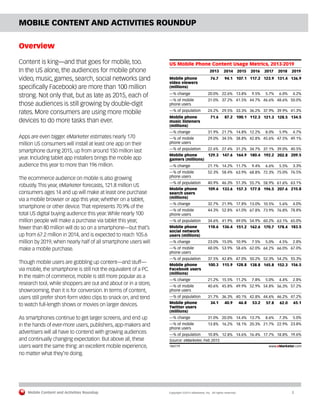
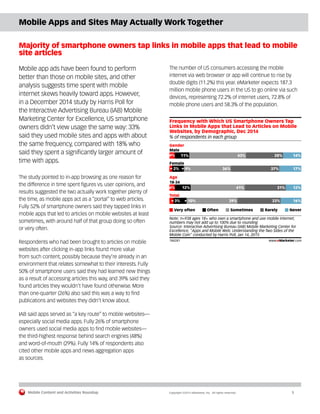
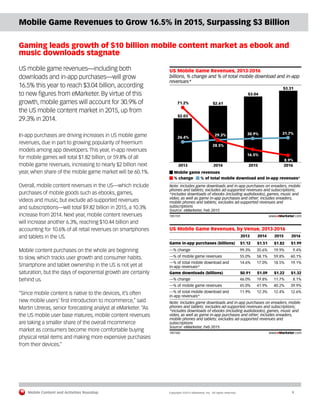
As of April 2015, over 100 million US consumers engage with mobile content, significantly driving the demand for a superior mobile experience. A report by eMarketer highlights the rapid growth in mobile activities, such as video streaming and mobile shopping, with 121.8 million consumers expected to make mobile purchases that year. While mobile is favored for research and immediate deals, it has not fully replaced PCs for all content types, emphasizing the ongoing evolution of user expectations in the mobile landscape.


