More Related Content
Similar to S3 dfd1 context diagram pdf (20)
S3 dfd1 context diagram pdf
- 1. Copyright © 2009 Bahn, D., Tang, H. & Yardley, A. All Rights Reserved. ISBN: 978-1-936203-05-5
Systems Analysis and Design
Learning Module Series #3
Document version
Data Flow Diagrams
Part 1
Creating an Intersection Table in a Relational Database
Overview
In this tutorial we will explain the basic symbols used in a data flow diagram, initialize a new diagram and
create a context diagram depicting a Reservation System.
What is a Data Flow Diagram (DFD)?
A data flow diagram is a graphical process model that shows all the main requirements an information system in
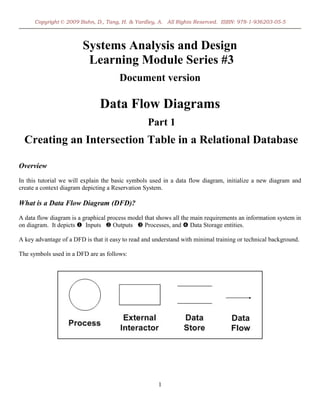
on diagram. It depicts Inputs Outputs Processes, and Data Storage entities.
A key advantage of a DFD is that it easy to read and understand with minimal training or technical background.
The symbols used in a DFD are as follows:
1
- 2. Copyright © 2009 Bahn, D., Tang, H. & Yardley, A. All Rights Reserved. ISBN: 978-1-936203-05-5
City Lights Bed and Breakfast – Case Study
Potential visitors to the Twin Cities call up City Lights Bed and Breakfast to inquire as to available locations to
stay in over their visit to Minneapolis/St. Paul, MN. Each caller is interviewed over the phone by a bookings
clerk. If the caller is interested in using the reservation service, the bookings clerk records the inquiry (the
desired dates of arrival and departure, location and accommodation preferences) as a reservation request for the
potential guest.
The bookings clerk then identifies host accommodations that may be suitable to fulfill the reservation request.
Accommodations are referenced against the current host location bookings schedule to determine if they are
available during the time period that the potential guests intend to stay in the Twin Cities. After finding suitable
host accommodations that appear to be available at the requested time period, the bookings clerk contacts the
host to verify if the desired accommodations are available and confirm that guest demographics (as described
during the initial intake survey) contain no disqualifying criteria and meet with the hosts approval.
If all conditions are satisfactory, i.e. the dates are available and the host is willing to approve their stay, the
bookings clerk now contacts the potential guests to confirm that the location is suitable and the guest wishes to
authorize completion of the reservation transaction. With the guest’s approval, the clerk submits the guest’s
credit card information to initialize a reservation transaction.
After confirming the credit card information electronically (via the Credit Card Bureau) and recording the
reservation, the bookings schedule is updated and notification is sent to the host confirming the booking, along
with the details of the stay. Concurrently, a final reservation confirmation (letter or fax) is dispatched the guest.
Creating a Context Diagram
Five steps are involved:
1. Identify one process that will be placed in the middle of the diagram to represent the total information
processing system. This central information process, contained within an automation boundary, will be
called the System Process.
2. Identify all potential actors from the case study narrative that produce or consume data from the system.
These actors are called External Entities.
3. Identify primary potential stores of data used by the system its transactions. These are called Data
Stores.
4. Brainstorm and elaborate all potential streams of data that flow to and from the System Process, i.e. to
or from the External Entities and Data Stores). These are called Data Flows and must always flow into
or out of a process.
5. Eliminate those external entities which do not have any Data Flows connecting them to the System
Process.
2
- 3. Copyright © 2009 Bahn, D., Tang, H. & Yardley, A. All Rights Reserved. ISBN: 978-1-936203-05-5
Bird’s eye view of completed model
How to Create our DFD in MS Visio
1. Open MS Visio. From the Menu bar, click File and select: New… Flowchart… Data Flow Diagram
(US units).
3
- 4. Copyright © 2009 Bahn, D., Tang, H. & Yardley, A. All Rights Reserved. ISBN: 978-1-936203-05-5
The System Process
Since this is a context diagram, our first step is to insert a single System Process in the center of our
diagram. This automation boundary will represent the total reservation system of City Lights B&B.
2. From the Shapes Window Pane, drag the Data Process item to the center of the workspace grid.
Double-click on the shape to name it City Lights B&B Reservation System.
4
- 5. Copyright © 2009 Bahn, D., Tang, H. & Yardley, A. All Rights Reserved. ISBN: 978-1-936203-05-5
The External Entities
DFD also contains “External Entities” that are producers and consumers of data transformed by processes.
A context DFD depicts all the significant External Entities that either input Data Flows for the system to
process, or consume Data Flows that are output from the system.
In our Case Study narrative, there are three such actors or External Entities: The (potential) Guest, the Host,
and the Bookings Clerk (who mediates and facilitates between the other two).
3. Drag three External Entity items from the Shapes Window Pane to the workspace grid. Double-click on
the shapes, one at a time, labeling them Guest, Clerk and Host respectively.
.
The Data Stores
DFD’s also contain “Data Stores” that represent flows of data that have been stored for a while prior to
being used again, or more simply data flows in storage. (Think of them like a database or file cabinet). If we
identify the Data Stores in our case study, we find that we there are two: The Host Location Booking
Schedule (mentioned explicitly), and the Credit Card Bureau (implied in the process of payment
confirmation from an external source).
4. Drag two Data Store items from the Shapes Window Pane to the workspace grid. To add text, click
Insert on the Menu bar and select Text Box.
5
- 6. Copyright © 2009 Bahn, D., Tang, H. & Yardley, A. All Rights Reserved. ISBN: 978-1-936203-05-5
Data Store
The Data Flows
Data Flows operate in one of two directions, and can be considered from different perspectives. The Visitors
perspective includes “Producing” data flows, such as: Reservation Request and Payment Information;
as well as “Receiving” data flows, such as: Potential Booking Options and Confirmation of a
Completed Booking.
The Host’s perspective includes “Producing” data flows, such as: Confirmation of host location
availability and Confirmation of Reservation Suitability; as well as “Receiving” data flows, such as:
Reservation Request and Request for Suitability/Availability approval.
“Other” data flows include: Confirmation of Credit Card information, Potential availability of Host
Location, and Completed Reservation.
______
Note: In Visio, data flows can be represented by a curved connector or a straight-lined/angular
connector. In this tutorial, we will be using the straight-lined/angular which is the default connector that
the connector tool supplies:
To use the connector tool, first, click the button on the toolbar; second, use the mouse to draw the
connection, in the appropriate direction, on Visio work space grid.
6
- 7. Copyright © 2009 Bahn, D., Tang, H. & Yardley, A. All Rights Reserved. ISBN: 978-1-936203-05-5
In the next set of steps, we will place data flows onto the diagram, identifying those flows from the
perspectives of each external entity, according to the case narrative:
5. Draw the following data flows from the Guest’s Perspective:
Reservation Request (guest, producing)
Payment Information (guest, producing)
Potential Booking (guest, receiving)
Confirmation of Completed Booking (guest, receiving)
6. Draw the following data flows from the Host’s Perspective:
Reservation request Availability Confirmation (host, producing)
Reservation (location/dates etc.) Suitability Confirmation (host, producing)
Request for Availability/Suitability confirmation (host, receiving)
Request for Booking Confirmation (host, receiving)
7
- 8. Copyright © 2009 Bahn, D., Tang, H. & Yardley, A. All Rights Reserved. ISBN: 978-1-936203-05-5
Based on our narrative … the potential availability of a Host location is looked up by the Bookings Clerk in
the Host Locations Booking Schedule data store. Similarly, the completed reservation is posted back to the
Schedule by the Clerk.
7. Draw the following Other data flows:
Reservation request Availability Confirmation (host, producing)
Reservation (location/dates etc.) Suitability Confirmation (host, producing)
Request for Availability/Suitability confirmation (host, receiving)
Request for Booking Confirmation (host, receiving)
However, a closer look at the above diagram reveals that it is in violation of our key rule: All data must
flow to, or from, a process! Stated differently, the DFD only shows data that undergoes transformation.
Both of these data flows are in violation of this rule, since the Clerk does not represent a process, nor does
any data get transformed through him/her.
Therefore, the next step is to Delete the Clerk , and present the data flow, rather as in :
8
- 9. Copyright © 2009 Bahn, D., Tang, H. & Yardley, A. All Rights Reserved. ISBN: 978-1-936203-05-5
8. Similarly, draw the following Other data flows:
Confirmation of Credit Card Information (system receiving from external data store)
9
- 10. Copyright © 2009 Bahn, D., Tang, H. & Yardley, A. All Rights Reserved. ISBN: 978-1-936203-05-5
The Final Product
In this tutorial then, we learned how to construct a context data flow diagram.
In Part II - the next tutorial, we will learn how to construct a Level 0 DFD which depicts the processes and
data flows at the next granular level of detail; and further refine our context diagram using some advanced
rules of DFD presentation.
10
- 11. Copyright © 2009 Bahn, D., Tang, H. & Yardley, A. All Rights Reserved. ISBN: 978-1-936203-05-5
Systems Analysis and Design
Learning Module Series #3
Document version
Data Flow Diagrams
Part 1
Creating an Intersection Table in a Relational Database
11